
Belgium February 2025: Renault up 84.1%, Tesla off -53.7%
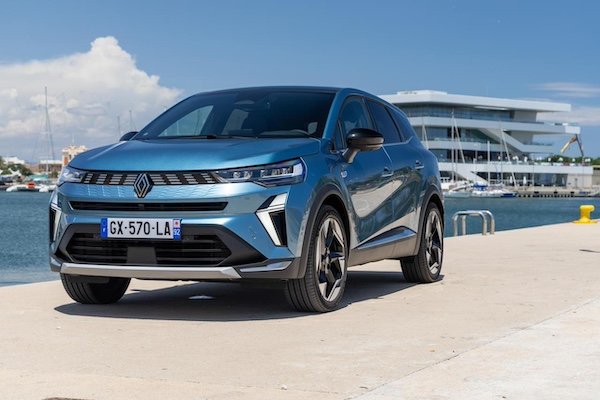
Renault sales surge in Belgium in February.
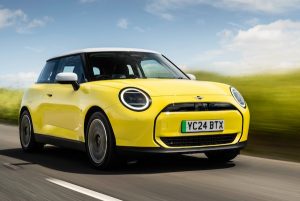
Another disappointing month for Belgian new car sales in February at -8.1% year-on-year to 40,161 units. This way, the year-to-date tally recedes -10.7% or almost 10,000 sales to 80,755. BMW (-1.3%) leads the brands charts again but drops to 10.7% share after reaching a record 14.8% last month. Volkswagen (+6.1%) advances to #2 but the best performer of the month is Renault up a stellar 84.1% to climb to #3 overall. It holds 9.2% share vs. 6.5% year-to-date. The next 8 carmakers all lose ground year-on-year, with Volvo (-33.8%), Audi (-22.6%) and Toyota (-22.5%) hit the hardest and Peugeot (-1.9%), Dacia (-5.3%) and Kia (-8.4%) resisting best. Mini (+30.4%) and Ford (+7.1%) are the only additional gainers in the Top 20. Tesla implodes -53.7% to #14.
Previous month: Belgium January 2025: BMW breaks share record again in weak market (-13%)
One year ago: Belgium February 2024: Tesla, Dacia accelerate in solid market
Full February 2025 Top 68 All brands ranking below.
Belgium February 2025 – brands:
PosBrandFeb-25%/24Jan2025%/24PosFY241BMW4,31110.7%– 1.3%110,30911.4%+ 5.2%112Volkswagen3,8869.7%+ 6.1%37,5188.3%+ 6.3%223Renault3,7109.2%+ 84.1%75,9336.5%+ 51.5%484Mercedes2,4846.2%– 13.1%26,1716.8%– 8.5%345Audi2,4416.1%– 22.6%54,8815.4%– 36.9%536Dacia2,2285.5%– 5.3%44,7515.2%+ 1.7%657Peugeot2,1545.4%– 1.9%84,0074.4%– 14.1%898Toyota2,1155.3%– 22.5%64,3554.8%– 18.4%779Kia1,7194.3%– 8.4%93,4793.8%– 5.5%91210Skoda1,5323.8%– 21.7%132,8053.1%– 28.6%111111Volvo1,5213.8%– 33.8%103,0093.3%– 46.0%10612Ford 1,3043.2%+ 7.1%122,6402.9%+ 0.5%121513Hyundai1,2813.2%– 6.2%112,6212.9%+ 4.8%131314Tesla1,0532.6%– 53.7%152,0612.3%– 49.7%151015Citroen1,0302.6%– 32.9%142,2112.4%– 4.9%141416Opel1,0152.5%– 7.9%171,7421.9%– 11.7%171617Nissan9992.5%– 7.3%161,9732.2%– 5.1%161718Seat6231.6%– 7.0%239531.1%– 17.2%192219Mini5401.3%+ 30.4%189951.1%+ 12.7%181920Suzuki4191.0%– 35.2%198721.0%– 30.2%202121Land Rover4071.0%– 25.3%207870.9%– 42.4%212022MG3901.0%+ 85.7%256660.7%+ 35.1%232423Cupra3540.9%+ 27.3%227150.8%+ 9.3%222624Fiat3420.9%– 0.9%285440.6%– 15.0%272525Mazda3130.8%– 55.7%265670.6%– 57.4%251826Porsche2550.6%– 20.8%216260.7%– 9.8%242327Polestar2480.6%+ 25.9%245480.6%+ 63.1%262828Honda2310.6%+ 5.5%313750.4%– 20.2%293029BYD2230.6%+ 55.9%274700.5%+ 71.5%282730Jeep2060.5%+ 17.7%323380.4%– 16.7%312931Alfa Romeo1710.4%+ 122.1%293450.4%+ 33.7%303432Lexus1310.3%+ 15.9%302810.3%+ 16.1%323133SsangYong/KG Mobility770.2%– 49.7%351610.2%– 43.1%343234DS710.2%– 54.8%331610.2%– 28.8%333335Xpeng680.2%n/a341540.2%+ 15300.0%354036Leapmotor430.1%new38950.1%new374937Smart410.1%– 12.8%361130.1%+ 9.7%363538Lotus240.1%– 7.7%39460.1%+ 4.5%393739Alpine200.0%+ 33.3%42380.0%+ 15.2%404340Maxus170.0%+ 1600.0%37720.1%+ 2300.0%384141Lancia140.0%new40340.0%new415142Maserati130.0%+ 160.0%48260.0%+ 62.5%434443Tripod130.0%+ 0.0%50230.0%– 8.0%474544Ferrari110.0%– 21.4%41300.0%+ 11.1%424245Jaguar110.0%– 74.4%47240.0%– 80.8%453646Subaru100.0%– 63.0%44250.0%– 45.7%443947Forthing90.0%– 18.2%53150.0%– 25.0%524648DFSK90.0%n/a57120.0%+ 20.0%545249Livan90.0%new –90.0%new566250Lamborghini80.0%+ 33.3%52170.0%+ 13.3%514851Aston Martin70.0%– 22.2%43230.0%+ 109.1%465052BAIC70.0%– 46.2%49200.0%– 23.1%494753Bentley60.0%– 25.0%45200.0%– 4.8%485354AMF50.0%n/a6070.0%n/a586855Allied Vehicles40.0%– 69.2%5590.0%– 59.1%555456Lynk & Co30.0%– 92.5%46170.0%– 82.5%503857Dongfeng30.0%new51130.0%new53 –58FAW30.0%+ 0.0%5860.0%+ 20.0%605759SWM30.0%+ 200.0%5950.0%+ 150.0%616160Caterham30.0%n/a6540.0%n/a627161B-Style & Flex-I-Trans20.0%n/a5480.0%n/a577262Omoda20.0%new5660.0%new596663McLaren20.0%n/a6330.0%– 25.0%645964Alpina20.0%– 33.3%6430.0%– 25.0%656065Voyah20.0%new –20.0%new667666Rolls-Royce10.0%n/a6130.0%– 40.0%635867Morgan10.0%n/a –10.0%n/a686468Man10.0%+ 0.0% –10.0%– 50.0%6970
Source: Febiac

More Stories
Italy Full Year 2025: Fiat Panda #1 for 14th straight year, Grande Panda disappoints
This content is for members only. Visit the site and log in/register to read.
Spain Full Year 2025: Dacia Sandero and Renault Clio in the lead in strongest market in 6 years
This content is for members only. Visit the site and log in/register to read.
OEM vs Replica Wheels: What Drivers Really Need to Know
If you spend any time shopping for wheels online, you’ll notice something quickly: the same “look” can cost $200 from...
2027 Ram Power Wagon Finally Gets the Diesel It Deserves
Ram has been on a bit of a listening tour lately, and the 2027 Power Wagon feels like the loudest...
2027 Ram 1500 SRT TRX Roars Back with 777 HP and a Price Punch
Ram didn’t just bring the TRX back, it brought it back with a point to prove. After the supertruck bowed...
Saudi Arabia November 2025: Hyundai places Accent at #1 and i10 at #4
This content is for members only. Visit the site and log in/register to read.