
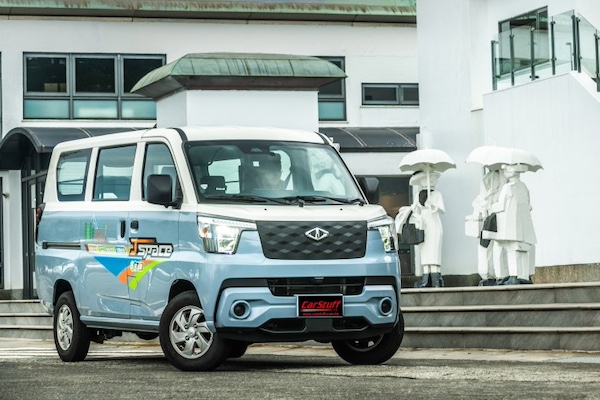
Taiwan February 2025: CMC J Space cracks podium
The CMC J Space is up to a record third place in Taiwan in February.
New car sales in Taiwan edge up 4.8% year-on-year in February to 27,515 units, leading to a year-to-date tally off -12% to 62,579. Toyota (+4.7%) matches the market to a more reasonable 28.8% share vs. a record 36.4% in January. It is followed once again by Lexus (+31.3%) at 9% vs. 10.2% last month while CMC (+53.2%) soars past Mercedes (+29.3%) to close out the podium. Kia (+77.5%) jumps from outside the January Top 10 directly to 6th place with 4% share, just as Tesla (+11887.5%) posts a surreal gain to land at #10. BMW (+50.5%) and Ford (+13.6%) also beat the market.
Model-wise, the Toyota Corolla Cross (+42.2%) leaps up to 8.8% share, with the Toyota RAV4 (+0.4%) stable at #2. The new CMC J Space leaps to #3, its first ever podium finish at home. The Toyota Yaris Cross (+15.1%) is knocked down to #3 while the Toyota Town Ace (-20.1%) repeats at #5. The Tesla Model Y is up 17 spots on January to #6, followed by the Lexus NX (-9.9%), Honda CR-V (-1.8%) and Toyota Corolla Altis (-13.9%) all underperforming. The Kia Carnival (+584%) breaks into the Top 10 for the first time at #10.
Previous month: Taiwan January 2025: Toyota and Lexus at all time high
One year ago: Taiwan February 2024: MG up to record third place, sales off -20% on Lunar New Year
Full February 2025 Top 13 brands and Top 50 models below.
Taiwan February 2025 – brands:
PosBrandFeb-25%/24Jan2025%/24PosFY241Toyota7,91128.8%+ 4.7%120,67233.0%+ 4.2%112Lexus2,4769.0%+ 31.3%26,0679.7%+ 22.2%223CMC1,8776.8%+ 53.2%43,9726.3%+ 10.2%774Mercedes1,7266.3%+ 29.3%34,8127.7%+ 5.5%345Honda1,6386.0%+ 9.6%52,9964.8%– 37.8%436Kia1,0954.0%+ 77.5%n/a1,5122.4%– 15.1%n/an/a7Hyundai1,0533.8%– 34.2%72,2943.7%– 47.1%558Ford1,0093.7%+ 13.6%n/an/an/an/an/an/a9BMW9723.5%+ 50.5%62,3293.7%– 1.9%6610Tesla9593.5%+ 11887.5%n/a1,3242.1%+ 6520.0%n/a1111Mitsubishi9303.4%+ 4.8%101,9013.0%– 16.9%10912Mazda8973.3%– 30.5%92,0163.2%– 6.3%121213Nissan8563.1%– 25.9%82,0273.2%– 36.0%88
Taiwan February 2025 – models:
PosModelFeb-25%/24Jan2025%/24PosFY241Toyota Corolla Cross2,4238.8%+ 42.2%16,75910.8%+ 38.7%112Toyota RAV41,5935.8%+ 0.4%23,7005.9%+ 17.0%233CMC J Space1,3454.9%new62,7634.4%new4504Toyota Yaris Cross1,0603.9%+ 15.1%32,8894.6%+ 7.8%345Toyota Town Ace1,0393.8%– 20.1%52,5844.1%– 22.6%526Tesla Model Y8903.2%n/a231,2001.9%n/a11107Lexus NX8363.0%– 9.9%42,4433.9%+ 11.1%668Honda CR-V7992.9%– 1.8%101,4282.3%– 48.9%959Toyota Corolla Altis5932.2%– 13.9%71,6422.6%– 21.6%7710Kia Carnival5542.0%+ 584.0%n/a5540.9%+ 175.6%27n/a11Ford Focus5031.8%– 1.6%337481.2%– 46.6%201612Mitsubishi Delica4831.8%+ 12.9%159861.6%– 16.7%131313Lexus RX4721.7%+ 57.9%91,2832.1%+ 32.0%102114Mercedes GLC Class4651.7%+ 84.5%81,4792.4%+ 15.8%81215CMC Zinger4381.6%– 4.4%111,0381.7%– 35.4%121416Honda Fit4101.5%+ 67.3%217991.3%+ 4.6%172017Lexus UX3921.4%+ 159.6%149301.5%+ 58.2%143118Honda HR-V3831.4%– 0.3%246861.1%– 38.1%211819Ford Kuga3251.2%n/a177651.2%n/a182320Mazda CX-53201.2%– 23.6%187511.2%+ 23.3%192221Hyundai Tucson3171.2%– 50.7%325660.9%– 66.9%251122Toyota Vios2991.1%– 4.5%128861.4%– 4.4%152423Lexus LM2861.0%+ 95.9%494050.6%– 12.5%41n/a24Nissan Kicks2841.0%– 20.7%206741.1%– 32.9%221925MG HS2771.0%– 74.0%385060.8%– 80.5%32926Lexus LBX2751.0%+ 62.7%375060.8%+ 199.4%314127Hyundai Venue2641.0%+ 12.8%265590.9%– 8.7%263228Hyundai Porter2590.9%#DIV/0!473890.6%#DIV/0!423329Luxgen n72510.9%+ 325.4%138151.3%+ 870.2%161530Suzuki Swift2490.9%+ 15.3%444440.7%– 11.0%364031Porsche Macan2360.9%#DIV/0!226211.0%+ 215.2%24n/a32Mazda32360.9%– 2.9%285150.8%+ 1.6%303733Toyota Alphard2360.9%+ 242.0%404510.7%#VALUE!35n/a34Toyota Camry2230.8%+ 25.3%294950.8%+ 14.6%333435Nissan Sentra2180.8%+ 11.8%255170.8%– 21.7%293036Mercedes GLE Class2080.8%– 22.7%304710.8%– 7.5%344637Nissan X-Trail2060.7%– 34.8%196311.0%– 29.1%231738Kia Sportage1950.7%– 41.1%364280.7%– 59.8%372639Mitsubishi Colt Plus1950.7%– 1.0%394240.7%– 13.6%394340Fuso Canter1640.6%#DIV/0!502820.5%#DIV/0!47n/a41Lexus ES1580.6%+ 2.6%314140.7%– 7.0%404742Toyota Sienta1440.5%#DIV/0!353860.6%#DIV/0!433843Mercedes E Class1410.5%+ 7.6%274240.7%– 1.4%383944Mercedes V Class1350.5%#DIV/0!433320.5%+ 138.8%45n/a45VW T-Roc1310.5%– 18.1%n/an/an/an/an/an/a46Mazda CX-301290.5%– 16.2%423350.5%+ 8.8%444247Mazda CX-601270.5%– 66.9%n/a2150.3%– 44.0%n/a4548Mercedes GLA Class1200.4%+ 96.7%413300.5%– 34.4%46n/a49VW Tiguan1130.4%– 34.7%n/an/an/an/an/a3650Mercedes C Class1100.4%– 23.1%452540.4%– 41.7%49n/a
Source: u-car.com.tw

More Stories
How Mechanical Design Influences the Feel of a Vehicle
You know that feeling. You slide into the driver’s seat. You press the start button. The vehicle comes alive. It...
Competition Time. Chance to win a Smallest Cog goodies bundle.
The Smallest Cog Unveils Exciting New Merchandise Range Inspired by Richard Hammond’s iconic restoration workshop, The Smallest Cog’s exclusive new...
Florida Tolls Could Vanish for Residents as Tourists Pick Up the Tab
Florida drivers may eventually cruise the Turnpike without paying a cent at the toll gantries if a new idea from...
Extending Vehicle Lifespan Through Proven Engine Technology
We all want our cars to last. A vehicle is a major investment. It gets us to work. It takes...
China retail November 2025: Fang Cheng Bao, Lynk & Co hit all-time highs, market off -16.8% on high year ago basis
This content is for members only. Visit the site and log in/register to read.
China imports November 2025: Market down -20%, BMW 7 Series (+88.9%) and 2 Series (+53.8%) shoot up
This content is for members only. Visit the site and log in/register to read.