
Sweden February 2025: VW ID.7 and Kia EV3 superstars
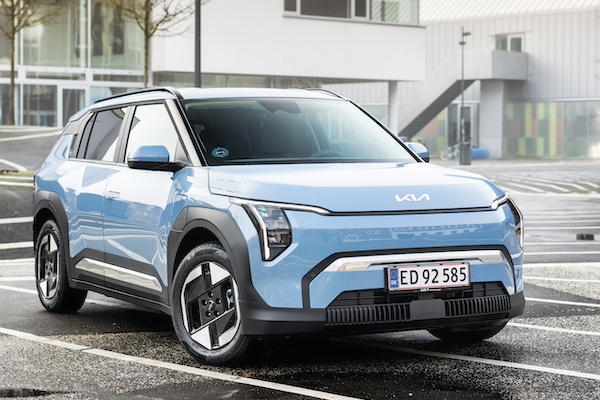
The Kia EV3 is up to 4th place in Sweden in February.
Swedish new car sales gain 4.5% year-on-year in February to 19,608 units, meaning the year-to-date tally is now up 9.2% to 39,240. Rechargeable cars are up 23.2% to 11,978 and 61.1% share vs. 51.8% a year ago. This is split between 6,872 BEVs (+31.8%) at 35% share vs. 27.8% in February 2024 and 5,106 PHEVs (+13.2%) at 26% share vs. 24% a year ago. Year-to-date, BEVs are up 23.8% to 31.9% share while PHEVs gain 11.3% to 24.4% share.
After a month of January reshaped by an impending tax surge on ethanol vehicles, the brands ranking returns to some kind of normality this month. Notably Subaru, #3 with 2,580 sales and 13.1% share last month screeches to a halt with just 9 sales (-97.5%) in February. Volvo (-0.3%) is stable at #1 with 18.7% share with Volkswagen (+76.7%) surging to 15.3% of the market. Kia (+5%) is up two spots to #3 while Toyota (-18.4%) struggles year-on-year but stays at #4. Skoda (+50.6%), BMW (+21.7%) and Mercedes (+13.7%) also shine in the remainder of the Top 10, with Cupra (+71.6%) and Polestar (+66%) making themselves noticed below. Tesla is down -42.1%.
Model-wise, the Volvo XC60 (+25%) lodges a third win in the past 5 months and ascends to # 1 year-to-date also. Far below, the Volvo XC40 (+3.9%) rallies back up 5 spots on January to #2 with 3.7% share, distancing the VW ID.7 shooting up 4038.5% year-on-year to stay at #3. The new Kia EV3 is up 20 ranks on last month to a record 4th place with 2.5% of the market. Leader over the Full Year 2024, the Tesla Model Y crashes -52.1% to #4. Excellent scores also by the Skoda Kodiaq (+219.4%), VW Tiguan (+139.3%), ID.4 (+69.5%) and Golf (+46.3%).
Previous month: Sweden January 2025: Subaru Outback surprise leader, Forester and Crosstrek in Top 10
One year ago: Sweden February 2024: Volvo XC60 repeats at #1, EX30 breaks into Top 10
Full February 2025 Top 56 All brands and Top 283 All models below.
Sweden February 2025 – brands:
PosBrandFeb-25%/24Jan2025%/24PosFY241Volvo3,65818.7%– 0.3%16,75017.2%+ 0.0%112Volkswagen2,99215.3%+ 76.7%25,83814.9%+ 58.1%223Kia 1,4827.6%+ 5.0%52,7176.9%+ 5.1%454Toyota 1,4367.3%– 18.4%43,0337.7%– 12.6%345Skoda 1,2836.5%+ 50.6%82,1195.4%+ 38.7%786BMW 1,1635.9%+ 21.7%72,1635.5%+ 21.5%697Mercedes 1,0975.6%+ 13.7%91,8904.8%– 7.7%968Audi 1,0125.2%+ 3.0%62,0225.2%– 3.2%879Peugeot 7123.6%– 5.4%101,3333.4%+ 5.5%101010Tesla6133.1%– 42.1%131,0182.6%– 43.1%11311Polestar4982.5%+ 66.0%129712.5%+ 82.5%121112Cupra4652.4%+ 71.6%119642.5%+ 126.8%131213Ford 3701.9%– 11.5%146381.6%– 29.3%141314Renault3511.8%+ 32.0%175631.4%+ 20.3%151515Nissan 3061.6%– 7.3%185101.3%– 24.7%171716Hyundai 3051.6%+ 15.1%165211.3%– 14.2%162017Dacia2481.3%+ 42.5%194411.1%+ 34.0%181818Porsche1891.0%– 25.3%154281.1%– 10.6%191619Opel 1620.8%+ 29.6%222840.7%– 9.0%212320Seat1460.7%– 33.0%262180.6%– 40.1%232121Lexus1440.7%– 47.3%203300.8%– 32.0%202222Mazda 1210.6%– 33.9%212710.7%– 21.4%222423Fiat 880.4%+ 1.1%281420.4%+ 26.8%272624MG870.4%– 13.0%251690.4%– 60.2%251925Mini 840.4%+ 37.7%231950.5%+ 46.6%243126Suzuki 830.4%– 65.8%331270.3%– 61.2%282727Honda 780.4%+ 50.0%321240.3%+ 4.2%292928BYD620.3%+ 6.9%241470.4%+ 21.5%263229Xpeng610.3%+ 56.4%291130.3%+ 50.7%303330Zeekr550.3%+ 3.8%301040.3%+ 96.2%322831Citroen 450.2%– 76.2%271070.3%– 66.9%312532Land Rover430.2%– 29.5%31910.2%– 22.9%333533Mitsubishi300.2%– 62.0%36510.1%– 62.8%353434Lynk & Co280.1%– 65.0%34660.2%– 47.2%343035Alfa Romeo260.1%+ 766.7%40300.1%+ 400.0%374636Subaru 90.0%– 97.5%32,5896.6%+ 321.0%51437Jeep90.0%n/a37240.1%n/a384838Jaguar70.0%+ 133.3%42110.0%+ 22.2%404739DS70.0%+ 0.0%45100.0%+ 0.0%415340Lamborghini70.0%+ 16.7%47100.0%+ 11.1%424441Ineos60.0%+ 20.0%35370.1%+ 184.6%364542Chevrolet 50.0%+ 66.7%38120.0%+ 140.0%394343Geely50.0%new4680.0%new433844Smart50.0%+ 400.0%4880.0%+ 700.0%444145Hongqi30.0%– 78.6%4170.0%– 66.7%463646NIO30.0%– 81.3%4470.0%– 63.2%473747Ferrari20.0%+ 0.0%3970.0%+ 0.0%454248Lotus20.0%+ 100.0%4360.0%+ 100.0%484949Iveco20.0%n/a4930.0%n/a495750Bentley20.0%n/a–20.0%n/a506351Man20.0%+ 100.0%–20.0%+ 100.0%515152Morgan20.0%n/a–20.0%n/a526153Aston Martin10.0%n/a–10.0%n/a535454Cadillac10.0%n/a–10.0%n/a545855SsangYong10.0%+ 0.0%–10.0%– 75.0%555656Paragan10.0%new–10.0%new56 ––Others30.0%– 93.5%–30.0%– 98.4%––
Sweden February 2025 – models:
PosModelFeb-25%/24Jan2025%/24PosFY241Volvo XC601,3887.1%+ 25.0%22,8017.1%+ 39.8%122Volvo XC407253.7%+ 3.9%71,1092.8%– 20.7%433VW ID.75382.7%+ 4038.5%31,1933.0%+ 3039.5%3164Kia EV34992.5%new247281.9%new81455Tesla Model Y4782.4%– 52.1%137752.0%– 50.8%716Skoda Kodiaq4282.2%+ 219.4%196971.8%+ 196.6%9277Volvo S/V603781.9%– 53.8%285751.5%– 54.5%1758VW ID.43731.9%+ 69.5%67922.0%+ 55.9%679VW Tiguan3591.8%+ 139.3%146491.7%+ 49.5%101210VW Golf3321.7%+ 46.3%58492.2%+ 75.1%52311Skoda Enyaq3291.7%+ 78.8%235631.4%+ 86.4%181112Volvo S/V903221.6%+ 75.0%205771.5%+ 48.7%162613Toyota RAV43201.6%– 31.6%126301.6%– 39.1%12614Kia Ceed3191.6%– 29.0%116331.6%– 15.3%11815VW T-Roc3151.6%+ 82.1%305031.3%+ 35.6%211816VW Passat3061.6%+ 30.2%165821.5%– 5.7%151517VW ID.32981.5%+ 263.4%324781.2%+ 115.3%243818Volvo EX302741.4%– 23.9%105901.5%– 6.9%14419Peugeot 20082681.4%+ 63.4%264731.2%+ 121.0%253420BMW 5-Series2671.4%+ 122.5%96031.5%+ 189.9%134521Volvo C402481.3%+ 2.5%224861.2%– 17.1%231422Polestar 42361.2%new353991.0%new306923Toyota Corolla2241.1%– 7.1%174991.3%+ 17.1%222424Polestar 22151.1%– 28.3%214571.2%– 14.1%26925Toyota Corolla Cross2141.1%+ 6.5%155041.3%+ 20.6%202126Skoda Octavia2121.1%+ 39.5%373630.9%– 1.1%323227Toyota Yaris2081.1%– 27.5%274111.0%– 16.8%282528Mercedes E Class2001.0%+ 22.0%393480.9%– 2.5%342929Kia Sportage1981.0%– 17.5%254051.0%– 18.5%291030Volvo XC901800.9%– 16.7%313680.9%– 8.7%313131BMW X11780.9%+ 21.1%522720.7%+ 26.5%434632Toyota Yaris Cross1740.9%– 23.7%184471.1%– 1.8%271733Audi A31730.9%– 8.5%363280.8%+ 2.2%362834Toyota C-HR1660.8%+ 13.7%462790.7%– 11.7%404035Audi Q4 E-Tron1620.8%– 25.7%422940.7%– 41.7%383036Renault Clio1490.8%+ 210.4%1401690.4%+ 92.0%617437Cupra Tavascan1470.7%new343200.8%new3713638Peugeot 50081370.7%– 35.4%293330.8%– 13.7%352039Audi Q6 e-Tron1350.7%new382850.7%new398340Cupra Terramar1330.7%new482370.6%new4820741Tesla Model 3 1320.7%+ 127.6%502290.6%+ 14.5%491342Dacia Duster1320.7%+ 288.2%632060.5%+ 148.2%509343Peugeot 30081310.7%– 48.6%412770.7%– 36.6%413744BMW X31310.7%+ 12.9%442510.6%+ 10.1%445845Nissan Qashqai1250.6%+ 28.9%781820.5%– 2.2%544846Audi Q31220.6%+ 60.5%452400.6%+ 79.1%475347Opel Mokka1220.6%+ 125.9%661950.5%+ 8.3%527248BMW i41210.6%– 21.9%572050.5%– 30.5%515549Ford Kuga1210.6%+ 89.1%991620.4%– 31.6%645750Kia Niro1180.6%– 39.5%432450.6%– 33.6%452251Mercedes EQE1180.6%+ 15.7%761790.5%– 21.1%564252Audi Q51120.6%+ 6.7%1421310.3%– 20.6%787953VW Taigo1110.6%– 27.5%861610.4%– 47.7%666854Renault Scenic1080.6%n/a1251360.3%n/a7510655Mercedes CLA1060.5%+ 165.0%1061430.4%+ 68.2%727756Kia EV61040.5%– 43.5%701710.4%– 38.7%593357BMW 3-Series1040.5%– 20.6%741690.4%– 28.4%624758Dacia Sandero1010.5%– 17.9%691690.4%– 21.0%633659Audi A6990.5%– 14.7%332760.7%– 13.2%423560Kia EV9980.5%– 34.2%402450.6%– 20.7%464161Hyundai Tucson960.5%+ 50.0%641700.4%+ 51.8%6010162Mercedes GLC960.5%– 19.3%711620.4%– 33.3%654463Mercedes GLE920.5%+ 29.6%541810.5%+ 27.5%556764Volvo EX90910.5%new921350.3%new7617465Peugeot 408910.5%+ 89.6%961340.3%+ 69.6%777666Ford Focus890.5%– 58.4%1281150.3%– 70.4%865467Skoda Fabia880.4%– 12.0%1181190.3%– 27.4%825968Mercedes EQA860.4%+ 59.3%671550.4%+ 8.4%697069Seat Leon830.4%– 1.2%1431020.3%– 27.1%958070BMW i5820.4%+ 192.9%651560.4%+ 147.6%688271Nissan Ariya820.4%+ 121.6%791390.4%+ 90.4%7311472Mercedes C Class820.4%– 18.0%1171130.3%– 37.6%884373Lexus NX800.4%– 54.0%511750.4%– 41.5%586374Mercedes EQB790.4%+ 75.6%471860.5%+ 27.4%534975Toyota bZ4X780.4%– 4.9%591590.4%+ 16.1%679976VW Multivan760.4%+ 153.3%891230.3%+ 105.0%8012777Peugeot 208750.4%+ 476.9%138970.2%+ 212.9%9814778Porsche Macan740.4%+ 196.0%491760.4%+ 183.9%578179VW ID.Buzz700.4%+ 112.1%1131030.3%+ 63.5%9412280Cupra Leon690.4%+ 21.1%681380.4%+ 46.8%747581Skoda Kamiq690.4%– 62.3%1001090.3%– 65.1%896282BMW 1-Series690.4%+ 53.3%1021090.3%+ 38.0%909583Skoda Superb670.3%+ 378.6%601440.4%+ 234.9%716084BMW X5650.3%– 4.4%551530.4%– 19.9%706185Seat Arona630.3%– 30.8%911070.3%– 16.4%925086Fiat Ducato630.3%+ 61.5%110970.2%+ 73.2%995187Kia Sorento600.3%– 33.3%971020.3%– 35.4%967888Porsche Cayenne560.3%– 63.2%721220.3%– 52.9%815689VW T-Cross 560.3%– 73.2%821080.3%– 61.8%916490Skoda Elroq550.3%new –550.1%new130 –91Hyundai Kona530.3%+ 47.2%135750.2%– 14.8%11310792Cupra Born500.3%– 59.3%751150.3%– 35.0%873993Audi Q8470.2%+ 62.1%771070.3%+ 25.9%9311294BMW iX470.2%+ 4.4%132700.2%– 13.6%11811095Hyundai i10470.2%+ 14.6%141670.2%– 10.7%12212496Nissan Juke460.2%+ 0.0%90910.2%+ 44.4%10111597Nissan X-Trail450.2%+ 15.4%101850.2%+ 14.9%10613898Polestar 3450.2%new103850.2%new10710499Kia Picanto430.2%– 14.0%621170.3%+ 7.3%8485100Mini Hatch430.2%+ 65.4%80990.3%+ 59.7%97102101Audi A6 e-tron430.2%new93870.2%new104 –102Kia Stonic430.2%– 21.8%123710.2%– 38.3%11687103Zeekr X420.2%+ 4100.0%120730.2%+ 7200.0%11598104MG HS400.2%n/a94830.2%– 68.0%109143105Ford Tourneo Custom400.2%+ 700.0%108750.2%+ 435.7%114148106VW Touran390.2%+ 3800.0%611160.3%+ 5700.0%85189107Cupra Formentor390.2%– 40.9%81950.2%+ 10.5%10052108Renault Captur390.2%– 27.8%124670.2%– 25.6%12388109Mercedes GLA380.2%– 20.8%95810.2%– 6.9%11194110Mazda CX-80370.2%new88860.2%new105180111VW Tayron370.2%new205420.1%new145 –112Hyundai Inster370.2%new –370.1%new150 –113Audi A5360.2%+ 89.5%581190.3%+ 340.7%83131114Ford Puma 350.2%– 52.1%531270.3%+ 16.5%79126115Porsche 911350.2%+ 34.6%98770.2%+ 28.3%112111116Skoda Karoq350.2%– 5.4%111690.2%+ 30.2%120113117BMW 2-Series350.2%– 30.0%112680.2%– 23.6%121100118Mercedes V Class340.2%– 33.3%147520.1%– 41.6%131130119Lexus LBX330.2%new85840.2%new108149120BYD Seal U330.2%new87820.2%new110198121Mazda CX-60330.2%– 68.6%104710.2%– 62.4%11773122Suzuki Swift330.2%– 52.9%168440.1%– 48.8%140120123Range Rover 320.2%– 5.9%109660.2%– 12.0%125173124Xpeng G6320.2%new126600.2%new128172125Mini Countryman290.1%+ 3.6%105670.2%+ 24.1%124135126Audi Q7290.1%+ 383.3%150460.1%+ 130.0%138165127Mercedes Sprinter280.1%– 17.6%145470.1%+ 6.8%13690128Cupra Ateca270.1%+ 8.0%115590.2%– 13.2%129118129Honda HR-V270.1%+ 170.0%156420.1%+ 55.6%146175130Toyota Aygo X260.1%+ 85.7%107620.2%+ 113.8%127125131Ford Transit250.1%– 28.6%131480.1%– 56.4%134134132Xpeng G9250.1%– 24.2%133480.1%– 30.4%135117133Mazda CX-30240.1%+ 0.0%129500.1%+ 6.4%132142134VW Touareg240.1%– 36.8%144430.1%– 46.9%143139135VW Caravelle240.1%+ 300.0%219270.1%+ 58.8%171144136Hyundai Santa Fe230.1%+ 187.5%73890.2%+ 535.7%103178137Mercedes G Class230.1%+ 91.7%139440.1%+ 41.9%141171138Fiat 600230.1%new148410.1%new147211139BMW IX2230.1%new157380.1%new148141140Mercedes GLB230.1%– 14.8%198280.1%– 56.3%167109141Hyundai Ioniq 5220.1%– 31.3%153370.1%– 57.5%151137142Suzuki Vitara220.1%– 71.4%158360.1%– 69.2%153119143MG 4210.1%– 72.0%136430.1%– 60.6%14465144Toyota Proace Verso210.1%– 55.3%172310.1%– 52.3%159166145Honda CR-V200.1%+ 81.8%155350.1%+ 2.9%155196146BMW IX1200.1%new188270.1%new172274147Citroen C3200.1%– 44.4%245210.1%– 67.2%179156148Renault Austral190.1%– 75.6%165310.1%– 75.2%16096149MG 5190.1%+ 137.5%167300.1%+ 7.1%162169150Citroen C4180.1%– 77.2%83700.2%– 44.9%11992151Audi A1180.1%+ 38.5%116500.1%+ 138.1%133132152Ford Explorer180.1%n/a122470.1%+ 4600.0%137185153VW Caddy180.1%– 59.1%159320.1%– 52.2%158123154Alfa Romeo Junior180.1%new231210.1%new180 –155Mercedes EQS160.1%+ 700.0%151330.1%+ 560.0%156209156Audi Q2160.1%– 70.4%164280.1%– 82.2%16884157Opel Corsa160.1%n/a166280.1%+ 460.0%169181158Mitsubishi Colt160.1%– 5.9%176260.1%+ 52.9%173200159Dacia Jogger150.1%– 11.8%84660.2%+ 106.3%126133160Lynk & Co 01150.1%– 81.3%121450.1%– 64.0%13971161Mercedes GLS150.1%– 55.9%154300.1%– 52.4%163154162Renault Trafic150.1%+ 36.4%162280.1%+ 16.7%170183163Lexus UX 150.1%n/a169260.1%n/a174188164Honda Jazz150.1%+ 7.1%184230.1%+ 4.5%175195165Audi A4150.1%– 77.3%189210.1%– 84.9%18186166Mercedes AMG GT150.1%+ 114.3%196210.1%+ 133.3%182194167Mercedes CLE150.1%+ 150.0%210190.0%+ 18.8%186153168Mercedes Vito140.1%+ 16.7%137360.1%+ 16.1%154177169BYD Dolphin130.1%– 27.8%130380.1%+ 31.0%149160170Zeekr 001130.1%– 75.0%149310.1%– 40.4%161105171Mitsubishi ASX130.1%– 62.9%177220.1%– 71.1%176186172Suzuki S-Cross130.1%– 84.1%183210.1%– 78.4%183116173Lynk & Co 02130.1%new185210.1%new184 –174BYD Seal130.1%– 7.1%191190.0%– 9.5%187213175Opel Grandland X120.1%– 81.3%114440.1%– 62.1%14291176Mini Aceman120.1%new152290.1%new165273177Porsche Panamera120.1%+ 0.0%173220.1%– 8.3%177182178Hyundai i20120.1%+ 9.1%181200.1%– 39.4%185167179VW Crafter120.1%+ 0.0%199170.0%– 52.8%190159180Lexus ES/IS/LS/RC110.1%– 67.6%146290.1%– 60.3%166161181Mazda2110.1%– 47.6%190170.0%– 50.0%191151182Ford Transit Custom110.1%+ 450.0%197170.0%+ 750.0%192234183Ford Capri110.1%new240130.0%new203236184Mazda MX-30100.1%– 44.4%134330.1%– 10.8%157197185Porsche Taycan100.1%– 16.7%179190.0%– 36.7%188155186Hyundai Bayon100.1%– 72.2%201150.0%– 68.1%197158187Opel Astra100.1%+ 66.7%214140.0%+ 55.6%199150188Jeep Avenger80.0%new161220.1%new178241189Mercedes Citan80.0%– 42.9%182160.0%– 50.0%194190190Suzuki Swace80.0%– 27.3%186150.0%– 37.5%198191191Ford Tourneo Connect80.0%+ 166.7%195140.0%+ 100.0%200217192Subaru Solterra70.0%+ 40.0%180160.0%+ 100.0%195187193Suzuki Across70.0%+ 133.3%217110.0%+ 266.7%207238194BMW i770.0%+ 600.0%23890.0%+ 125.0%211257195Honda E:NY170.0%n/a –70.0%+ 600.0%222152196Ineos Grenadier60.0%+ 20.0%119370.1%+ 184.6%152227197Land Rover Defender60.0%– 50.0%174160.0%– 27.3%196204198MG ZS60.0%– 62.5%192120.0%– 45.5%20466199Nissan Primastar60.0%+ 20.0%213100.0%+ 0.0%209243200DS 760.0%+ 50.0%22590.0%+ 50.0%212281201Alfa Romeo Tonale60.0%+ 200.0%25370.0%+ 75.0%223245202Lamborghini Urus60.0%new26670.0%new224283203Mazda350.0%– 16.7%187120.0%– 25.0%205214204Peugeot Expert50.0%+ 150.0%194110.0%+ 57.1%208271205Toyota Land Cruiser50.0%n/a204100.0%+ 900.0%210212206Ford Mustang Mach-E50.0%– 58.3%20990.0%– 62.5%213164207Honda ZR-V50.0%– 16.7%22480.0%– 20.0%217219208Mercedes CL class50.0%+ 25.0%22180.0%– 33.3%218221209Renault Master40.0%– 78.9%56900.2%+ 52.5%102146210BMW X740.0%– 55.6%160180.0%– 30.8%189179211VW ID.540.0%– 92.5%163170.0%– 72.6%193140212Renault Megane 40.0%– 77.8%175140.0%– 44.0%201176213Hyundai i3040.0%– 85.7%20290.0%– 76.3%214199214Honda Civic40.0%– 60.0%20090.0%– 60.9%215203215Citroen C5 Aircross40.0%– 93.0%20680.0%– 91.1%219129216Mercedes A Class40.0%– 75.0%20880.0%– 75.8%220168217Xpeng P740.0%– 33.3%27050.0%– 16.7%232278218Jaguar F-Pace40.0%+ 300.0%25250.0%+ 25.0%233253219Renault Kangoo40.0%– 75.0% –40.0%– 80.0%240206220Renault 530.0%new170140.0%new202 –221Hongqi E-HS930.0%– 78.6%21170.0%– 66.7%225201222Lexus UX EV30.0%– 72.7%21860.0%– 78.6%226320223Ford Courier30.0%– 62.5%22960.0%– 25.0%227232224Audi Q8 e-Tron30.0%– 96.5%23250.0%– 97.2%23489225Smart #130.0%new24350.0%new235244226Renault Espace30.0%– 50.0% –30.0%– 76.9%247226227Peugeot Boxer30.0%+ 50.0% –30.0%+ 50.0%248255228Polestar YSM20.0%new127300.1%new164 –229Porsche 71820.0%– 92.3%171120.0%– 72.7%206163230Tesla Model X20.0%+ 100.0%19380.0%+ 14.3%221228231Lexus RX20.0%– 95.0%20760.0%– 90.6%228170232BYD Tang20.0%+ 0.0%21260.0%– 14.3%229249233Renault Rafale20.0%new21660.0%new230229234NIO EL620.0%+ 0.0%22850.0%+ 66.7%236291235Jaguar i-Pace20.0%+ 100.0%23050.0%+ 400.0%237308236Lotus Eletre20.0%+ 100.0%22650.0%+ 66.7%238259237Chevrolet Corvette20.0%n/a22750.0%+ 400.0%239251238Peugeot 30820.0%– 95.2%23340.0%– 94.9%241103239Fiat 50020.0%– 94.3%23640.0%– 90.0%242162240Range Rover Evoque20.0%– 77.8%23740.0%– 69.2%243250241Citroen Jumper20.0%– 60.0%23940.0%– 42.9%244208242Audi A720.0%+ 0.0%23540.0%– 55.6%245239243BMW X220.0%n/a26030.0%n/a249284244Ford Mustang20.0%n/a26330.0%n/a250231245Smart #320.0%new26830.0%new251261246BMW 4-Series20.0%– 83.3% –20.0%– 88.2%256202247BMW 7-Series20.0%– 50.0% –20.0%– 60.0%257269248Alfa Romeo Giulia20.0%+ 100.0% –20.0%+ 100.0%258310249Ford Bronco20.0%+ 100.0% –20.0%+ 100.0%259311250Jaguar E-Pace20.0%+ 100.0% –20.0%– 33.3%260330251Land Rover Discovery Sport20.0%+ 100.0% –20.0%+ 100.0%261275252Man Chassi Husbil20.0%+ 100.0% –20.0%+ 100.0%262260253Opel Combo20.0%+ 100.0% –20.0%+ 100.0%263329254Morgan20.0%n/a –20.0%n/a264307255Subaru Outback10.0%– 99.6%11,6574.2%+ 210.3%219256Subaru Forester10.0%– 97.6%45591.4%+ 710.1%1997257Tesla Model S10.0%– 50.0%20360.0%– 14.3%231230258Lamborghini Huracan10.0%new24130.0%new252279259Hyundai Ioniq 610.0%– 88.9%25120.0%– 84.6%265215260BMW XM10.0%– 75.0%24920.0%– 80.0%266247261Mitsubishi Space Star10.0%– 75.0%25020.0%– 80.0%267254262Ferrari 29610.0%new26120.0%new268270263Iveco Daily10.0%n/a26420.0%n/a269282264Jeep Wrangler10.0%n/a26520.0%n/a270322265Nissan Townstar10.0%n/a25620.0%+ 100.0%271327266Nissan Leaf10.0%– 99.1% –10.0%– 99.6%275128267BYD Atto 310.0%– 95.8% –10.0%– 98.4%276157268Renault Arkana10.0%– 93.3% –10.0%– 95.7%277218269BMW X610.0%– 85.7% –10.0%– 91.7%278225270Range Rover Velar10.0%– 80.0% –10.0%– 85.7%279258271DS 410.0%– 66.7% –10.0%– 75.0%280294272BMW Z410.0%– 50.0% –10.0%– 50.0%281268273BMW 8-Series10.0%+ 0.0% –10.0%– 50.0%282297274Mazda MX510.0%+ 0.0% –10.0%– 50.0%283223275Aston Martin DBS10.0%new –10.0%new284318276Bentley Continental10.0%n/a –10.0%n/a285335277Ferrari SF9010.0%new –10.0%new286293278MG 310.0%new –10.0%new287205279NIO EL810.0%new –10.0%new288319280Ssangyong Torres10.0%new –10.0%new289298281Citroen Spacetourer10.0%n/a –10.0%n/a290 –282Bentley Flying Spur10.0%n/a –10.0%n/a291 –283Subaru Crosstrek00.0%– 100.0%83570.9%+ 643.8%33108
Source: Mobility Sweden


More Stories
How Mechanical Design Influences the Feel of a Vehicle
You know that feeling. You slide into the driver’s seat. You press the start button. The vehicle comes alive. It...
Competition Time. Chance to win a Smallest Cog goodies bundle.
The Smallest Cog Unveils Exciting New Merchandise Range Inspired by Richard Hammond’s iconic restoration workshop, The Smallest Cog’s exclusive new...
Florida Tolls Could Vanish for Residents as Tourists Pick Up the Tab
Florida drivers may eventually cruise the Turnpike without paying a cent at the toll gantries if a new idea from...
Extending Vehicle Lifespan Through Proven Engine Technology
We all want our cars to last. A vehicle is a major investment. It gets us to work. It takes...
China retail November 2025: Fang Cheng Bao, Lynk & Co hit all-time highs, market off -16.8% on high year ago basis
This content is for members only. Visit the site and log in/register to read.
China imports November 2025: Market down -20%, BMW 7 Series (+88.9%) and 2 Series (+53.8%) shoot up
This content is for members only. Visit the site and log in/register to read.