
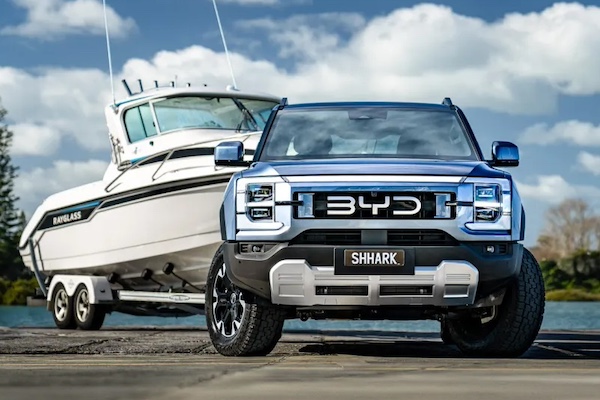
Australia February 2025: BYD Shark 6 lands with a bang
The BYD Shark 6 sold over 2,000 units across two months.
The Australian new vehicle market endures its 7th decline in the past 8 months in February at -7.9% to 96,710 units. This is however the 2nd highest February volume in history below only last year. The year-to-date tally after 2 months is down -5.4% to 184,335. Petrol sales drop -13% to 40,496, diesel is down -16.1% to 26,863, but the big news are next: hybrids soar 34.7% to 15,348, BEVs plunge -43.8% to 5,684 mainly due to Tesla off -71.9% and PHEVs surge 346.1% to 4,871 with the help of BYD as we’ll see further down. SUV sales continue to grow at +1.1% to 58,434 and 60.4% share vs. 55% last year, but light commercials drop -9.9% to 21,337 and 22.1% share vs. 22.6% a year ago and passenger cars tumble down -31.2% to 13,491 units and 13.9% share vs. 18.7% in February 2024. Heavy commercials are off -11% to 3,448 and 3.6% share vs. 3.7%.
All regions are in negative this month. Tasmania (1,502) is the hardest hit at -17.7%, followed by Australian Capital Territory (1,528) at -12.7% and Victoria (25,231) at -11.2%. Queensland (20,591) at -8.3% and Western Australia (10,372) at -8.4% also fall faster than the market. Doing better are New South Wales (30.338) at -5%, South Australia (6,283) at -2.6% and Northern Territory (865) at -0.7%. Private sales sink -12.1% to 48,958, business fleets are down -3.9% to 35,662, rentals off -16.3% to 4,273 and government fleets down -17.4% to 2,652. This excludes Tesla, Polestar and heavy commercials. Finally in terms of country of origin, Japan is down -2.8% to 31,560, Thailand down -21.1% to 18,271, China down -4.5% to 17,127, South Korea off -1.2% to 12,272 and Germany up 4.6% to 4,165.
Over in the brands ranking, Toyota (-2.8%) is down but less so than the market and holds 19.5% share. Mazda (+19.7%) surges ahead to 9.1% share, repeating at #2. Kia (+9.2%) is up one spot on January to #3 for the first time since April 2023. Ford (-12.9%) is relegated to 4th place as a result. Mitsubishi (-4.6%) and Hyundai (+5.1%) cam on their January ranking at #5 and #6 respectively. GWM (+8.5%) is up to a record 7th place, overtaking MG (-16.4%) to become Australia’s favourite Chinese brand. Nissan (-46.2%) collapses on particularly high year-ago volumes and Subaru (-7.7%) rounds out the Top 10. Just below, BYD (+111.8%) is up 11 spots to a record 11th place, smashing its previous best of #15 reached last August. Chery (+224%), Mini (+51.7%), Land Rover (+20.6%) and Mercedes (+19.8%) shine further down. Chinese fare Zeekr makes its first appearance in the charts at #39 with 99 sales.
The Toyota RAV4 (+54.9%) manages an 8th consecutive month in pole position but drops to 4.6% share, its lowest since last June. The Ford Ranger (-24.5%) and Toyota Hilux (-17.9%) are both in a bad way and complete the podium. In fact the Top 5 is unchanged on last month, with the Toyota Prado (+167.5%) and Mitsubishi Outlander (+8%) in tow. The Prado now benefits fully from the new generation of the model. The bombshell of the month is the arrival directly into 6th place of the BYD Shark 6 PHEV pickup truck with over 2,000 sales. Caveat to this is this includes 450 units sold in January that weren’t reported then. Even when removing these the Shark 6 ranks #12. Elsewhere, the Hyundai Kona (+84.5%) sports a second ever Top 10 finish at #10, a ranking it also reached last October.
Previous month: Australia January 2025: Toyota RAV4 secures 7th win in a row in negative market
One year ago: Australia February 2024: Another record result, Nissan at highest in 11 years
Full February 2025 Top 51 All brands and Top 40 models below.
Australia February 2025 – brands:
PosBrandFeb-25%/24Jan2025%/24PosFY241Toyota 18,83219.5%– 2.8%137,25620.2%– 0.1%112Mazda 8,7979.1%+ 19.7%217,1199.3%+ 10.3%233Kia 6,7076.9%+ 9.2%412,4276.7%+ 4.9%444Ford 6,3376.6%– 12.9%313,1677.1%– 5.3%325Mitsubishi6,1196.3%– 4.6%511,8006.4%– 4.2%556Hyundai 5,9956.2%+ 5.1%611,4736.2%– 3.3%667GWM3,7533.9%+ 8.5%87,1863.9%+ 9.2%8108MG3,7393.9%– 16.4%77,4794.1%– 11.8%779Nissan 3,5593.7%– 46.2%96,5943.6%– 29.2%9910Subaru 3,5113.6%– 7.7%106,4353.5%– 6.3%101111BYD3,2813.4%+ 111.8%223,9562.1%+ 38.4%131712Isuzu Ute2,7352.8%– 41.7%115,6073.0%– 33.6%11813Volkswagen2,1842.3%– 31.1%124,4982.4%– 23.6%121314Chery2,0382.1%+ 224.0%133,8752.1%+ 185.3%142215Mercedes1,9702.0%+ 19.8%143,7262.0%+ 23.8%151516BMW1,7711.8%+ 3.6%163,1721.7%– 4.2%161417Tesla1,5921.6%– 71.9%212,3311.3%– 65.6%201218Suzuki 1,3281.4%– 23.8%152,7591.5%– 15.6%171619Honda 1,2181.3%– 28.7%172,4781.3%– 18.9%182020LDV1,1531.2%– 16.9%182,3461.3%– 26.7%191821Audi1,1441.2%– 6.2%192,1581.2%– 3.1%211922Lexus1,0541.1%+ 4.5%202,0231.1%+ 7.5%222123Land Rover6270.6%+ 20.6%261,0320.6%– 1.0%242424Volvo6190.6%+ 2.5%231,1790.6%– 5.5%232325Porsche5100.5%– 28.9%249780.5%– 19.4%252526Mini4340.4%+ 51.7%277830.4%+ 55.7%263027KGM Ssangyong4240.4%+ 0.5%307360.4%– 17.3%282728Renault3560.4%– 30.7%257750.4%– 16.2%272629Chevrolet3250.3%+ 13.2%296470.4%+ 12.9%292930Skoda3120.3%– 41.5%286410.3%– 37.0%302831Ram2560.3%– 21.2%315020.3%– 24.5%313132Jeep 2080.2%– 5.0%353530.2%– 28.7%343233JAC2040.2%new324080.2%new32 –34Cupra1850.2%– 15.5%333720.2%+ 1.6%333335Fiat1500.2%+ 44.2%343330.2%+ 37.6%353436Polestar1250.1%+ 10.6%382070.1%– 21.6%373637Genesis1100.1%+ 46.7%372150.1%+ 4.9%363738Peugeot990.1%– 51.9%362060.1%– 41.6%383539Zeekr990.1%new –990.1%new39 –40Jaguar460.0%+ 7.0%39860.0%– 18.9%403841Alfa Romeo410.0%– 35.9%40750.0%– 52.5%413942Lamborghini290.0%+ 61.1%41540.0%+ 100.0%424143Leapmotor290.0%new43510.0%new434844Aston Martin250.0%+ 177.8%44320.0%+ 88.2%454545Ferrari220.0%+ 69.2%48250.0%– 7.4%464246Maserati190.0%– 44.1%42430.0%– 25.9%444047Bentley150.0%+ 36.4%45200.0%– 33.3%474348Rolls-Royce100.0%+ 150.0%47150.0%+ 114.3%484949McLaren90.0%+ 350.0%49110.0%+ 120.0%504750Lotus60.0%– 64.7%46110.0%– 57.7%494451Citroen40.0%– 69.2%5050.0%– 75.0%5146
Australia February 2025 – models:
PosModelFeb-25%/23Jan2025%/24PosFY241Toyota RAV44,4054.6%+ 54.9%19,4815.1%+ 87.6%122Ford Ranger4,0404.2%– 24.5%28,2944.5%– 17.9%213Toyota Hilux3,6163.7%– 17.9%36,9183.8%– 18.6%334Toyota Prado2,7232.8%+ 167.5%45,5703.0%+ 101.5%4375Mitsubishi Outlander2,3852.5%+ 8.0%54,4752.4%+ 4.4%556BYD Shark 62,0262.1%new –2,0261.1%new27 –7Isuzu D-Max2,0222.1%– 31.2%64,1082.2%– 25.1%648Mazda CX-51,9322.0%+ 17.7%73,8042.1%+ 13.1%789Kia Sportage1,9272.0%+ 42.7%83,7532.0%+ 24.5%81010Hyundai Kona1,8892.0%+ 84.5%143,1901.7%+ 33.4%91711MG ZS1,7201.8%– 27.0%172,9321.6%– 30.9%12912Toyota Corolla1,5611.6%– 37.4%113,1441.7%– 28.3%10713Mazda CX-31,5091.6%+ 22.5%103,1171.7%+ 13.1%111314Nissan X-Trail1,4941.5%– 40.4%202,6161.4%– 23.9%161615Hyundai Tucson1,4721.5%– 12.7%122,9051.6%– 9.0%131216Mitsubishi Triton1,4201.5%– 7.6%162,6431.4%– 9.5%151417Mazda BT-501,4121.5%+ 1.7%182,5911.4%+ 1.4%182218GWM Haval Jolion1,3061.4%+ 8.7%152,5921.4%+ 14.8%172419Toyota Hiace1,2101.3%– 6.6%252,1601.2%+ 4.8%232320Ford Everest1,2071.2%+ 14.0%92,8861.6%+ 29.1%14621Mazda31,1731.2%+ 55.8%222,1991.2%+ 22.6%213222Subaru Forester1,1641.2%– 3.5%242,1251.2%– 6.3%242523Mitsubishi ASX1,1341.2%+ 7.0%132,4381.3%+ 21.6%192924Subaru Crosstrek1,1191.2%– 10.8%272,0311.1%– 1.6%263125GWM Haval H61,0941.1%+ 61.1%n/a1,8211.0%+ 33.9%304126Mazda CX-301,0831.1%+ 14.7%212,1681.2%+ 9.3%222727Toyota Corolla Cross1,0691.1%+ 24.3%261,9911.1%+ 21.8%284228Chery Tiggo 4 Pro1,0681.1%new232,0861.1%#DIV/0!2511629MG 31,0661.1%+ 5.0%192,2171.2%+ 16.0%202830Toyota Yaris Cross9751.0%+ 42.5%291,8241.0%+ 27.9%294631Tesla Model Y9241.0%– 55.4%n/a1,3890.8%– 43.4%401132Kia Sorento9050.9%– 4.7%n/a1,5060.8%– 5.7%333833Kia Carnival8970.9%+ 93.3%n/a1,4860.8%+ 33.3%353434Kia Seltos8940.9%+ 9.2%n/a1,4330.8%– 4.0%374935Hyundai i308720.9%– 36.4%281,7210.9%– 44.5%312636BYD Sealion 68600.9%newn/a1,2930.7%newn/a5637Nissan Navara7740.8%– 48.4%n/a1,5240.8%– 22.9%323538Subaru Outback7580.8%– 13.1%n/a1,4150.8%– 13.0%393339Mitsubishi Eclipse Cross7380.8%– 14.4%n/a1,3630.7%– 21.8%n/a4040Toyota Land Cruiser PU/CC7310.8%– 34.4%n/a1,4610.8%– 33.4%3630
Source: VFACTS

More Stories
Uruguay November 2025: Chevrolet repeats at #1 with 15.2% share
Chevrolet holds 15.2% of the Uruguayan market in November. New light vehicle sales in Uruguay are off -1.1% year-on-year in...
How Mechanical Design Influences the Feel of a Vehicle
You know that feeling. You slide into the driver’s seat. You press the start button. The vehicle comes alive. It...
Competition Time. Chance to win a Smallest Cog goodies bundle.
The Smallest Cog Unveils Exciting New Merchandise Range Inspired by Richard Hammond’s iconic restoration workshop, The Smallest Cog’s exclusive new...
Florida Tolls Could Vanish for Residents as Tourists Pick Up the Tab
Florida drivers may eventually cruise the Turnpike without paying a cent at the toll gantries if a new idea from...
Extending Vehicle Lifespan Through Proven Engine Technology
We all want our cars to last. A vehicle is a major investment. It gets us to work. It takes...
China retail November 2025: Fang Cheng Bao, Lynk & Co hit all-time highs, market off -16.8% on high year ago basis
This content is for members only. Visit the site and log in/register to read.