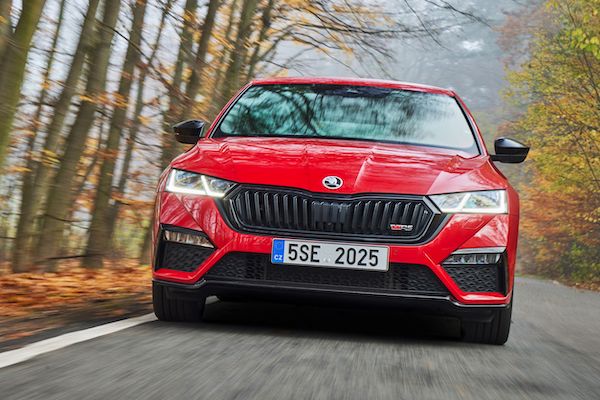
Hungary September 2024: Skoda and Octavia take the lead
The Skoda Octavia is the best-selling vehicle in Hungary in September.
The Hungarian new passenger car market edges down -0.6% year-on-year in September to 9,068 units, leading to a year-to-date volume up 7.3% to 89,044. When adding Light Commercial vehicles, the market is up 9.3% to 107,445 over the first 9 months of 2024. In September and in the passenger car brands ranking, Skoda (+15.9%) brilliantly takes the lead with 12.1% share vs. 8.7% year-to-date, overtaking Suzuki (-33.6%) and Toyota (-2.8%). Ford (+133.1%) surges to #4 with 8.6% of the market vs. 5.3% so far this year. BMW (+34.6%), Mercedes (+33.1%) and Kia (+28.6%) also impress.
Over in the models ranking, the Skoda Octavia (+36%) takes the lead, displacing the Suzuki S-Cross (-43.7%) and Vitara (-45.8%) both in freefall. The Ford Kuga (+304.5%) and Renault Clio (+614.3%) both surge ahead to #4 and #5 respectively, vs. #15 and #37 year-to-date. The Ford Ranger (+16.7%) is also in solid shape at #6 as is in fact the rest of the Top 12. The Ford Transit Custom (+213.8%), Suzuki Swift (+150%), Ford Tourneo Custom (+140.5%) and Kia Sportage (+114.1%) are the most dynamic.
Previous month: Hungary August 2024: Ford (+54.2%), Mercedes (+42%) impress
One year ago: Hungary September 2023: Suzuki resumes domination, places S-Cross and Vitara on top
Full September 2024 Top 10 brands and Top 50 models and 9 months 2024 Top 130 models below.
Hungary September 2024 – brands:
PosBrandSep-24%/23Aug9m 2024%/23PosFY231Skoda1,09612.1%+ 15.9%37,7878.7%– 8.3%332Suzuki1,07311.8%– 33.6%111,68113.1%+ 49.6%123Toyota1,06311.7%– 2.8%210,73412.1%– 2.5%214Ford7818.6%+ 133.1%54,7365.3%– 5.0%665Volkswagen6557.2%– 4.7%76,6917.5%– 3.4%446BMW5295.8%+ 34.6%64,2784.8%+ 8.6%777Kia5265.8%+ 28.6%84,8285.4%– 6.8%558Mercedes4104.5%+ 33.1%43,9414.4%+ 11.3%889Hyundai2352.6%– 16.7%93,8384.3%+ 38.5%91210Nissan2322.6%– 21.1%103,7114.2%+ 104.1%1014
Hungary September 2024 – models:
PosModelSep-24/239m 2024%/23PosFY231Skoda Octavia559+ 36.0%4,4144.1%+ 0.4%322Suzuki S-Cross495– 43.7%4,6944.4%+ 19.0%213Suzuki Vitara344– 45.8%5,3465.0%+ 82.6%134Ford Kuga271+ 304.5%1,4231.3%+ 95.2%15315Renault Clio250+ 614.3%7220.7%+ 111.7%37686Ford Ranger237+ 16.7%1,6191.5%+ 35.0%12117Kia Sportage212+ 114.1%1,4121.3%+ 20.5%16178Suzuki Swift210+ 150.0%1,2841.2%+ 88.3%17379Kia Ceed207+ 6.7%2,3512.2%– 8.1%4510Ford Transit Custom204+ 213.8%1,9901.9%+ 225.7%82111Ford Tourneo Custom202+ 140.5%1,0120.9%– 42.8%241012Nissan Qashqai193+ 54.4%2,3172.2%+ 121.5%52013Toyota Corolla162– 21.0%2,1992.0%– 12.7%6414Toyota Corolla Cross159+ 23.3%1,1181.0%+ 36.8%212815Toyota Yaris Cross156– 0.6%1,6021.5%– 4.2%13716Ford Transit155+ 72.2%1,0170.9%– 9.4%231517Toyota C-HR151+ 25.8%1,7841.7%+ 15.5%10918Toyota Yaris141+ 43.9%1,2731.2%– 18.7%181219Fiat Ducato136– 23.6%7450.7%– 26.9%362520Skoda Superb128+ 19.6%8190.8%+ 12.0%323321Renault Master119– 8.5%1,5141.4%+ 6.5%141322Toyota RAV4117– 30.8%1,1331.1%– 1.6%201423Dacia Duster115+ 12.7%2,0761.9%+ 13.4%7624VW Golf115– 30.3%1,6381.5%+ 41.6%111625Skoda Kodiaq115+ 6.5%8620.8%– 12.4%292226VW Passat111+ 11.0%9970.9%+ 10.5%252627Skoda Scala107– 3.6%5700.5%– 33.2%532928Toyota Hilux106– 15.2%1,9591.8%+ 28.3%9829VW Tiguan103+ 33.8%8190.8%+ 46.8%314730Tesla Model 398n/a5870.5%+ 142.6%528431Ford Puma90+ 69.8%1,0671.0%+ 33.9%223432Skoda Karoq88– 17.0%4300.4%– 21.8%644933VW T-Roc81+ 24.6%7190.7%– 26.7%392734BMW X581+ 47.3%6050.6%+ 13.1%495235Ssangyong Korando80– 9.1%8340.8%– 32.0%301936Opel Corsa75– 55.1%7180.7%– 33.5%402337BYD Atto 373new3690.3%new73 –38Opel Movano72+ 33.3%7080.7%+ 77.0%415839Tesla Model Y69+ 27.8%9370.9%+ 40.5%264240Citroen Jumper69+ 27.8%5090.5%+ 102.8%57n/a41Renault Captur68+ 65.9%5920.6%+ 123.4%5010042Mercedes GLC66+ 175.0%7830.7%+ 52.0%345743Toyota Aygo X65+ 10.2%6270.6%+ 14.4%465044Skoda Kamiq63+ 46.5%2860.3%– 25.9%916345Volvo EX3062new5480.5%new55 –46BMW X161+ 335.7%3230.3%+ 86.7%7713547BMW X660+ 122.2%3180.3%+ 3.2%8011048Hyundai Tucson55– 59.9%1,2451.2%+ 15.9%192449VW Caddy54+ 92.9%4360.4%– 14.0%625450Opel Combo53+ 6.0%3820.4%+ 21.3%7170
Hungary January-September 2024 – models:
PosModel9m 2024%/23FY231Suzuki Vitara5,3465.0%+ 82.6%32Suzuki S-Cross4,6944.4%+ 19.0%13Skoda Octavia4,4144.1%+ 0.4%24Kia Ceed2,3512.2%– 8.1%55Nissan Qashqai2,3172.2%+ 121.5%206Toyota Corolla2,1992.0%– 12.7%47Dacia Duster2,0761.9%+ 13.4%68Ford Transit Custom1,9901.9%+ 225.7%219Toyota Hilux1,9591.8%+ 28.3%810Toyota C-HR1,7841.7%+ 15.5%911VW Golf1,6381.5%+ 41.6%1612Ford Ranger1,6191.5%+ 35.0%1113Toyota Yaris Cross1,6021.5%– 4.2%714Renault Master1,5141.4%+ 6.5%1315Ford Kuga1,4231.3%+ 95.2%3116Kia Sportage1,4121.3%+ 20.5%1717Suzuki Swift1,2841.2%+ 88.3%3718Toyota Yaris1,2731.2%– 18.7%1219Hyundai Tucson1,2451.2%+ 15.9%2420Toyota RAV41,1331.1%– 1.6%1421Toyota Corolla Cross1,1181.0%+ 36.8%2822Ford Puma1,0671.0%+ 33.9%3423Ford Transit1,0170.9%– 9.4%1524Ford Tourneo Custom1,0120.9%– 42.8%1025VW Passat9970.9%+ 10.5%2626Tesla Model Y9370.9%+ 40.5%4227MG ZS9110.8%+ 20.8%3028Hyundai i309100.8%+ 21.7%4629Skoda Kodiaq8620.8%– 12.4%2230Ssangyong Korando8340.8%– 32.0%1931Skoda Superb8190.8%+ 12.0%3332VW Tiguan8190.8%+ 46.8%4733Opel Crossland7870.7%+ 10.1%4334Mercedes GLC7830.7%+ 52.0%5735Volvo XC607580.7%+ 22.9%4136Fiat Ducato7450.7%– 26.9%2537Renault Clio7220.7%+ 111.7%6838Mercedes Sprinter7210.7%+ 12.7%3839VW T-Roc7190.7%– 26.7%2740Opel Corsa7180.7%– 33.5%2341Opel Movano7080.7%+ 77.0%5842VW Arteon6680.6%+ 7.7%4443Audi A3 6500.6%– 13.4%4044Nissan X-Trail6400.6%+ 115.5%6745Opel Astra6370.6%+ 75.5%6946Toyota Aygo X6270.6%+ 14.4%5047Hyundai i206060.6%+ 59.1%7148BMW X56050.6%+ 13.1%5249Fiat 5006050.6%– 44.6%1850Renault Captur5920.6%+ 123.4%10051Tesla Model 35870.5%+ 142.6%8452Volvo XC405870.5%– 16.1%3553Skoda Scala5700.5%– 33.2%2954Renault Express Van5530.5%– 2.0%5155Volvo EX305480.5%new –56Toyota Proace City 5140.5%+ 14.2%5357Citroen Jumper5090.5%+ 102.8%n/a58Hyundai Kona5070.5%+ 90.6%9259BMW 3 Series4990.5%+ 10.4%5660Peugeot 20084720.4%+ 4.7%6261VW Crafter4670.4%– 28.8%4562VW Caddy4360.4%– 14.0%5463Ford Focus4350.4%– 28.6%4864Skoda Karoq4300.4%– 21.8%4965VW T-Cross4230.4%– 45.8%3966Dacia Sandero4100.4%– 14.0%6067Opel Mokka4090.4%– 46.5%3668Peugeot Boxer3990.4%+ 41.5%8669Lexus NX3910.4%– 12.3%6170Audi Q33830.4%+ 0.3%7371Opel Combo3820.4%+ 21.3%7072Nissan Leaf3760.3%n/an/a73BYD Atto 33690.3%new –74Mercedes V Class3420.3%+ 20.4%9075Toyota Proace3420.3%+ 200.0%14476VW Transporter3410.3%+ 62.4%9477BMW X13230.3%+ 86.7%13578Mercedes C Class3200.3%+ 8.8%8879BMW 5 Series3190.3%+ 9.2%9680BMW X63180.3%+ 3.2%11081Nissan Juke3150.3%– 12.7%7282Toyota Proace City Verso3130.3%+ 40.4%10683Kia Xceed3130.3%+ 6.5%8384Mercedes E Class3120.3%+ 197.1%16085Peugeot 30083030.3%+ 55.4%n/a86Renault Trafic2960.3%+ 21.8%10487Renault Austral2940.3%+ 185.4%15788Renault Trafic Tour2880.3%+ 37.1%12189Iveco Daily2870.3%+ 56.0%11590Suzuki Ignis2870.3%+ 68.8%12791Skoda Kamiq2860.3%– 25.9%6392Mercedes GLE2790.3%+ 21.8%10393Toyota Camry2750.3%– 24.0%6594Isuzu D-Max2720.3%– 29.4%6695Renault Megane2710.3%– 26.0%9896Opel Vivaro Tour2700.3%+ 3.8%9197Skoda Fabia2680.2%– 41.9%5998Seat Leon2680.2%+ 76.3%13899Volvo XC902670.2%+ 24.2%108100BYD Seal2650.2%newn/a101Kia Niro2640.2%– 32.7%64102Mazda CX-52640.2%+ 16.8%122103Cupra Formentor2640.2%+ 13.8%113104BMW 4 Series Coupe/Cabrio2590.2%– 11.0%95105Dacia Jogger2590.2%– 71.9%32106VW Touareg2550.2%+ 57.4%143107Suzuki Jimny2550.2%+ 13.8%82108VW Taigo2540.2%– 53.6%55109Mazda62530.2%+ 19.3%119110Peugeot Partner2520.2%– 4.2%97111VW Amarok2480.2%n/a169112Citroen C3 Van2470.2%+ 69.2%149113BYD Dolphin2440.2%newn/a114Mercedes GLE Coupe2390.2%+ 37.4%120115Ford Transit Courier2360.2%– 34.4%75116Peugeot 3082330.2%– 23.6%74117Mercedes Citan2300.2%– 0.9%112118Mitsubishi Space Star2280.2%+ 105.4%182119Lexus RX2200.2%– 13.0%101120Ford Tourneo Courier2200.2%n/an/a121Audi Q82180.2%– 34.3%78122Renault Arkana2170.2%+ 53.9%150123Audi A42140.2%– 21.9%99124Ssangyong Torres2090.2%new –125Ford Transit Connect Van2070.2%– 23.3%87126Kia Sorento2050.2%– 38.3%77127VW Multivan2050.2%+ 53.0%159128Audi A62020.2%+ 24.7%128129Cupra Leon2000.2%n/an/a130Citroen C32000.2%– 25.1%114
Source: Datahouse

