Australia September 2024: Toyota RAV4 best-seller, Ford Everest breaks records
The Ford Everest is up to #4 in Australia in September.
The Australian new vehicle market seems to have peaked out, with sales off -9.8% year-on-year in September to 99,881 units. The year-to-date tally remains at record levels for now at an all-time high 935,946, up 4.1%. Forecasters however don’t count on a new record over the Full Year 2024 as sales are expected to slow down over the course of the next few months. All states and territories are in negative this month (this excludes Tesla and Polestar sales) bar tiny Northern Territory at +5.6% to 910 sales. Western Australia (10,551) resists best among the rest at -0.2%, with South Australia (-3.8% to 6,420) and Queensland (-8.3% to 21,481) keeping their loss to the single digits. New South Wales (-16.8% to 29,943), Victoria (-16.5% to 29,426), Tasmania (-11.1% to 1,754) and the Australian Capital Territory (-23.1% to 1,388) all struggle. Including Tesla and Polestar sales, SUV volumes drop -9.5% to 57,965 and 58% share vs. 57.9% a year ago and 53.1% in 2022, Light Commercials are down -9.3% to 21,568 and 21.6% share vs. 21.5% in September 2023 and 23.8% two years ago and Passenger Cars skid -15% to 15,824 and 15.9% share vs. 16.8% in 2023 and 18.7% in 2022. Heavy Commercials are up 6.5% to 4,524 and 4.5% share.
Disappointingly, private sales, a good measure of consumer sentiment, recede -17.2% year-on-year to 48,046. Business fleets are off -8.8% to 35,194, rentals off -8.1% to 6,165 and government fleets edge down -0.9% to 3,091. These all exclude Tesla, Polestar and heavy commercial sales. This time including Tesla and Polestar, petrol sales sink -17.5% to 43,403, diesel fares better at -12.3% to 29,483 but EVs crumble at -27.2% to 6,422. The hero of the month is HEV with sales up 34.4% to 13,569. PHEV also surge at +89.9% to 2,470. As for sales by country of origin, Japan is down -16% to 28,411, Thailand edge down -0.8% to 22,673, China is down -11.5% to 15,417, South Korea off -6.1% to 13,490 and Germany off -6.2% to 5,189.
Toyota (-13.4%) falls faster than the market to 18.1% share vs. 19.6% so far this year, it is notably handicapped by inexistent Prado sales in the wake of the new generation arriving in concessions. Ford (+3.6%) bucks the negative trend to 8.3% share, confirming its 2nd place overall ahead of Mazda (+2.1%). Kia (+4.8%) advances to 7.7% share, its highest in two years (7.8% in September 2022). Mitsubishi (+6.4%) sports the biggest gain in the Top 8 and is up one spot on August to #5, dislodging Hyundai (-9.4%). After being the star performer of the Australian market for many months, MG (-28.9%) is in deep trouble now and fellow Chinese carmaker GWM (+31.2%) is breathing down its neck. BYD (+160.2%) and Chery (+103.2%) both continue to ramp up whereas Tesla (-48.8%) and Audi (-42.9%) fall apart.
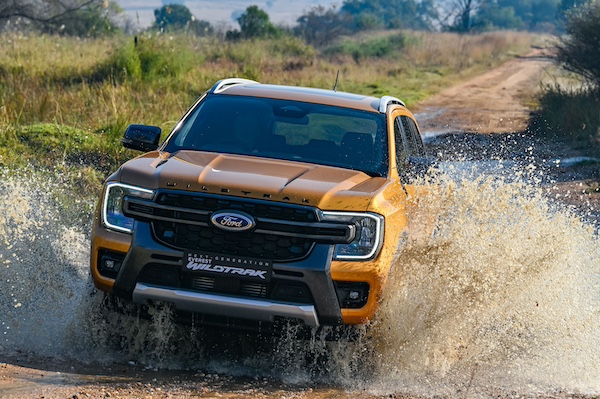
The Toyota RAV4 (+85.2%) three-peats at #1, once again catching up on backorders thanks to newfound availability of its hybrid variant. It is the 6th time the RAV4 is the overall best-seller in Australia, including 4 time this year: after July 2020, August 2020, April 2024, July 2024 and last month. The Ford Ranger (-17.4%) and Toyota Hilux (-25.3%) follow but endure devastating blows. The Ranger keeps the realm year-to-date and also wins the 4×4 ute fight at 4,187 sales vs. 3,545 for the Hilux. The Ford Everest (+46.3%) ends the month all guns blazing with a record ranking at #4 (also hit last April), record volume (2,902) and share (2.9%), benefitting from the absence of the Prado. Below the Isuzu D-Max (-9.5%) and Mitsubishi Outlander (-4%), the Kia Sportage (+1.2%) repeats at a record #7 while the Mazda CX-3 (+29.5%) is up to #8, its highest ranking since January 2023 (#4). The Kia Cerato (+339.9%) is the best-selling passenger car at #12, just as the BYD Sealion 6 advances further to #23, accounting for 61% of the brand’s volume.
Previous month: Australia August 2024: Declining sales, Toyota RAV4 breaks records again
One year ago: Australia September 2023: Record sales, Ford Everest cracks Top 10
Full September 2024 Top 47 All brands and Top 40 models below.
Australia September 2024 – brands:
PosBrandSep-24%/23Aug2024%/23PosFY231Toyota 18,11018.1%– 13.4%1183,60619.6%+ 18.7%112Ford 8,3038.3%+ 3.6%274,5648.0%+ 21.8%233Mazda 8,2018.2%+ 2.1%373,4877.9%– 2.3%324Kia 7,6507.7%+ 4.8%462,4736.7%+ 5.7%445Mitsubishi6,1306.1%+ 6.4%656,9986.1%+ 24.7%566Hyundai 5,6335.6%– 9.4%553,9475.8%– 5.3%657Isuzu Ute3,9293.9%– 0.1%737,5774.0%+ 16.2%7108MG3,8413.8%– 28.9%836,0963.9%– 15.7%879GWM3,8023.8%+ 31.2%1031,7933.4%+ 22.8%101310Subaru 3,1693.2%– 26.3%1131,5173.4%– 10.1%11911Volkswagen3,0713.1%– 26.6%1227,2682.9%– 14.4%131112Nissan 3,0673.1%– 35.9%934,6603.7%+ 20.8%91213Tesla2,6492.7%– 48.8%1430,7503.3%– 19.1%12814BMW2,3402.3%– 0.6%1719,6442.1%+ 3.2%141515Mercedes2,0352.0%+ 0.2%1318,4592.0%– 15.9%151416BYD1,8261.8%+ 160.1%1515,1811.6%+ 74.4%172117Suzuki 1,7231.7%+ 17.5%1615,9181.7%+ 20.3%161818Chery1,2681.3%+ 103.2%207,5080.8%+ 105.9%222919LDV1,1041.1%– 33.7%1812,4991.3%– 22.4%181620Lexus1,0981.1%– 26.7%199,7601.0%– 15.0%211921Audi9280.9%– 42.9%2111,1561.2%– 18.0%201722Honda 9030.9%– 14.2%2211,6061.2%+ 16.9%192023Porsche7490.7%+ 12.6%255,2040.6%+ 6.9%252724Volvo6280.6%– 23.0%236,9740.7%– 20.9%232225Land Rover6230.6%– 29.6%246,1130.7%– 1.4%242326Mini4970.5%+ 1.6%342,6580.3%– 19.6%313127Ssangyong4410.4%+ 17.9%294,3160.5%– 7.3%262828Renault4140.4%– 45.2%264,1970.4%– 35.6%272429Fiat4060.4%+ 110.4%321,6160.2%+ 2.7%333630Chevrolet3770.4%+ 1.3%273,0970.3%+ 18.5%293331Skoda3070.3%– 59.8%284,0430.4%– 32.9%282532Ram2760.3%– 57.8%302,9090.3%– 49.2%302633Jeep 2210.2%– 35.6%311,8830.2%– 48.5%323034Polestar2120.2%+ 91.0%381,3300.1%– 25.7%363535Cupra2070.2%– 50.7%351,6120.2%– 36.3%343236Genesis1310.1%– 34.5%361,0820.1%– 25.4%373737Peugeot1080.1%– 44.9%331,6050.2%– 13.0%353438Jaguar810.1%+ 68.8%376200.1%+ 65.8%384039Alfa Romeo340.0%– 48.5%394820.1%– 1.4%393840Lamborghini300.0%– 9.1%412140.0%+ 26.6%414141Maserati240.0%– 51.0%403010.0%– 38.4%403942Ferrari240.0%+ 4.3%421820.0%+ 5.8%424443Aston Martin220.0%+ 83.3%471190.0%+ 8.2%454644Citroen120.0%– 55.6%431150.0%– 39.8%464345Bentley80.0%– 68.0%461390.0%– 17.3%434246McLaren80.0%+ 60.0%44630.0%– 11.3%474747Lotus50.0%– 80.8%451340.0%+ 8.9%444548Rolls-Royce00.0%– 100.0%48380.0%+ 5.6%484849Dodge00.0%n/a –60.0%n/a49 –
Australia September 2024 – models:
PosModelSep-24%/23Aug2024%/23Pos1Toyota RAV45,1825.2%+ 85.2%143,2324.6%+ 93.1%22Ford Ranger4,4854.5%– 17.4%248,3625.2%+ 12.3%13Toyota Hilux4,3134.3%– 25.3%342,0714.5%– 5.0%34Ford Everest2,9022.9%+ 46.3%518,6132.0%+ 79.3%75Isuzu D-Max2,6122.6%– 9.5%423,3492.5%+ 8.7%46Mitsubishi Outlander2,5082.5%– 4.0%621,2492.3%+ 19.6%57Kia Sportage2,0552.1%+ 1.2%716,0951.7%+ 44.8%118Mazda CX-31,9822.0%+ 29.5%1013,8021.5%+ 12.8%169Mazda CX-51,7991.8%– 4.7%817,6771.9%+ 4.6%810Hyundai Tucson1,7661.8%+ 5.2%1314,3981.5%– 11.0%1211MG ZS1,7071.7%– 32.5%1216,9071.8%– 27.0%912Kia Cerato1,5881.6%+ 339.9%1512,8051.4%+ 220.0%2113Tesla Model Y1,4981.5%– 60.7%1816,6971.8%– 28.8%1014Mitsubishi Triton1,4751.5%+ 50.4%2013,3681.4%+ 11.8%1715Toyota Corolla1,4541.5%– 34.4%919,1762.0%+ 33.4%616Isuzu MU-X1,3171.3%+ 25.8%1714,2281.5%+ 31.0%1317Toyota Hiace1,2751.3%+ 43.3%1610,8871.2%+ 56.8%2318Mazda BT-501,2651.3%+ 2.7%1911,6141.2%– 13.6%2219Hyundai Kona1,2601.3%+ 3.4%1113,3521.4%+ 78.6%1820Mazda CX-301,1961.2%– 0.7%239,7811.0%+ 2.1%2621Tesla Model 31,1511.2%– 15.7%2614,0531.5%– 3.3%1422GWM Haval Jolion1,1251.1%+ 15.5%3410,3061.1%+ 23.8%2523BYD Sealion 61,1111.1%new283,2070.3%new6924Toyota Land Cruiser Wagon1,0931.1%– 22.2%1413,2141.4%+ 22.2%1925Toyota Land Cruiser PU/CC1,0711.1%– 11.4%279,2561.0%+ 12.1%2826Subaru Forester1,0471.0%– 26.0%2210,3201.1%– 14.8%2427Kia Carnival1,0381.0%– 7.6%317,6330.8%– 12.7%3728Nissan X-Trail9951.0%– 44.2%2112,8731.4%+ 37.7%2029Hyundai i309671.0%– 41.3%259,2431.0%– 44.0%2930MG 39581.0%– 33.6%359,5011.0%– 21.4%2731Toyota Yaris Cross9581.0%+ 49.5%305,9940.6%+ 42.0%4632Subaru Crosstrek9230.9%– 18.6%388,7650.9%+ 44.0%3133GWM Haval H69070.9%+ 12.7%466,8330.7%+ 4.4%4134Toyota Kluger8860.9%– 26.4%247,8500.8%– 2.1%3535Suzuki Jimny8340.8%+ 133.0%367,1580.8%+ 68.4%3936Mitsubishi ASX8280.8%– 29.0%299,1041.0%+ 32.7%3037Nissan Navara8030.8%– 8.8%377,9550.8%+ 35.5%3438Subaru Outback7770.8%– 42.7%418,0880.9%– 19.4%3339Chery Omoda 57560.8%+ 21.2%604,5000.5%+ 23.4%5740Mitsubishi Eclipse Cross7510.8%– 3.8%477,3760.8%+ 23.2%38
Source: VFACTS


