
USA July 2024: Subaru Crosstrek (+36.3%), Honda Civic (+17.7%) impress in negative market
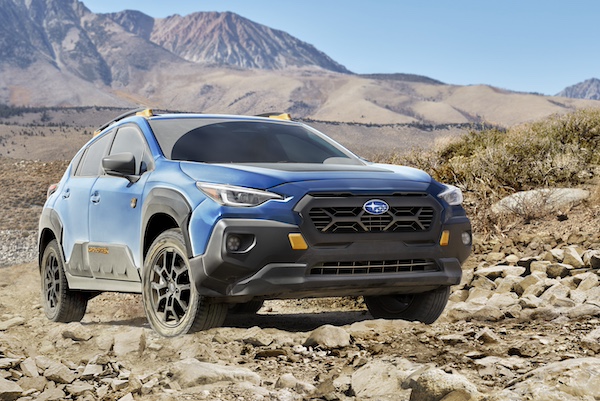
Subaru Crosstrek
The U.S. new vehicle market declines -2% year-on-year in July to 1.273 million units. This leads the year-to-date tally to 9.08 million units, up 1.4% over the year-ago figure of 8.95 million. The SAAR is up slightly to 15.8 million units, up from 15.7 million in July 2023 and 13.5 million in July 2022. The average daily selling rate (DSR) stands at 50,925, down from 51,971 a year ago. Light trucks account for 81% of total sales, up from 80% a year ago.
Among OEMs still making monthly sales data available, Toyota Motor (-5.1%) falls faster than the market, Ford Motor (-0.3%) is stable and Hyundai-Kia drops -3.3%. American Honda signs the best performance at +8%. As far as brands are concerned, Ford (-0.8%) is above Toyota (-8.3%) in difficulty, but Toyota stays ahead year-to-date for now. Honda (+9.9%), Hyundai (+4%) and Subaru (+2.6%) manage positive results while Mazda (+30.2%), Lexus (+16.1%) and Lincoln (+14.1%) excel.
Model-wise, the Ford F-Series edges up +0.7%, and like in Canada the Toyota RAV4 (-5.9%) is threatened by its archenemy the Honda CR-V (+3.4%). The Toyota Camry (-3.2%) evolves roughly like the market and holds onto its passenger cars crown ahead of the Honda Civic (+17.7%) in outstanding shape and the Toyota Corolla (-7.6%) weaker. The Subaru Crosstrek (+36.3%), Outback (+14.3%), Hyundai Elantra (+15.7%), Ford Maverick (+69.7%) and Explorer (+48.7%) stand out below.
Previous post: USA Full Year 2023: Exclusive State by State rankings now available
Previous month: USA Q2 2024: Stable market sees Toyota RAV4, Honda Civic and Chevy Trax record large gains
One year ago: USA July 2023: Honda, Acura, Volvo shine, sales up 15.3%
Full July 2024 data for selected groups, brands and models below.
USA July 2024 – selected groups:
GroupJul-24/232024/23Toyota Motor Corporation181,894– 5.1%1,368,541+ 11.2%Ford Motor Co172,187– 0.3%1,209,468+ 3.2%Hyundai-Kia138,976– 3.3%956,781– 0.7%American Honda120,737+ 8.0%811,018+ 9.1%Subaru51,702+ 2.6%374,145+ 5.5%Mazda39,866+ 30.2%242,352+ 13.0%Volvo Cars9,597– 11.0%70,609+ 0.1%
USA July 2024 – selected brands:
BrandJul-24/232024/23Ford164,585– 0.8%1,153,049+ 2.3%Toyota153,040– 8.3%1,172,476+ 11.0%Honda109,551+ 9.9%735,817+ 11.9%Hyundai69,202+ 4.0%468,725+ 1.6%Kia63,580– 10.4%450,040– 3.3%Subaru51,702+ 2.6%374,145+ 5.5%Mazda39,866+ 30.2%242,352+ 13.0%Lexus28,854+ 16.1%196,065+ 12.5%Acura11,186– 7.3%75,201– 12.3%Volvo9,597– 11.0%70,609+ 0.1%Lincoln7,602+ 14.1%56,419+ 23.4%Genesis6,194– 2.1%38,015+ 1.2%
USA July 2024 – selected models:
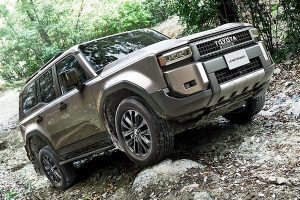
ModelJul-24/232024/23Ford F-Series68,992+ 0.7%421,398– 6.7%Toyota RAV435,593– 5.9%283,888+ 26.3%Honda CR-V34,216+ 3.4%230,420+ 17.1%Toyota Camry24,313– 3.2%179,555+ 2.1%Honda Civic20,185+ 17.7%149,973+ 35.0%Toyota Corolla19,749– 7.6%141,740+ 19.2%Toyota Tacoma18,571– 7.7%88,008– 35.7%Hyundai Tucson16,135– 8.0%108,281– 8.3%Subaru Crosstrek15,318+ 36.3%94,818+ 8.5%Subaru Outback14,204+ 14.3%95,907+ 2.2%Honda Accord 14,004– 21.6%94,725– 19.5%Hyundai Elantra13,764+ 15.7%76,053– 12.2%Ford Bronco Sport13,449+ 3.9%73,203– 3.8%Ford Maverick12,941+ 69.7%90,054+ 79.7%Ford Explorer12,887+ 48.7%117,690+ 4.1%Kia Sportage12,628+ 6.5%92,481+ 10.4%Mazda CX-512,430– 0.1%82,644– 10.6%Toyota Tundra12,388+ 18.5%90,842+ 29.4%Honda Pilot12,109+ 21.6%78,392+ 19.2%Honda HR-V11,928+ 33.7%88,191+ 40.4%Ford Transit11,635– 13.9%93,799+ 20.9%Subaru Forester10,682– 26.4%103,531+ 36.6%Ford Escape10,472– 15.6%85,010+ 10.0%Kia Forte10,448– 5.1%80,921+ 9.3%Lexus RX9,591+ 8.8%64,546– 2.5%Kia Telluride9,082– 6.9%62,782– 3.5%Hyundai Santa Fe8,989– 15.3%65,611– 8.6%Ford Bronco8,902– 30.2%59,054– 17.2%Mazda CX-308,679+ 20.2%59,901+ 30.9%Hyundai Palisade8,635+ 50.1%62,382+ 38.0%Mazda CX-508,047+ 90.1%43,244+ 68.3%Toyota Corolla Cross7,702+ 3.1%52,869+ 47.6%Toyota 4Runner7,627– 31.9%74,187+ 19.8%Kia Sorento7,206– 15.9%53,869+ 4.9%Honda Odyssey6,950+ 32.6%46,207+ 3.4%Hyundai Kona6,713+ 9.6%53,252+ 20.9%Lexus NX6,604+ 11.0%41,243+ 3.1%Toyota Land Cruiser6,268n/a9,729+ 243125.0%Toyota Highlander6,058– 29.5%66,166– 45.7%Hyundai Sonata5,755+ 79.3%36,902+ 20.8%Kia Seltos5,481+ 4.4%38,267+ 1.6%Ford Ranger5,386+ 24.8%20,561– 27.7%Mazda CX-905,330+ 82.0%28,289+ 227.7%Ford Expedition4,983+ 4.8%48,290+ 9.5%Lexus GX4,746+ 96.3%13,887– 11.8%Kia K54,713– 24.2%17,520– 52.8%Ford Mustang Mach-E4,592+ 16.6%26,826+ 49.2%Kia Carnival4,557– 13.8%25,640+ 11.0%Toyota Sienna4,403– 28.5%37,271+ 9.3%Subaru Ascent4,220– 1.4%32,175– 14.0%Honda Ridgeline4,148– 0.6%24,070– 23.8%Acura RDX4,013+ 21.9%24,147+ 27.3%Ford Edge3,981– 58.7%55,660– 0.8%Mazda33,959+ 32.2%21,786+ 20.2%Acura MDX3,845– 12.6%29,539– 18.8%Lexus ES3,778+ 17.3%23,336+ 3.5%Honda Prologue3,458new4,993newKia Soul3,428– 33.1%31,893– 20.0%Hyundai Ioniq 53,416– 17.4%22,144+ 24.6%Toyota Venza3,378+ 21.1%24,905+ 57.0%Ford Mustang3,209+ 160.3%30,653+ 14.8%Lincoln Nautilus3,097+ 27.0%20,601+ 39.3%Volvo XC903,024– 18.7%21,215– 0.9%Ford E-Series2,785– 38.9%23,053– 4.3%Volvo XC402,761+ 13.0%15,633+ 7.1%Genesis GV702,681+ 6.2%14,862+ 3.7%Kia Niro2,674– 14.1%20,776– 7.4%Hyundai Santa Cruz2,615– 9.9%20,560– 10.4%Subaru Impreza2,578– 7.9%17,470– 20.9%Honda Passport2,553– 22.2%18,846– 30.4%Lincoln Corsair2,450– 4.3%15,299+ 25.5%Hyundai Venue2,400– 7.0%15,771– 16.7%Volvo XC602,345– 25.8%20,172– 12.3%Toyota Sequoia2,146+ 30.9%15,014+ 33.9%Acura Integra2,018– 26.4%15,656– 18.7%Genesis GV801,981+ 32.2%12,072+ 23.8%Kia EV91,815new11,486newSubaru Legacy1,799– 17.1%11,249– 20.4%Lincoln Navigator1,686+ 12.4%8,236– 20.5%Kia EV61,547– 20.1%12,488+ 21.7%Lexus IS1,458– 28.6%11,607– 11.8%Subaru WRX1,369– 27.7%10,664– 38.2%Subaru Solterra1,261+ 66.4%6,646+ 78.2%Lexus RZ1,232+ 148.9%6,871+ 326.2%Toyota Prius1,201– 69.5%16,574– 12.2%Toyota Crown1,173– 43.1%15,104+ 83.9%Toyota bZ4X1,109+ 55.3%10,577+ 141.9%Volvo S601,020+ 71.4%10,290+ 162.5%Toyota GR861,001– 27.0%8,468+ 27.6%Mazda CX-70917new1,976newGenesis G70850– 35.1%6,346– 15.8%Hyundai Ioniq 6778– 55.4%7,690+ 54.1%Acura ZDX694new1,032newAcura TLX616– 62.2%4,827– 56.6%Lexus UX581– 35.3%5,953– 22.7%Mazda MX-5 Miata504– 30.0%4,508– 27.7%Lexus LX456– 14.1%3,771– 5.2%Ford Transit Connect371– 66.1%7,798– 20.8%Lincoln Aviator369+ 125.0%12,283+ 46.6%Toyota Supra308+ 96.2%1,803+ 1.4%Genesis GV60296+ 13.4%1,522– 3.7%Genesis G80274– 56.3%2,404– 32.4%Subaru BRZ271– 12.9%1,685– 40.3%Volvo V60197+ 55.1%1,619+ 41.9%Lexus LS156– 13.8%1,370– 1.6%Lexus RC147+ 8.1%1,088+ 11.2%Genesis G90112+ 3.7%809– 0.2%Volvo C40106– 81.2%721– 85.9%Lexus LC105– 35.2%1,071+ 8.5%Volvo S9098– 24.6%654– 35.8%Volvo V9046+ 0.0%305– 14.1%Toyota Mirai26– 94.4%271– 87.6%Toyota Grand Highlander24– 99.6%55,406+ 900.8%Hyundai Nexo2– 94.1%79– 43.2%Toyota Avalon2n/a7– 83.7%Kia Rio1– 100.0%1,917– 88.4%
Source: Manufacturers

More Stories
Hong Kong (China) Full Year 2025: BYD and Sealion 7 take charge
This content is for members only. Visit the site and log in/register to read.
2027 Toyota Tundra Trailhunter Brings Factory Off-Road Upgrades to the SR5
Toyota is giving the 2027 Tundra a tougher personality with the addition of a new Trailhunter package, bringing factory-backed off-road...
Trump Adds 50 Percent Tariffs on Canadian Goods as Auto Trade Fight Escalates
The trade fight between the United States and Canada is escalating again, and the auto industry is right in the...
U.S. Automakers Race to Remove Chinese Connected-Car Hardware as New Federal Rules Loom
The U.S. auto industry is entering another major supply-chain shift, and this one reaches deep into the electronics that make...
Portugal June 2026: Sales up 13.6%, Dacia and Tesla break volume records
Dacia posts its first 2,000+ sales month in Portugal. Another solid result for new car sales in Portugal, up 13.6%...
Cadillac CT5-V Blackwing Successor Reportedly Planned as Next-Gen Super Sedan Takes Shape
Cadillac’s CT5-V Blackwing may not be heading quietly into history after all. While the current-generation CT5-V Blackwing is set to...