USA March/Q1 2024: Market up 5%, Toyota (+21.3%), Honda (+20.9%) shine
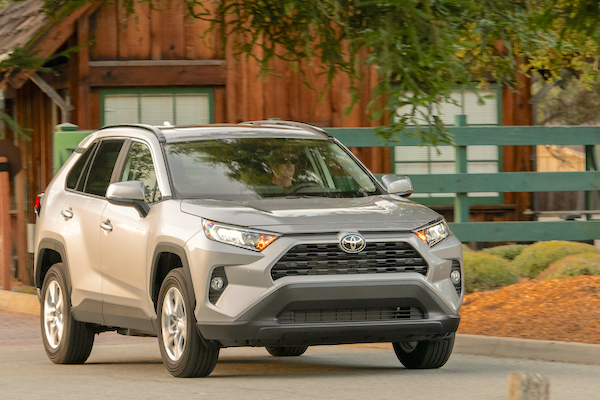
Toyota RAV4 sales are up 47.4% year-on-year in Q1.
New light vehicle sales in the US edge up 5.1% in March to an estimated 1,455,000 units. Passenger cars are stable at 294,000 sales and 20.2% share while light trucks (pickups+SUVs) climb 6.5% to 1,161,000 and 79.8% share. The Seasonally Adjusted Annualised Rate of sales (SAAR) is up to 15.56 million vs. 15.02 million in March 2023. This means the Q1 volume is also up 5.1% to an estimated 3.77 million units. Passenger cars are up 1.3% to 755,000 and light trucks up 6.1% to 3.02 million.
Over Q1, General Motors (-1.5%) remains the most popular group in the country with just over 590,000 sales but drops year-on-year. Toyota Motor (+20.3%) soars to 2nd place, overtaking Ford Motor (+7%), both manufacturers outrunning the market. Hyundai-Kia (-0.8%) and Stellantis (-9.6%) disappoint wares American Honda (+17.3%) and Nissan Motor/Mitsubishi (+9.5%) post solid scores. The Volkswagen Group (+1.1%) is up but trails the market growth.
Brand-wise, Toyota (+21.3%) reclaims the top spot it held over the Full Year 2023 with 487,000 sales, distancing Ford (+6%) and Chevrolet (-2.2%). Honda (+20.9%) catches up on a drab year-ago performance with Nissan (+8.5%) also beating the market. Subaru (+6.7%) also impresses at #9 but Tesla (-13.2%) endures the steepest fall in the Top 12. Volkswagen (+21%), Buick (+16.4%), Lexus (+15%) and Mazda (+13.3%) also shine below. In contrast Ram (-26%), Audi (-16.2%) and Dodge (-15.7%) are all hit hard. Rivian (+70.1%) ranks #31 and Ineos lands at #36.
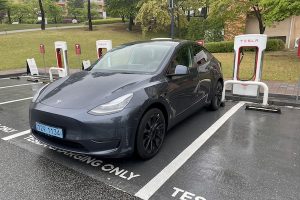
Over in the models ranking, the Ford F-Series continues to dominate but drops a worrying -10.2% year-on-year. The Chevrolet Silverado (+2.9%) follows but is threatened by the Toyota RAV4 (+47.4%) surging to #3 overall. The Tesla Model Y (-4.1%) ranks 4th despite a year-on-year loss, ahead of the Honda CR-V (+41.3%) back in great shape. Below the Nissan Rogue (+18.7%) also strong at #6, we find the Ram Pickup (-15.1%) freefalling from its traditional third place to #7. The Toyota Camry (+18.6%) and Honda Civic (+36%) are the only two passenger cars in the Top 10, ranking #8 and #10 respectively. The Tesla Cybertruck is estimated to sell over 4,000 units over the period.
Previous month: USA February 2024: Honda, Lincoln stand out in market up 6.3%
One year ago: USA March/Q1 2023: General Motors, Ford Motor overtake Toyota Motor, Q1 market up 7.8%
Full Q1 2024 Top 15 groups, Top 50 All brands and Top 305 All models below.
USA Q1 2024 – groups:
PosGroupQ1 2024/23FY231General Motors590,055– 1.5%12Toyota Motor Corporation565,098+ 20.3%23Ford Motor Co504,815+ 7.0%34Hyundai-Kia379,203– 0.8%45Stellantis334,841– 9.6%56American Honda333,824+ 17.3%67Nissan Motor/Mitsubishi281,138+ 9.5%78Subaru152,996+ 6.7%109Volkswagen Group141,522+ 1.1%910Tesla140,303– 13.2%811Mazda100,103+ 13.3%1212BMW Group91,444+ 1.3%1113Mercedes-Benz82,623+ 9.1%1314Volvo Cars30,951+ 16.9%1415Jaguar Land Rover20,558+ 18.1%15
USA Q1 2024 – brands:
PosBrandQ1 2024/23FY231Toyota486,627+ 21.3%12Ford479,921+ 6.0%23Chevrolet385,585– 2.2%34Honda303,451+ 20.9%45Nissan238,831+ 8.5%56Hyundai184,804+ 0.2%67Kia179,622– 2.5%78Jeep157,039+ 1.8%99Subaru152,996+ 6.7%1010Tesla140,303– 13.2%811GMC124,378– 4.8%1112Mazda100,103+ 13.3%1313Ram95,308– 26.0%1214BMW84,475+ 2.4%1415Mercedes82,623+ 9.1%1516Volkswagen82,101+ 21.0%1617Lexus78,471+ 15.0%1718Buick44,385+ 16.4%2019Audi44,226– 16.2%1820Dodge42,948– 15.7%1921Cadillac35,451– 2.4%2122Chrysler34,807+ 9.1%2323Volvo30,951+ 16.9%2424Acura30,373– 9.2%2225Mitsubishi28,403+ 35.7%2526Lincoln24,894+ 31.5%2627Land Rover17,484+ 18.0%3028Genesis14,777+ 7.3%2829Infiniti13,904– 17.0%2930Porsche13,429– 23.0%2731Rivian11,950+ 70.1%3132Mini6,369– 12.6%3233Jaguar3,074+ 19.0%3534Maserati2,300+ 9.5%3635Alfa Romeo2,285– 4.4%3336Ineos2,005new –37Fisker1,660new4138Polestar1,100– 53.0%3439Lamborghini936+ 18.5%3840Ferrari850+ 21.4%4041Bentley830– 22.8%3742Lucid600– 24.1%3943Rolls Royce600+ 13.2%4244Aston Martin450+ 8.4%4345VinFast300new4746BrightDrop256new4647Fiat154+ 11.6%4548McLaren110– 33.3%4449Lotus5– 85.7%4950Karma1– 99.2%48
USA Q1 2024 – models:
PosModelQ1 2024/23FY231Ford F-Series152,943– 10.2%12Chevrolet Silverado127,563+ 2.9%23Toyota RAV4124,822+ 47.4%44Tesla Model Y (est)100,211– 4.1%55Honda CR-V95,038+ 41.3%66Nissan Rogue90,804+ 18.7%97Ram Pickup89,417– 15.1%38Toyota Camry78,337+ 18.6%89GMC Sierra68,597+ 2.1%710Honda Civic61,929+ 36.0%1611Toyota Corolla60,071+ 39.8%1212Ford Explorer58,465+ 0.7%1813Jeep Grand Cherokee54,455– 0.1%1014Chevrolet Equinox54,185+ 2.4%1315Subaru Forester48,546+ 59.6%2416Hyundai Tucson45,509– 1.4%1517Honda Accord 41,927– 2.1%1718Nissan Sentra40,081+ 78.0%4519Ford Transit39,890+ 24.6%3020Ford Maverick39,061+ 81.9%4921Subaru Crosstrek38,405– 7.6%2122Jeep Wrangler38,308+ 0.9%2223Honda HR-V38,062+ 43.6%3624Chevrolet Trax37,588+ 481.4%4425Kia Sportage37,286+ 17.7%2626Ford Escape36,595+ 73.0%2527Toyota Tundra36,215+ 31.0%3328Subaru Outback35,213+ 7.5%2029Ford Edge35,157+ 73.3%4630Mazda CX-534,345– 11.3%2331Toyota 4Runner33,823+ 60.2%3832Kia Forte33,623+ 10.1%3433Chrysler Pacifica33,114+ 14.5%3734Chevrolet Malibu32,749– 12.5%2935Toyota Highlander32,033– 42.1%1936Ford Bronco Sport31,565+ 5.7%3237Honda Pilot30,051+ 21.6%4338Nissan Altima28,583– 12.9%3139Mazda CX-3028,496+ 43.4%5540Jeep Compass27,647+ 19.1%4841Hyundai Elantra26,860– 17.3%2742Lexus RX26,473+ 2.0%3943Hyundai Santa Fe26,094– 8.5%2844Kia Telluride25,578– 5.9%4145Tesla Model 3 (est)25,400– 48.3%1446VW Atlas25,326+ 38.3%7747Hyundai Palisade25,255+ 28.8%5048Toyota Grand Highlander25,136new9149Chevrolet Trailblazer 24,208– 13.4%4050Ford Bronco24,066– 25.8%4751Chevrolet Tahoe23,324– 14.4%4252Hyundai Kona23,054+ 19.9%5453Kia Sorento22,244+ 10.3%5154GMC Terrain21,864+ 22.0%6355VW Tiguan21,626+ 9.5%5656Ford Expedition21,560+ 11.4%6157Toyota Tacoma21,558– 59.8%1158Nissan Frontier19,744+ 16.6%8259Toyota Corolla Cross19,028+ 31.1%6560Nissan Pathfinder19,012– 20.0%6461GMC Yukon18,013– 8.7%5262Chevrolet Traverse17,475– 44.6%3563Honda Odyssey17,393– 12.6%5864Chevrolet Blazer17,195+ 12.7%7165Lexus NX17,119+ 10.0%5966BMW X316,488+ 9.1%7467Toyota Sienna16,074+ 53.3%6968Mazda CX-5015,867+ 62.5%9569Mercedes Sprinter15,411+ 18.2%7970Mitsubishi Outlander 15,368+ 34.7%8971Dodge Durango15,129– 13.4%6772Mercedes GLE15,096– 9.8%8373BMW X514,923– 13.8%6274Chevrolet Colorado14,922+ 12.6%6675Kia Seltos14,783+ 6.4%8076Nissan Kicks13,724+ 16.0%6877Ford Mustang13,707– 6.8%9078Buick Encore GX13,364+ 8.8%7379Toyota Prius13,327+ 138.6%10980Buick Envision13,203– 6.2%9681Hyundai Sonata13,164– 9.2%9382Jeep Wagoneer13,131+ 136.2%12883VW Jetta13,024+ 184.7%9284Jeep Gladiator12,989– 4.3%8585Subaru Ascent12,683– 14.2%7886Kia Soul12,452– 26.7%7687VW Taos11,808– 12.2%8188Audi Q511,473– 32.8%6089Honda Ridgeline11,296– 12.6%8790Acura MDX11,141– 26.8%8491Dodge Charger10,660– 51.8%5792Ford E-Series10,440– 3.2%9993Acura RDX10,117+ 48.6%10794Mazda CX-909,984+ 3378.7%12495Mazda39,962+ 36.6%12596Lexus TX9,956new22097Dodge Challenger9,737– 14.4%9498Chevrolet Suburban9,684– 30.5%8699Buick Envista9,652new182100Ford Mustang Mach E9,589+ 77.3%101101Kia Carnival9,538+ 33.8%97102Lincoln Nautilus9,231+ 67.7%143103Cadillac Escalade9,135– 1.0%100104Volvo XC908,953+ 13.5%104105BMW 4 Series8,847– 26.3%88106Volvo XC608,741– 0.2%105107Mercedes GLC8,614+ 224.3%103108Chevrolet Corvette8,576+ 8.5%115109Rivian R1S8,500+ 431.3%146110Lexus ES8,471– 2.4%108111Hyundai Santa Cruz8,417– 9.6%111112BMW 3 Series8,412+ 24.6%116113Buick Enclave8,101– 8.0%106114Mercedes C Class8,052– 2.9%118115Toyota Venza7,961+ 6.6%126116Honda Passport7,755– 32.1%98117GMC Acadia7,674– 51.9%70118Toyota Crown7,584+ 444.4%163119Chevrolet Express7,502– 12.7%102120Kia Niro7,475– 23.9%112121Nissan Versa7,474+ 91.6%139122Mercedes GLS7,458+ 17.2%144123Subaru Impreza7,434– 15.9%114124Dodge Hornet7,419+ 33622.7%213125Chevrolet Bolt7,040– 64.3%75126BMW X76,957+ 2.8%130127Audi Q36,926+ 79.7%152128Volvo XC406,914+ 13.7%131129Tesla Model X (est)6,896+ 216.0%151130BMW 5 Series6,872– 8.8%150131Hyundai Ioniq 56,822+ 18.9%117132Kia K56,753– 52.7%72133Acura Integra6,485– 15.8%120134Infiniti QX606,333– 11.3%127135Lincoln Corsair6,286+ 56.3%142136Cadillac XT56,275– 13.9%134137Lincoln Aviator6,250+ 19.4%176138VW ID.46,167– 36.8%110139BMW X16,012+ 89.6%157140Toyota Sequoia5,958+ 35.9%153141Hyundai Venue5,932– 31.0%132142Ram ProMaster Van5,853– 66.9%53143Cadillac Lyriq5,800+ 499.2%214144Jeep Renegade5,763+ 39.6%136145Land Rover Defender5,705+ 52.3%155146Porsche Macan5,671– 18.8%133147Mercedes GLB5,566+ 46.4%173148GMC Canyon5,484+ 9.3%149149Genesis GV705,330+ 0.4%137150Volvo S605,036+ 234.8%202151Lexus IS5,007– 6.6%148152Mitsubishi Mirage5,003+ 49.7%184153Ford Transit Connect4,965+ 29.9%166154Range Rover 4,945+ 69.3%174155Cadillac XT44,879– 28.0%147156Audi A54,796– 14.3%145157Genesis GV804,768+ 21.0%160158Nissan Murano4,726– 62.0%122159Cadillac XT64,606– 3.3%162160Mitsubishi Outlander Sport4,569– 1.0%177161Subaru WRX4,404– 42.1%140162Subaru Legacy4,398– 13.1%138163Mini Cooper4,243– 5.6%158164Audi Q74,205– 34.5%129165Nissan Titan4,145+ 2.6%161166Nissan Ariya4,142+ 44.8%181167Range Rover Sport4,116+ 53.8%196168Mercedes EQE SUV4,090new201169Kia EV64,059+ 19.7%164170Tesla Cybertruck (est)4,035new306171Kia EV94,007new280172Nissan Armada3,977– 45.3%156173Lexus GX3,858– 39.4%121174Tesla Model S (est)3,761– 35.4%169175Audi A33,712– 8.8%178176Hyundai Ioniq 63,646+ 1542.3%186177VW Golf3,645+ 144.8%199178Chevrolet Camaro3,574– 54.1%123179Jeep Grand Wagoneer3,550+ 73.7%200180BMW 2 Series3,538+ 155.8%195181Mitsubishi Eclipse Cross3,463+ 120.3%206182Mercedes E Class/CLS3,437+ 12.5%171183Porsche Cayenne3,261– 24.0%159184Lincoln Navigator3,127– 25.0%167185Cadillac CT53,022– 34.2%165186Mercedes G Class3,007+ 5.7%204187BMW iX2,945+ 25.3%170188Lexus UX2,701– 15.4%192189Genesis G702,692+ 4.3%183190Audi Q4 e-tron2,678+ 23.0%221191Acura TLX2,630– 29.3%172192BMW 7 Series2,592– 10.2%198193Infiniti QX502,569+ 10.3%205194Infiniti QX802,473– 22.3%188195Audi A42,452– 53.2%179196Rivian R1T2,400– 29.4%175197BMW X42,386– 2.9%210198Mercedes S Class2,380– 20.6%191199Audi Q8 e-tron2,260+ 47.2%229200Mercedes GLA2,247– 50.2%189201Mini Countryman2,126– 23.7%190202Toyota GR862,041+ 0.1%197203Audi A62,020+ 1.8%219204Ineos Grenadier2,005new –205Porsche 9111,930– 23.1%194206Ford Ranger1,918– 83.3%119207Toyota bZ4X1,897+ 11.7%212208Kia Rio1,823– 74.0%135209Audi Q81,796– 37.2%180210Mercedes EQS SUV1,735– 32.1%216211Cadillac CT41,734– 36.1%215212Lexus LX1,697+ 8.0%224213Chrysler 3001,693– 43.4%185214GMC Hummer EV Pickup1,668+ 83300.0%247215Fisker Ocean1,660new262216Lexus RZ1,603+ 766.5%236217Jaguar F-Pace1,574– 2.3%238218BMW X61,534– 32.9%203219BMW 8-Series1,464– 6.9%232220Mazda MX-5 Miata1,411– 45.5%217221Infiniti Q501,397+ 2.3%230222Porsche Taycan1,247– 18.3%222223Jeep Cherokee1,196– 90.9%141224Subaru Solterra1,147– 15.6%218225Nissan Leaf1,142– 51.5%223226Range Rover Velar1,101– 47.8%225227Polestar 21,100– 52.0%208228Infiniti QX551,095– 19.8%235229GMC Savana1,078– 77.5%154230Genesis G801,072– 0.2%233231Mercedes EQE1,023– 47.4%239232Rivian EDV1,000– 33.3%284233Alfa Romeo Stelvio917– 35.6%237234Mercedes CLE859new –235Ferrari car850+ 21.4%251236Mercedes EQS817– 62.9%227237Porsche 718797– 29.1%240238Audi e-Tron GT776+ 6.9%248239Subaru BRZ766– 22.2%242240Alfa Romeo Tonale728new264241Mercedes AMG GT706– 7.5%265242Range Rover Evoque704– 54.9%243243Lexus LS683+ 18.6%261244Jaguar i-Pace679+ 592.9%295245Mercedes EQB SUV671– 66.9%193246Nissan Z671+ 44.0%271247Volvo V60654+ 29.5%267248Mercedes Metris642– 27.5%211249Alfa Romeo Giulia640– 33.7%244250Lamborghini Urus636+ 47.9%266251Mercedes CLA Class610– 78.6%207252Lucid Air600– 24.1%249253Land Rover Discovery563+ 45.9%256254Bentley Bentayga560– 2.6%269255BMW X2560+ 617.9%301256BMW XM541+ 32.3%258257Nissan Maxima529– 76.0%209258Porsche Panamera523– 48.0%241259VW Arteon505– 4.4%257260Lexus LC493+ 13.9%272261Audi A7488– 10.3%270262Toyota Supra484– 44.4%253263Genesis GV60473– 7.6%246264Genesis G90442+ 24.2%277265Audi A8428+ 10.0%260266Lexus RC410+ 7.9%273267BMW Z4403+ 1.3%268268Rolls Royce Cullinan400+ 8.1%278269Land Rover Discovery Sport350– 75.3%250270Jaguar F-Type342– 5.8%279271Jaguar XF338+ 30.5%285272Aston Martin car300+ 25.0%286273Lamborghini Huracan300– 16.7%275274VinFast VF8300new299275Volvo C40289– 75.2%228276Bentley Car270– 46.0%259277Volvo S90258– 42.7%276278BrightDrop Zevo256new296279Mercedes SL Class201– 76.9%245280Rolls Royce car200+ 25.0%294281Audi R8181+ 86.6%291282Toyota Mirai172– 74.3%252283Aston Martin DBX150– 14.3%287284Jaguar E-Pace141– 44.0%297285Fiat 500X113– 16.3%293286McLaren Car110– 33.3%282287Volvo V90106– 16.5%292288Nissan GT-R77– 46.2%298289Buick Encore55– 98.2%231290Hyundai Nexo51– 21.5%300291Rivian RCV50– 90.5%226292Fiat 50041n/a315293Ram ProMaster City38– 99.3%187294Infiniti Q6037– 90.1%283295Audi TT35– 80.9%290296Mazda CX-7035new –297Lotus car5– 85.7%305298Toyota Avalon5– 86.8%309299Mazda CX-93– 100.0%168300Dodge Grand Caravan2+ 100.0%314301BMW i31n/a –302Dodge Viper1n/a327303Karma GS-61– 98.9%303304Kia Stinger1– 100.0%234305Mercedes A Class1– 98.3%302
Source: Manufacturers, Teslike

