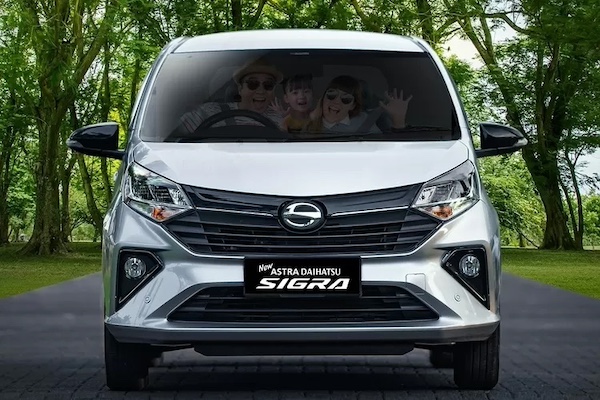
Indonesia March 2024: Daihatsu Sigra (+12.9%), Toyota Kijang Innova (+36.1%) defy sinking market
The Daihatsu Sigra threepeats at #1 in Indonesia.
New vehicle wholesales in Indonesia sink -26.1% year-on-year in March to just 74,724 units, leading to a Q1 volume off -23.8% to 215,069. Meanwhile retail sales drop -14.8% to 82,092 and are down -14.9% year-to-date to 230,776. In the wholesales brands ranking, Toyota (-28.3%) loses even more ground than the market to 28.3% share vs. 30.5% so far this year, followed by Daihatsu (-16.8%) performing much better. Mitsubishi (-12.9%), Suzuki (-20.9%) and Isuzu (-23.3%) also resist relatively well while Wuling (-30.7%) is up to #8 and the only Top 10 manufacturer in positive YTD. Retail-wise, Toyota (-12.9%) and Daihatsu (-6.2%) both beat the market as do Mitsubishi (-13.3%) and Suzuki (-14.2%). The performer of the month is Wuling (+11.2%) at #6.
Looking at the models ranking, the Daihatsu Sigra (+12.9%) defies the plunging market to threepeat at #1 with a commanding 7.6% share. It cements its year-to-date leadership at 7.8% of the market. The Honda Brio (-23.3%) stays in 2nd place while the Toyota Kijang Innova (+36.1%) soars to #3. The Daihatsu Gran Max Pikap (-1%) is almost stable at #4, with the Toyota Calya (-9.3%) the only remaining Top 10 model to outrun the market. The Wuling Binguo (#26) is the most successful recent launch above the Toyota Yaris Cross (#30) and Chery Omoda E5 (#31).
Previous month: Indonesia February 2024: Daihatsu Sigra repeats at #1 in struggling market
One year ago: Indonesia March 2023: Honda, Hyundai again among best performers in market edging up
Full March 2024 Top 30 All brands (wholesales and retail) and Top 155 All models (wholesales) below.
Indonesia March 2024 – brands (wholesales):
PosBrandMar-24%/23Feb2024%/23PosFY231Toyota21,14228.3%– 28.3%165,65530.5%– 23.5%112Daihatsu16,55222.2%– 16.8%246,00321.4%– 15.3%223Honda10,57214.1%– 37.3%328,06613.0%– 40.3%334Suzuki6,6708.9%– 20.9%517,8018.3%– 20.7%545Mitsubishi6,1538.2%– 12.9%419,1098.9%– 12.9%456Mitsubishi Fuso2,3113.1%– 42.7%76,5953.1%– 43.0%877Isuzu2,2513.0%– 23.3%86,8463.2%– 23.8%788Wuling2,0802.8%– 30.7%105,4572.5%+ 13.6%9109Hyundai1,8122.4%– 45.8%67,2433.4%– 30.6%6610Hino1,6512.2%– 47.3%94,5382.1%– 41.6%10911Chery8031.1%+ 213.7%111,5330.7%+ 243.7%111412Mazda4790.6%+ 2.4%121,0040.5%– 23.5%121213Mercedes4130.6%– 32.1%138460.4%– 43.9%131114Lexus3530.5%+ 106.4%166830.3%+ 172.1%161515MG3400.5%+ 178.7%146850.3%+ 105.1%152016BMW 3200.4%– 3.0%157610.4%– 2.3%141317Kia 1780.2%– 8.7%203830.2%+ 24.4%181818Nissan1470.2%– 21.8%183540.2%– 28.8%191719UD Trucks1370.2%– 27.5%174520.2%– 22.7%171620Mini850.1%– 17.5%211980.1%+ 14.5%212121Dongfeng (DFSK)790.1%– 31.3%192910.1%– 41.3%201922Citroen500.1%new221210.1%new22 –23Scania420.1%– 40.0%26870.0%– 59.0%242224Subaru400.1%– 14.9%231120.1%– 9.7%232425FAW270.0%+ 68.8%25740.0%+ 68.2%252326Volkswagen120.0%– 64.7%27340.0%– 67.0%282627Neta100.0%new24690.0%new262828Seres90.0%new29390.0%new272929Peugeot30.0%– 91.7%28230.0%– 67.6%292730Audi20.0%+ 100.0%3080.0%+ 0.0%303031Tata10.0%+ 0.0% –10.0%– 92.3%3131
Indonesia March 2024 – brands (retail):
PosBrandMar-24%/23Feb2024%/23PosFY231Toyota26,14231.8%– 12.9%172,97031.6%– 9.7%112Daihatsu17,35221.1%– 6.2%249,14721.3%– 14.6%223Honda10,70613.0%– 26.7%329,74412.9%– 21.1%334Mitsubishi7,0398.6%– 13.3%419,7928.6%– 16.3%455Suzuki6,5508.0%– 14.2%518,8138.2%– 16.9%546Wuling2,3272.8%+ 11.2%105,9472.6%+ 10.8%9107Isuzu2,2102.7%– 25.0%66,8133.0%– 18.0%788Mitsubishi Fuso2,1252.6%– 40.2%86,3782.8%– 38.6%879Hyundai2,1012.6%– 36.4%77,2973.2%– 24.4%6610Hino1,9722.4%– 26.3%95,8492.5%– 28.5%10911Chery6730.8%+ 170.3%111,3510.6%+ 186.2%111412Mazda4810.6%+ 5.0%131,0950.5%– 0.3%121213Mercedes4490.5%– 13.5%129620.4%– 30.1%131114Lexus3720.5%+ 124.1%166940.3%+ 173.2%151515MG3400.4%+ 139.4%156930.3%+ 113.9%162016BMW 3200.4%+ 12.3%147750.3%+ 11.5%141317Nissan2020.2%– 1.0%184160.2%– 20.9%171718Kia 1720.2%– 23.6%174100.2%– 16.3%181919UD Trucks1310.2%– 19.1%193520.2%– 24.6%201620Dongfeng (DFSK)1260.2%– 10.0%203580.2%– 18.8%191821Mini1020.1%+ 2.0%212040.1%+ 13.3%212122Subaru460.1%– 19.3%221380.1%+ 19.0%222423Scania420.1%– 40.0%26870.0%– 59.0%232224Citroen370.0%new24720.0%new26 –25FAW270.0%+ 68.8%25740.0%+ 68.2%252326Neta160.0%new23740.0%new242827Volkswagen140.0%– 64.1%27360.0%– 58.1%272628Jeep70.0%– 81.1%28310.0%– 72.1%282529Seres60.0%new30270.0%new293030Peugeot30.0%– 91.7%29230.0%– 67.6%302731Audi20.0%+ 100.0%3180.0%+ 0.0%3129
Indonesia March 2024 – models (wholesales):
PosModelMar-24%/23Pos2024%/23PosFY231Daihatsu Sigra5,6747.6%+ 12.9%116,8767.8%+ 0.3%132Honda Brio5,0616.8%– 23.3%215,0597.0%– 22.9%243Toyota Kijang Innova4,6386.2%+ 36.1%513,6736.4%+ 25.8%314Daihatsu Gran Max Pikap4,5516.1%– 1.0%610,7785.0%– 24.7%565Toyota Avanza3,7955.1%– 32.7%311,8985.5%– 29.9%426Toyota Calya3,5104.7%– 9.3%810,0584.7%– 14.6%757Mitsubishi Xpander3,2074.3%– 25.8%710,1914.7%– 19.8%688Suzuki Carry Pikap2,7583.7%– 38.8%98,0463.7%– 35.4%979Honda HR-V2,1072.8%– 50.1%145,1602.4%– 55.0%111010Daihatsu Terios2,0872.8%– 31.5%106,0632.8%– 3.8%101111Toyota Rush1,7452.3%– 55.7%48,3843.9%– 35.0%8912Daihatsu Ayla1,7372.3%– 50.0%134,5722.1%– 35.4%131213Honda BR-V1,6422.2%– 38.3%223,2621.5%– 57.0%191714Toyota Fortuner1,5802.1%– 3.1%203,6541.7%– 21.1%182115Mitsubishi Pajero Sport1,3951.9%– 12.0%183,8431.8%– 10.5%162416Toyota Veloz1,3081.8%– 48.2%113,9711.8%– 39.7%141417Daihatsu Xenia1,1961.6%– 30.1%153,7981.8%– 12.8%172218Toyota Agya1,1601.6%– 50.6%124,9302.3%+ 2.7%121319Toyota Raize1,0861.5%– 53.7%252,4891.2%– 54.1%241820Toyota Hilux1,0751.4%– 54.4%172,4021.1%– 70.3%271621Suzuki XL71,0431.4%– 21.2%213,0901.4%– 20.3%212022Isuzu Traga PHR8691.2%– 31.0%272,4441.1%– 27.6%262623Honda WR-V8441.1%– 57.2%192,6601.2%– 45.8%231524Mitsubishi L-300 Pikap8291.1%– 12.3%242,6631.2%– 34.6%222325Hyundai Stargazer8251.1%– 28.6%163,8451.8%– 23.5%151926Wuling Binguo8171.1%new343,1211.5%new205627Suzuki Ertiga7441.0%– 38.2%302,2391.0%– 31.3%292728Daihatsu Gran Max Minibus7010.9%– 19.5%262,4561.1%+ 0.5%252529Mitsubishi L200 Triton6840.9%+ 230.4%281,4830.7%+ 36.3%312830Toyota Yaris Cross6580.9%new361,1120.5%new323031Chery OMODA E56080.8%new398810.4%new36 –32Honda CR-V5450.7%– 5.9%311,4990.7%– 12.8%303633Suzuki Baleno4660.6%+ 42.9%1215580.3%– 5.1%454434Suzuki Alpha4610.6%new377510.3%new38 –35Hyundai Creta4490.6%– 60.4%232,2891.1%– 30.0%282936Daihatsu Rocky3840.5%– 33.3%418180.4%– 51.0%373537Suzuki Jimny3540.5%+ 289.0%386490.3%+ 141.3%426438Hyundai Palisade3440.5%– 9.0%575110.2%– 32.3%474539Suzuki S-Presso3310.4%– 42.3%351,0190.5%+ 26.4%333840Wuling Alvez2780.4%– 76.1%474760.2%– 63.7%493241Wuling Almaz2700.4%+ 16.9%524440.2%– 14.9%504942Wuling Confero S2690.4%– 71.8%623590.2%– 72.1%563343Suzuki APV Minibus2480.3%+ 0.0%426780.3%+ 7.1%414044MG 42460.3%new563610.2%new5513945Wuling Air2290.3%– 45.6%336860.3%+ 27.0%403446Wuling Formo2150.3%+ 551.5%832460.1%– 70.1%614847Daihatsu Luxio2020.3%– 55.5%435970.3%– 43.3%434248Lexus LM1860.2%+ 785.7%513740.2%+ 1338.5%547449Suzuki Grand Vitara1860.2%new445530.3%new465250Toyota Voxy1780.2%+ 97.8%405900.3%+ 91.6%444651Mazda CX-31670.2%– 41.0%662380.1%– 73.3%635052Lexus RX1550.2%+ 56.6%552550.1%+ 114.3%596053Chery OMODA 51480.2%– 15.4%484950.2%+ 182.9%484354Mazda CX-51440.2%+ 396.6%463890.2%+ 332.2%535155Toyota Hiace1260.2%– 41.4%328920.4%+ 89.4%353756Honda Mobilio1200.2%– 70.2% –2410.1%– 55.5%625457Honda Civic1200.2%+ 0.8%532790.1%– 9.4%585858Toyota Alphard1130.2%– 77.7%297470.3%– 26.5%393959Honda City1060.1%– 64.3%593050.1%– 62.9%574160Mercedes C-Class1030.1%– 3.7%801510.1%– 34.6%726561Mazda31000.1%+ 2400.0%611970.1%+ 1690.9%667062BMW X5940.1%+ 54.1%691530.1%+ 8.5%697163Hyundai Ioniq 5930.1%– 84.3%733950.2%– 62.0%523164Hyundai Santa Fe880.1%+ 41.9%821580.1%– 45.7%686265Kia Carens860.1%+ 65.4% –860.0%+ 6.2%819466Mitsubishi Xforce800.1%new999000.4%new344767Suzuki Ignis790.1%– 22.5%582200.1%– 39.7%655768Kia Sonet710.1%– 11.3%542230.1%+ 81.3%646769Dongfeng Mini Truck680.1%– 21.8%492510.1%– 37.3%606670BMW 3 Series640.1%+ 0.0%751520.1%– 20.8%706871Mercedes GLE540.1%+ 315.4%641290.1%+ 126.3%739172Toyota Land Cruiser 300520.1%+ 766.7%454360.2%+ 2194.7%516173Citroen C3500.1%new681210.1%new75 –74Nissan Serena450.1%– 18.2%711170.1%– 5.6%768475Mercedes GLA380.1%+ 35.7%67840.0%– 40.0%8210576Toyota Yaris370.0%– 82.3%701510.1%– 78.2%715577Mini Cooper360.0%– 45.5%84780.0%+ 8.3%867578Nissan Magnite350.0%+ 288.9%74670.0%+ 123.3%899779MG ZS340.0%– 50.7%501880.1%+ 55.4%678780MG 5 GT330.0%+ 0.0%76840.0%– 40.0%838181Mini Countryman330.0%+ 13.8%77800.0%– 14.0%849982BMW X3320.0%– 8.6%791010.0%– 43.9%778283Nissan Livina300.0%– 72.7%78900.0%– 67.5%807284Chery GT300.0%new86790.0%new8511885Mazda CX-30280.0%+ 12.0%72630.0%– 22.2%909686Honda Accord270.0%+ 12.5%65990.0%+ 6.5%788587MG HS270.0%+ 35.0%98520.0%– 5.5%9411288BMW i7240.0%new123320.0%new10712589Kia EV9210.0%new105570.0%new9315690Daihatsu Sirion200.0%– 84.6% –200.0%– 93.5%1227891Nissan Kicks200.0%+ 53.8%95430.0%+ 7.5%9612392Mazda CX-60200.0%new101350.0%new10413193Toyota Camry190.0%– 82.7%102480.0%– 81.8%957994Mercedes GLC190.0%n/a92610.0%n/a918895BMW 2 Series170.0%– 22.7%81580.0%+ 61.1%9210096BMW X7160.0%– 33.3%114410.0%– 10.9%9813397Mini Clubman160.0%+ 100.0%85400.0%+ 400.0%9914498Mercedes A-Class160.0%+ 128.6%94420.0%– 14.3%9710699BMW X1160.0%+ 1500.0%63910.0%+ 9000.0%7993100Toyota Vios150.0%– 63.4%117310.0%– 80.4%10876101Toyota Corolla150.0%– 62.5%108260.0%– 85.3%11677102Toyota Vellfire150.0%– 46.4%60750.0%– 1.3%87104103Nissan Terra150.0%n/a90300.0%n/a110130104Hyundai Staria120.0%– 42.9%97300.0%– 38.8%111121105Dongfeng Gelora110.0%– 57.7%96340.0%– 51.4%10595106BMW Z4110.0%+ 450.0% –150.0%+ 650.0%129140107BMW 7 Series110.0%+ 1000.0%89380.0%+ 1166.7%102122108VW Tiguan100.0%– 68.8%104270.0%– 69.7%114110109Lexus LX100.0%+ 42.9%88300.0%+ 172.7%109126110Neta V100.0%new87690.0%new88113111Mercedes E-Class90.0%– 85.7%145150.0%– 90.7%12880112Mazda CX-990.0%– 81.3%130160.0%– 76.8%126119113BMW IX90.0%– 69.0%113360.0%+ 24.1%10369114Subaru WRX90.0%– 57.1%112200.0%– 4.8%121129115Toyota GR 8690.0%– 18.2% –190.0%+ 11.8%123132116Seres E50290.0%new128390.0%new101135117Subaru Crosstrek90.0%n/a111260.0%n/a117117118BMW i490.0%new139100.0%new135150119Subaru Forester80.0%n/a120220.0%+ 120.0%119157120Subaru Outback80.0%n/a149180.0%n/a125158121Chery Tiggo 5X80.0%new –80.0%new141 –122Mercedes S-Class70.0%– 75.9%147100.0%– 87.8%136115123BMW X670.0%n/a140110.0%n/a134161124Mercedes CLE70.0%new –70.0%new146 –125Subaru BRZ60.0%– 75.0%107260.0%– 67.9%115116126Toyota Corolla Cross50.0%– 96.4%103180.0%– 95.6%12459127Chery Tiggo 7 Pro50.0%– 85.7%100300.0%– 73.0%11286128Mazda250.0%– 83.9%91270.0%– 64.5%113109129Chery Tiggo 8 Pro40.0%– 91.3%109400.0%– 75.0%10073130Mercedes EQS40.0%– 60.0%13170.0%– 46.2%145149131Mercedes V-Class40.0%– 55.6%148100.0%– 47.4%137151132Mercedes Sprinter40.0%n/a115110.0%n/a131155133BMW IX140.0%new –40.0%new154 –134Mazda630.0%– 93.6%12790.0%– 82.0%138128135Peugeot 500830.0%– 82.4%110150.0%– 48.3%127147136BMW X430.0%+ 50.0% –40.0%+ 100.0%153148137Toyota Land Cruiser 7030.0%+ 200.0%119340.0%+ 385.7%106120138Mitsubishi L100 EV30.0%new13350.0%new148 –139Wuling Cortez20.0%– 99.0%931250.1%– 60.8%7463140BMW 5 Series20.0%– 96.8%129110.0%– 90.8%13390141VW T-Cross20.0%+ 0.0%12270.0%– 22.2%143154142Mazda CX-820.0%+ 100.0%106230.0%– 41.0%118102143Nissan Leaf20.0%+ 100.0%13440.0%– 84.6%151145144Mercedes EQE20.0%new14630.0%new155153145Mercedes EQS SUV20.0%new –20.0%new164175146Lexus NX10.0%– 88.9%143210.0%– 4.5%120103147BMW 8 Series10.0%– 50.0% –10.0%– 50.0%172166148Tata Intra10.0%+ 0.0% –10.0%– 66.7%176182149Hyundai Ioniq 610.0%new124110.0%new132101150Mazda MX-510.0%n/a12670.0%+ 75.0%144146151Audi Q810.0%n/a13720.0%+ 100.0%159174152Audi A510.0%n/a –20.0%– 33.3%160179153Lexus LC10.0%n/a –10.0%n/a173187154Mercedes GLE Coupe10.0%n/a –10.0%+ 0.0%174152155Mercedes SL10.0%n/a –10.0%n/a175167
Source: Gaikindo

