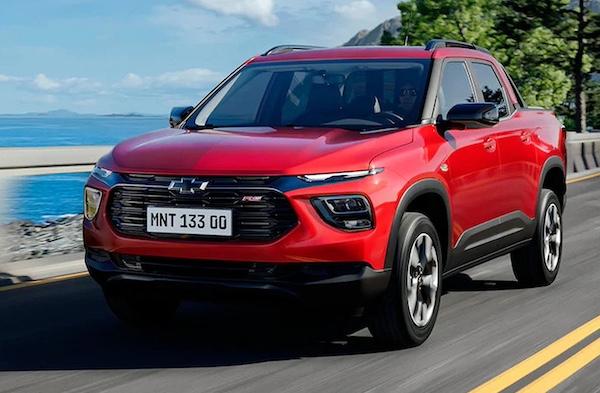
Uruguay February 2024: Chevrolet (+202.6%) ultra dominant in surging market
Chevrolet sales triple year-on-year in February.
New light vehicle sales in Uruguay surge 31.8% year-on-year in February to 4,813 units. This brings the year-to-date tally up 18.9% to 8,850. Chevrolet (+202.6%) triples its sales year-on-year to hold 21.6% of the market, its 2nd highest share in the past 6 years below the 21.9% it reached last September. Fiat (+9.3%) is bumped down to #2 both for the month and year-to-date. Suzuki (+35.9%) advances two spots on January to #3, distancing Hyundai (+149.3%) also in outstanding shape. Volkswagen (-25.1%) is hit hard but stays #3 year-to-date. Nissan (+39.5%) and Toyota (+9.2%) are the only remaining Top 10 members in positive, just as Citroen (-26.3%), Peugeot (-9.5%) and Renault (-4.7%) all underperform. Below, BYD (+212.2%), Victory (+114.8%), Dongfeng (+178.9%) and Honda (+193.8%) excel.
Previous month: Uruguay January 2024: Fiat up 7-fold to 19.1% share
One year ago: Uruguay February 2023: Fiat (+500%) soars to #1 spot, registrations up 6.3%
Full February 2024 Top 47 All brands ranking below.
Uruguay February 2024 – brands:
PosBrandFeb-24%/23Jan2024%/23PosFY231Chevrolet1,03821.6%+ 202.6%21,65518.7%+ 57.9%112Fiat57712.0%+ 9.3%11,35015.3%+ 113.6%223Suzuki3677.6%+ 35.9%56297.1%– 23.3%534Hyundai3547.4%+ 149.3%46507.3%+ 84.7%465Volkswagen3316.9%– 25.1%37078.0%– 19.6%346Nissan3256.8%+ 39.5%104535.1%+ 61.8%797Renault3226.7%– 4.7%65626.4%– 11.2%658Citroen2505.2%– 26.3%94104.6%– 34.0%989Peugeot2204.6%– 9.5%74304.9%– 9.1%8710Toyota1903.9%+ 9.2%83744.2%+ 22.2%101011BYD1533.2%+ 212.2%112432.7%+ 105.9%111112Chery811.7%+ 37.3%121611.8%+ 43.8%121213Jetour621.3%– 15.1%141241.4%– 18.4%131314Victory581.2%+ 114.8%21901.0%+ 28.6%151715DongFeng (incl. DFSK)531.1%+ 178.9%131221.4%+ 197.6%141916Honda471.0%+ 193.8%17881.0%+ 203.4%172017Ford440.9%+ 4.8%16881.0%+ 4.8%161418Karry360.7%+ 33.3%23650.7%+ 0.0%212519BMW350.7%+ 0.0%15790.9%+ 11.3%181520Changan350.7%– 22.2%18760.9%– 23.2%191821Mercedes300.6%– 21.1%22610.7%– 11.6%221622Geely270.6%+ 50.0%19650.7%+ 25.0%202423Subaru240.5%n/a28350.4%+ 483.3%273124Audi220.5%+ 15.8%27450.5%+ 28.6%242625Jeep210.4%– 12.5%20550.6%+ 66.7%232126GWM200.4%+ 233.3%24440.5%– 51.6%252227Mazda200.4%+ 81.8% –200.2%+ 81.8%293028JAC160.3%– 33.3%25400.5%– 57.9%262329Ram90.2%+ 800.0%30170.2%+ 750.0%304630Maxus70.1%+ 40.0%32120.1%+ 33.3%323231Mini70.1%+ 16.7%4080.1%– 27.3%353332Mitsubishi60.1%– 25.0%29140.2%– 63.2%312733Volvo60.1%– 40.0%31110.1%– 26.7%332934Seat60.1%+ 500.0%3690.1%+ 350.0%344735MG30.1%n/a26270.3%n/a28 –36Kia20.0%– 33.3%3360.1%– 64.7%362837JMC20.0%– 60.0%3550.1%– 37.5%373738Leapmotor20.0%n/a –20.0%– 77.8%455239Land Rover10.0%+ 0.0%4120.0%– 33.3%424040Iveco10.0%+ 0.0%4220.0%+ 100.0%434441Opel10.0%– 75.0%4320.0%– 71.4%443542Haval10.0%– 50.0% –10.0%– 80.0%463843Maserati10.0%n/a –10.0%+ 0.0%475144XEV00.0%– 100.0%3430.0%– 83.3%383445Foton00.0%n/a3730.0%+ 0.0%394146Hozon00.0%n/a3820.0%+ 100.0%404947Bestune00.0%– 100.0%3920.0%– 60.0%4143
Source: Autodata


