New Zealand February 2024: Nissan, GWM shine in market up 1.5%
GWM ranks #11 brand in New Zealand in February.
Like in January, new vehicle sales in New Zealand edge up 1.5% to reach 9,663 units. This is a poor result given February 2023 was down -24% on the year prior. The year-to-date tally is also up 1.5% To 22,295. Passenger Cars have a horrible month at -66.7% year-on-year to just 1,091 sales, while SUVs are up 5.2% to 4,842 and Light Commercials up 14.7% to 3,060. Light Passenger Cars (PC+SUV) are at their lowest February in 11 years. Year-to-date, Passenger Cars are off -33.9% to 2,451, SUVs down -1.6% to 11,557 and Light Commercials up 27.6% to 6,856.
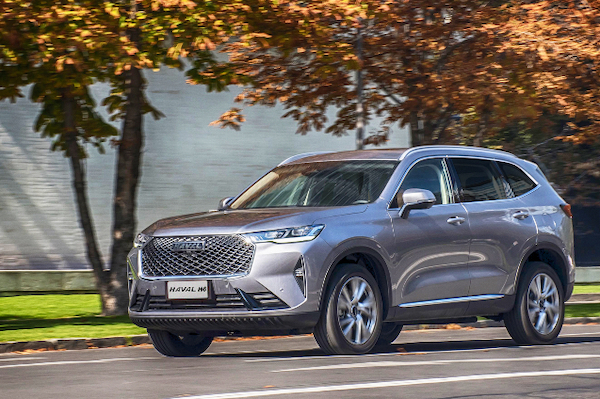
The top 3 brands all vastly beat the market with double-digit year-on-year gains. Toyota (+19.8%) leads the way with 20.9% share above Ford (+23.7%) at 15.2% and Mitsubishi (+43.6%) at 10.5%. Suzuki (-37.5%) is in a rut at #4 unlike Nissan (+78.5%) and Kia (+6.8%). Volkswagen (+14.8%) also shines at #9 but Hyundai (-62.6%), Mazda (-8.4%) and Honda (-4.3%) are in reverse. Outstanding performance of GWM (+845.8%) at #11 vs. #25 over the Full Year 2023.
Over in the models lane, the Ford Ranger (+11.3%) stays on top with 9.9% share above the Toyota Hilux (-18.5%) and RAV4 (+132.3%) in an unchanged podium. The Mitsubishi Triton (+90%) makes it three pickup trucks in the Top 4 while the Suzuki Swift (-53.4%) rallies back five spots on last month to #5 but flounders year-on-year. The Ford Everest (+98.2%) lodges another excellent month at #6 and #7 year-to-date vs. #19 over the Full Year 2023. The Nissan Navara (+100.9%) doubles its sales year-on-year to land at #7. The Kia Sportage (+60.8%) climbs back up to #11 and the Tesla Model Y to #13.
Previous month: New Zealand January 2024: Ford at highest in over a decade, Ranger up to record share
One year ago: New Zealand February 2023: Suzuki (+42%) stuns in worst February in 9 years (-24%)
Full February 2024 Top 75 All brands and Top 28 models below.
New Zealand February 2024 – brands:
PosBrandFeb-24%/23Jan2024%/23PosFY231Toyota2,02320.9%+ 19.8%14,60920.7%+ 9.3%112Ford 1,46815.2%+ 23.7%23,51415.8%+ 46.4%223Mitsubishi1,01710.5%+ 43.6%32,48911.2%+ 24.1%334Suzuki4795.0%– 37.5%51,0274.6%– 23.6%565Nissan4414.6%+ 78.5%69874.4%+ 62.9%696Kia4234.4%+ 6.8%41,2495.6%– 34.2%447Honda3103.2%– 4.3%116583.0%– 2.1%7138Mazda3063.2%– 8.4%106552.9%+ 1.7%8109Volkswagen2873.0%+ 14.8%96442.9%+ 21.7%91110Hyundai2292.4%– 62.6%76022.7%– 52.0%10511GWM2272.3%+ 845.8%125732.6%+ 1173.3%122512MG2232.3%– 29.0%144191.9%– 43.3%13713Isuzu2212.3%– 0.9%85832.6%+ 45.0%111514Mercedes1942.0%+ 14.1%153731.7%+ 1.1%141415Tesla1521.6%– 9.5%421790.8%– 50.1%21816Subaru1261.3%– 34.0%133451.5%– 28.9%151617Lexus1171.2%+ 165.9%192281.0%+ 103.6%172118Land Rover1111.1%– 2.6%202181.0%– 8.8%182319Skoda1111.1%– 30.2%231880.8%– 30.9%201820BMW981.0%– 29.0%162581.2%– 12.2%161921Audi961.0%– 20.7%182141.0%– 3.6%192022Fuso921.0%– 12.4%271430.6%– 24.7%232223LDV650.7%– 51.1%221420.6%– 39.6%242424Peugeot560.6%– 42.9%241280.6%– 38.2%262625Mahindra540.6%+ 980.0%281040.5%+ 550.0%284226Scania520.5%– 1.9%251170.5%+ 25.8%273027Iveco510.5%+ 41.7%31980.4%+ 53.1%293128Porsche470.5%– 14.5%211420.6%+ 22.4%253629Mini450.5%– 6.3%26980.4%– 11.7%302730Fiat430.4%+ 16.2%171730.8%+ 170.3%222931Hino380.4%– 41.5%30850.4%– 30.9%312832BYD370.4%– 74.1%34770.3%– 79.6%331233CRRC350.4%n/a63370.2%n/a435834Chevrolet330.3%+ 120.0%32790.4%+ 75.6%324535Volvo Trucks330.3%+ 10.0%33750.3%+ 25.0%344136Cupra290.3%– 19.4%35690.3%– 9.2%353737DAF280.3%+ 33.3%37660.3%+ 69.2%364438Kenworth270.3%+ 107.7%39640.3%+ 120.7%384639Volvo250.3%– 26.5%41580.3%– 31.8%403240Ram200.2%– 9.1%36600.3%+ 27.7%394341Jaguar200.2%+ 17.6%44350.2%– 18.6%454842Renault190.2%– 56.8%38570.3%– 29.6%413943Jeep180.2%– 14.3%43370.2%– 21.3%443444SsangYong160.2%– 40.7%29660.3%– 12.0%373545Foton130.1%+ 116.7%47230.1%+ 15.0%464946UD Trucks120.1%– 29.4%40450.2%+ 32.4%424047Haval100.1%– 93.4%45220.1%– 93.2%471748Polestar80.1%+ 33.3%6990.0%– 43.8%533349Ineos70.1%new49160.1%new495250Citroen60.1%– 45.5%46170.1%– 51.4%484751Sinotruk50.1%n/a6280.0%+ 166.7%566552Aston Martin50.1%– 16.7%6660.0%– 45.5%595653Maserati40.0%+ 300.0%50130.1%+ 160.0%505354MAN40.0%– 76.5%51120.1%– 66.7%515055International40.0%+ 300.0%5780.0%+ 700.0%556456Alfa Romeo40.0%– 50.0%5870.0%– 22.2%575157Can-Am30.0%+ 0.0%5280.0%+ 33.3%545958Bentley30.0%+ 200.0%5570.0%– 50.0%585559Mack30.0%– 25.0%6450.0%+ 0.0%635760Liebherr30.0%+ 200.0% –30.0%+ 200.0%707161Ferrari20.0%+ 0.0%5660.0%– 25.0%616062Rolls-Royce20.0%+ 0.0%6150.0%+ 25.0%646763Freightliner20.0%+ 100.0%6730.0%+ 0.0%676964McLaren20.0%+ 100.0%6830.0%+ 0.0%687365Yamaha20.0%n/a7030.0%+ 200.0%696266BCI20.0%+ 100.0% –20.0%+ 100.0%717067JAC20.0%n/a –20.0%n/a72 –68Zhongtong20.0%n/a –20.0%n/a73 –69Dennis Eagle10.0%n/a5460.0%n/a60 –70Lotus10.0%n/a5940.0%+ 100.0%656171Opel10.0%– 96.8%6040.0%– 93.2%663872Shacman10.0%new –10.0%new75 –73Yutong00.0%n/a48100.0%n/a52 –74Lamborghini00.0%– 100.0%5350.0%+ 0.0%626375Alexander Dennis00.0%n/a6510.0%– 66.7%7468
New Zealand February 2024 – models:
PosModelFeb-24%/23Jan2024%/23PosFY231Ford Ranger 9569.9%+ 11.3%12,42710.9%+ 46.6%112Toyota Hilux6927.2%– 18.5%21,3506.1%– 18.1%233Toyota RAV44674.8%+ 132.3%31,0854.9%+ 84.8%324Mitsubishi Triton4374.5%+ 90.0%67663.4%+ 41.6%4105Suzuki Swift2272.3%– 53.4%105112.3%– 37.1%866Ford Everest2202.3%+ 98.2%85252.4%n/a7197Nissan Navara2192.3%+ 100.9%173971.8%+ 89.0%12n/a8Mitsubishi Outlander2182.3%+ 13.5%56482.9%+ 31.4%549Mitsubishi ASX1751.8%n/a46132.7%n/a6n/a10Toyota Hiace1601.7%+ 95.1%114161.9%+ 72.6%111811Kia Sportage1561.6%+ 60.8%n/a2641.2%– 11.4%20n/a12Toyota Highlander1541.6%+ 37.5%94482.0%n/a9n/a13Tesla Model Y1451.5%+ 52.6%n/an/an/an/an/a514MG ZS1441.5%– 38.5%222741.2%– 49.7%17915Mitsubishi Eclipse Cross1421.5%– 34.0%163491.6%– 45.1%15716Ford Transit1381.4%+ 89.0%212701.2%+ 59.8%19n/a17Toyota Corolla Cross1311.4%+ 95.5%133731.7%+ 42.4%131718Mazda CX-51281.3%– 17.4%192741.2%+ 7.0%182319Kia Seltos1241.3%n/a74341.9%n/a102220Isuzu D-Max1061.1%– 9.4%123521.6%+ 66.0%14n/a21Honda ZR-V1051.1%new182581.2%new22n/a22Suzuki Jimny1051.1%n/an/an/an/an/an/an/a23Nissan X-Trail1041.1%n/a202381.1%n/an/an/a24Honda CR-V991.0%– 13.2%n/an/an/an/an/an/a25GWM Haval H6981.0%+ 2.1%n/an/an/an/an/an/a26Toyota Corolla941.0%– 8.7%n/an/an/an/an/a1227VW Amarok870.9%n/a242110.9%n/an/an/a28GWM Haval Jolion830.9%n/an/an/an/an/an/an/an/aNissan Qashqai750.8%n/a152941.3%n/a16n/an/aKia Stonic280.3%– 65.9%142641.2%– 37.6%2121
Source: MIA, Autotalk


