
Austria February 2024: VW Golf repeats at #1, Seat Ibiza shoots up
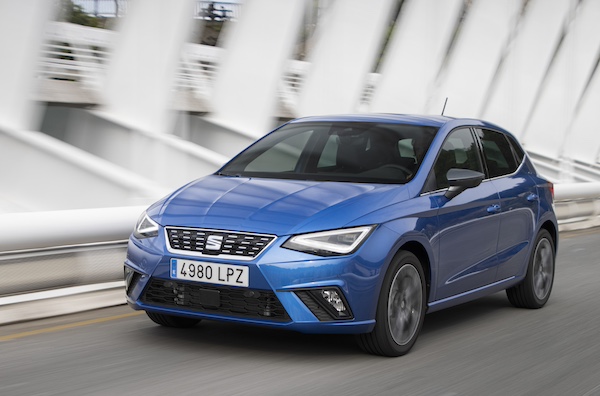
Seat Ibiza sales are up 300% year-on-year in February.
20,010 new cars found a buyer in Austria in February, a robust 11.8% year-on-year improvement. This tilts the year-to-date volume into positive territory at +2.2% to 37,562. Volkswagen (+24.7%) easily beats the market to top the brands charts again at 15.4% share. It distances Skoda (+6.1%), a little weak, BMW (+24.2%) and Seat (+57.3%) both very strong. Dacia (+10.1%) can’t quite catch up with the market growth but advances one spot on January to #5 overall. Suzuki (+151.2%) is the biggest gainer in the Top 10 with Toyota (+13.3%) also solid at #8. Tesla (+2.7%) is pushy but climbs back up 4 spots on last month to #9. Peugeot (+88.8%) and Mazda (+45.9%) also impress below.
In the modes ranking, after waiting almost 3 years to sport the pole position last month, the VW Golf (+98.1%) doubles its sales year-on-year to repeat at #1 with 4.7% share. The Skoda Octavia (+64.3%) is not far behind however. The Seat Ibiza (+300%) surges year-on-year to remain in third place vs. #12 over the Full Year 2023. The Tesla Model Y (+8.5%) lodges a modest lift to #4 overall, distancing the Dacia Duster (+86.2%) and Sandero (-13.4%). The VW Polo (+162.6%), VW Bus (+67.8%) and BMW X1 (+62.2%) also shine in the remainder of the Top 10.
Previous month: Austria January 2024: VW Golf signs first win in almost 3 years
One year ago: Austria February 2023: Dacia impresses, Tesla Model Y tops market up 11.1%
Full February 2024 Top 53 All brands and Top 20 models below.
Austria February 2024 – brands:
PosBrandFeb-24%/23Jan2024%/23PosFY231Volkswagen3,07415.4%+ 24.7%15,42914.5%– 3.1%112Skoda1,7688.8%+ 6.1%23,82410.2%+ 4.0%223BMW1,4067.0%+ 24.2%32,9677.9%+ 24.5%334Seat1,3296.6%+ 57.3%52,3986.4%– 7.3%575Dacia1,0015.0%+ 10.1%61,9195.1%+ 23.5%696Audi9724.9%– 18.7%42,4246.5%– 0.8%447Mercedes9594.8%– 10.5%81,7454.6%– 14.9%768Toyota8764.4%+ 13.3%71,6944.5%+ 2.4%889Tesla8764.4%+ 2.7%131,2673.4%+ 3.3%101310Suzuki7563.8%+ 151.2%101,2963.5%+ 114.6%91811Mazda6613.3%+ 45.9%141,0492.8%+ 21.3%121512Peugeot6573.3%+ 88.8%151,0392.8%+ 26.4%131713Hyundai5182.6%+ 5.3%207772.1%– 15.7%17514Ford5152.6%– 34.1%129732.6%– 35.3%141215Renault4952.5%– 33.5%168292.2%– 38.3%151116Kia4912.5%– 26.2%91,0702.8%– 15.7%111017Citroen3621.8%+ 2.0%225721.5%– 14.8%212018Mitsubishi3611.8%+ 127.0%176921.8%+ 146.3%182419Volvo3351.7%+ 12.0%186461.7%+ 12.3%192120Nissan3311.7%+ 90.2%235281.4%+ 48.7%222221Opel3221.6%– 28.1%196151.6%– 24.4%201622MG3141.6%+ 89.2%244801.3%+ 25.7%242323Cupra3061.5%– 36.9%117902.1%– 22.8%161424Fiat2601.3%– 37.8%214951.3%– 26.4%231925BYD2241.1%+ 1217.6%253811.0%+ 1170.0%253026Porsche1450.7%+ 61.1%292380.6%+ 6.3%272627Mini1320.7%– 14.3%262870.8%+ 5.9%262528Honda1210.6%+ 105.1%321750.5%+ 78.6%303129Land Rover1040.5%+ 55.2%272170.6%+ 48.6%282830Jeep850.4%+ 44.1%281790.5%+ 42.1%292731Alfa Romeo760.4%– 28.3%301410.4%– 43.4%312932Smart360.2%+ 620.0%31940.3%+ 1075.0%323933Polestar280.1%– 20.0%35570.2%– 34.5%353234Lexus250.1%+ 127.3%34580.2%+ 93.3%343635DS180.1%– 18.2%36450.1%+ 0.0%363536Fisker170.1%new33610.2%new333737Subaru130.1%– 58.1%37300.1%– 47.4%373338SsangYong110.1%+ 450.0%39150.0%+ 650.0%394039Jaguar100.0%– 61.5%38180.0%– 66.0%383440Ferrari100.0%+ 233.3%42130.0%+ 85.7%403841Aston Martin50.0%n/a4080.0%+ 166.7%414442Maserati30.0%n/a5240.0%– 33.3%444143BAIC20.0%new4830.0%new455044Chrysler 10.0%– 50.0%4140.0%+ 33.3%424945Ineos10.0%new4340.0%new434246Lamborghini10.0%– 50.0%4430.0%– 25.0%464347MAN10.0%– 50.0%4630.0%– 25.0%474848McLaren10.0%n/a4730.0%n/a484649Chevrolet10.0%n/a4920.0%+ 100.0%494750Skywell10.0%n/a5520.0%n/a515351Bentley10.0%– 50.0% –10.0%– 66.7%564552Caterham10.0%+ 0.0% –10.0%+ 0.0%575653Cadillac10.0%n/a –10.0%n/a58 –
Austria February 2024 – models:
PosModelFeb-24%/23Jan2024%/23PosFY231VW Golf9334.7%+ 98.1%11,5954.2%+ 76.6%132Skoda Octavia8924.5%+ 64.3%21,5194.0%+ 50.7%213Seat Ibiza7683.8%+ 300.0%31,1963.2%+ 105.1%3124Tesla Model Y6803.4%+ 8.5%69842.6%+ 9.1%425Dacia Duster4192.1%+ 86.2%47622.0%+ 50.3%5176Dacia Sandero3541.8%– 13.4%56901.8%+ 5.7%667BMW X13181.6%+ 62.2%95771.5%+ 33.3%758VW Bus2971.5%+ 67.8%105561.5%+ 72.7%8149VW Tiguan2621.3%– 18.4%134941.3%– 21.2%12710VW Polo2601.3%+ 162.6%115101.4%– 25.8%111911Toyota Yaris/Cross2511.3%– 24.2%85541.5%– 19.8%9412VW T-Cross2451.2%+ 47.6%n/an/an/an/an/an/a13Hyundai Tucson2431.2%n/an/an/an/an/an/a1114VW Caddy2401.2%– 23.8%n/an/an/an/an/a1315Toyota C-HR2341.2%+ 143.8%n/an/an/an/an/an/a16Suzuki S-Cross2241.1%+ 180.0%n/a3881.0%+ 115.6%19n/a17Dacia Jogger2131.1%– 2.7%n/a4041.1%+ 38.4%16n/a18Skoda Karoq2111.1%– 13.5%75141.4%– 15.7%101019Peugeot 2082101.0%+ 250.0%n/an/an/an/an/an/a20Skoda Fabia2081.0%– 8.0%124571.2%– 23.1%1316n/aBMW X32011.0%– 19.3%164261.1%– 15.5%1418n/aBMW i41951.0%+ 160.0%194091.1%+ 235.2%15n/an/aSeat Arona1860.9%– 15.8%174021.1%– 47.7%1720n/aMitsubishi Space Starn/an/an/an/a3911.0%+ 87.1%18n/an/aVW Passatn/an/an/an/a3731.0%+ 38.7%20n/a
Source: Statistik Austria
More Stories
Reasons The Audi Concept C Marks An Exciting New Era For Electric Sports Cars
Audi has taken a confident step back into the spotlight. The Concept C is not another cautious design study or...
Lexus ES by Modellista Gets Modest Exterior Tweaks
Even if Lexus is considered the luxury arm of Toyota, the company tried to invest money and dedication into creating...
The 2027 Chevy Silverado Leaks Early, and It Feels Exactly Like That Kind of Update
I wasn’t really expecting to see the 2027 Chevy Silverado this way, but here we are. Leaked images tend to...
The ‘Always Ready’ Angel BS200 Super Starter
Today I’m bringing you an exclusive review for My Car Heaven. If you’ve ever faced the frustration of a car...
BSCB needs your help!
BSCB needs your help today. In particular for two markets whose data source has gone silent in recent months: the...
Explore: The cars of Morocco
Dacia Logan taxi in Chefchaouen, Morocco In December and January I was lucky enough to visit Fès and Chefchaouen in...