USA February 2024: Honda (+37.8%), Lincoln (+38%) stand out in market up 6.3%
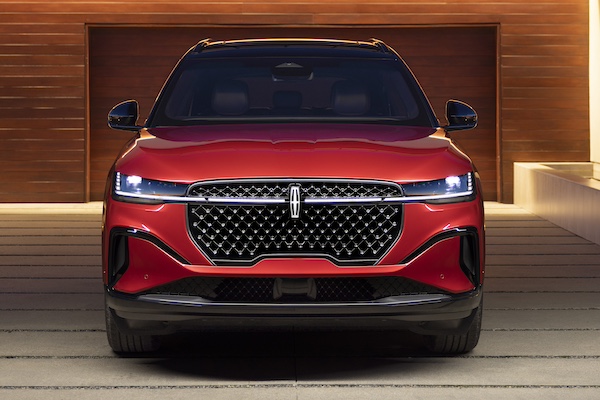
Lincoln Nautilus sales are up 95.7% year-on-year in February.
According to NADA, the U.S. new light vehicle market is up 6.3% year-on-year in February on an annualised basis with a SAAR of 15.81 million units. It’s up 3.9% on January which was a 10-month low at 15.2 million. The year-to-date SAAR is up 2.7% to 15.39 million. Cars are up 6.5% to 3.13 million annualised, light tricks up 6.3% to 12.68 million, domestic light vehicles are up 4.4% to 12.32 million and imports up 13.3% to 3.49 million. Year-to-date, crossovers account for 49.9% of the market vs. 46.7% a year ago and pickups are at 16.2% share. More generous incentives partly explain this relatively strong result. Based on data shared by J.D. Power, average incentives per vehicle shoot up 75.3% year-on-year to $2,565, the highest amount since May 2021. As a result the average transaction price is down $1,919 year-on-year to $44,045.
Among groups still sharing monthly data, Toyota Motor is up 16.2%, Ford Motor up 10.7%, Hyundai-Kia is timid at +1.6% and American Honda surges 32.3%. Brand-wise, Ford (+9.6%) outsells Toyota (+16%) while Honda (+37.8%) is just above 100,000 units. Lexus (+17.4%) and Lincoln (+38%) post very satisfying results just as Genesis (+9.4%) also tops the market growth. Mazda (+6.7%), Hyundai (+5.8%) and Subaru (+3.1%) are more discreet whereas Volvo (-7.5%), Acura (-6.1%) and Kia (-3%) disappoint.
Looking at models with available monthly volume, the Ford F-Series (-5%) is in difficulty, with year-to-date sales down -8.6%. In contrast the Toyota RAV4 (+43.9%) and Honda CR-V (+98.6%) both post fantastic gains. The Toyota Camry (+7%) still manages an uptick but the Honda Civic (+36.6%) and Toyota Corolla (+22.3%) are catching up. Notice also the Ford Escape (+105.2%), Edge (+105.2%), Toyota 4Runner (+92.9%), Ford Maverick (+73.4%) and Subaru Forester (+48.4%) all in great shape.
Previous month: USA January 2024: Market edges up 4.5%, Toyota up 25.7%
One year ago: USA February 2023: Ford, Kia, Volvo shine in market up 8.7%
Full February 2024 data for selected groups, brands and models below.
Note: Only the companies still sharing monthly data are represented here. Quarterly updates feature all companies.
USA February 2024 – groups:
GroupFeb-24/232024/23Toyota Motor Corporation184,450+ 16.2%350,203+ 19.5%Ford Motor Co173,065+ 10.7%324,945+ 7.8%Hyundai-Kia124,005+ 1.6%226,908– 1.3%American Honda110,110+ 32.3%203,320+ 21.2%Subaru47,189+ 3.1%91,699+ 1.7%Mazda32,705+ 6.7%62,984+ 17.5%Volvo Cars7,920– 7.5%17,506+ 7.7%
USA February 2024 – brands:
BrandFeb-24/232024/23Ford164,566+ 9.6%309,461+ 6.9%Toyota159,262+ 16.0%302,503+ 20.4%Honda100,341+ 37.8%184,915+ 25.1%Hyundai60,341+ 5.8%107,884– 1.1%Kia59,059– 3.0%110,150– 2.4%Subaru47,189+ 3.1%91,699+ 1.7%Mazda32,705+ 6.7%62,984+ 17.5%Lexus25,188+ 17.4%47,700+ 13.9%Acura9,769– 6.1%18,405– 7.5%Lincoln8,499+ 38.0%15,484+ 29.4%Volvo7,920– 7.5%17,506+ 104.5%Genesis4,605+ 9.4%8,874+ 9.4%
USA February 2024 – models:
ModelFeb-24/232024/23Ford F-Series51,829– 5.8%100,531– 8.6%Toyota RAV443,209+ 43.9%79,482+ 48.7%Honda CR-V32,031+ 98.6%58,383+ 61.5%Toyota Camry25,952+ 7.0%48,013+ 17.0%Honda Civic20,228+ 36.6%36,677+ 30.4%Toyota Corolla20,054+ 22.3%37,743+ 28.2%Ford Explorer19,611+ 2.3%38,446+ 10.5%Hyundai Tucson15,999+ 14.0%27,115+ 4.1%Subaru Forester14,882+ 48.4%27,501+ 36.5%Honda Accord 14,117+ 22.7%26,142– 0.4%Ford Transit13,410+ 19.6%27,601+ 29.4%Ford Edge13,363+ 105.2%20,765+ 80.8%Ford Maverick13,262+ 73.4%25,705+ 84.7%Ford Escape13,227+ 105.2%24,116+ 68.3%Subaru Crosstrek12,553– 15.3%23,878– 13.2%Honda HR-V12,116+ 44.7%24,072+ 46.9%Kia Sportage12,081+ 19.4%22,075+ 17.9%Toyota Tundra11,247+ 9.0%20,878+ 24.3%Kia Forte11,229+ 7.5%20,206+ 8.4%Toyota 4Runner10,963+ 92.9%21,067+ 54.6%Ford Bronco Sport10,707+ 20.2%20,528+ 11.9%Toyota Highlander10,491– 44.3%20,495– 38.1%Subaru Outback10,412+ 14.3%21,712+ 11.2%Mazda CX-510,362– 15.6%20,556– 7.0%Mazda CX-3010,026+ 24.9%17,799+ 36.0%Honda Pilot9,684+ 33.2%17,371+ 22.2%Hyundai Santa Fe9,239+ 15.6%15,260– 0.2%Lexus RX8,858+ 2.5%15,874– 4.4%Kia Telluride8,510– 5.7%15,426– 7.1%Toyota Grand Highlander8,478new15,059newHyundai Elantra8,432– 18.7%15,332– 19.4%Ford Expedition8,379+ 21.5%13,845+ 10.0%Ford Bronco8,186– 32.4%15,613– 29.9%Hyundai Palisade7,832+ 16.2%15,470+ 15.2%Kia Sorento7,425+ 5.9%13,445+ 1.2%Hyundai Kona7,024+ 15.5%13,601+ 14.2%Toyota Sienna5,731+ 108.8%10,869+ 107.0%Toyota Corolla Cross5,672+ 8.2%11,247+ 32.0%Honda Odyssey5,590– 10.7%10,146– 14.5%Mazda CX-505,480+ 73.1%11,213+ 94.9%Lexus NX5,316+ 14.0%10,395+ 6.6%Toyota Tacoma5,045– 70.4%13,248– 62.0%Kia Seltos4,766+ 27.3%8,766+ 13.3%Toyota Prius4,528+ 424.1%9,235+ 175.7%Hyundai Sonata4,379+ 1.7%7,500– 18.3%Ford Mustang4,115– 17.0%7,886– 12.0%Honda Ridgeline3,979– 14.4%7,329– 6.2%Kia Soul3,897– 25.5%7,168– 28.9%Subaru Ascent3,791– 14.0%7,509– 16.5%Acura MDX3,650– 22.2%6,761– 26.1%Ford E-Series3,543+ 0.8%6,623+ 4.1%Lexus TX3,396new6,307newLincoln Nautilus3,396+ 95.7%5,430+ 62.4%Mazda CX-903,321+ 16505.0%6,631+ 33055.0%Acura RDX3,215+ 53.8%5,992+ 52.2%Kia Carnival3,074+ 25.0%6,087+ 47.7%Mazda33,063+ 7.6%5,943+ 34.4%Ford Mustang Mach E2,930+ 64.3%4,225– 4.2%Honda Passport2,596– 32.4%4,795– 32.0%Hyundai Santa Cruz2,568– 10.5%5,055– 7.8%Lexus ES2,560– 5.6%4,672– 4.9%Toyota Crown2,550+ 4296.6%4,715+ 8029.3%Volvo XC602,542– 7.2%5,499+ 4.7%Kia Niro2,511– 25.7%4,573– 35.5%Volvo XC902,468– 3.1%5,441+ 7.6%Toyota Venza2,424+ 0.2%4,613– 13.1%Subaru Impreza2,343– 9.6%4,608– 8.6%Kia K52,291– 55.5%5,579– 34.5%Acura Integra2,079– 16.9%3,944– 16.0%Ford Transit Connect2,004+ 37.4%3,274+ 24.8%Hyundai Ioniq 51,996– 3.8%3,461– 4.4%Lincoln Corsair1,984+ 45.8%4,040+ 35.7%Toyota Sequoia1,976+ 46.9%3,704+ 43.8%Hyundai Venue1,959– 22.8%3,394– 31.8%Lincoln Aviator1,926+ 5.8%3,785+ 26.4%Genesis GV701,906+ 8.2%3,491+ 10.4%Volvo XC401,627– 25.3%3,723– 2.5%Lexus IS1,528– 8.4%2,780– 16.5%Genesis GV801,420+ 14.4%2,498+ 2.0%Subaru WRX1,395– 46.3%2,567– 44.2%Lexus GX1,349– 25.2%3,275– 16.0%Kia EV91,318new2,726newKia EV61,309+ 1.2%2,522+ 4.9%Subaru Legacy1,248– 18.2%2,740– 2.0%Lincoln Navigator1,193– 3.9%2,229– 15.9%Hyundai Ioniq 6902new1,662newVolvo S60847+ 82.9%1,681+ 104.8%Acura TLX825– 26.4%1,708– 19.1%Lexus UX793– 26.2%1,523– 21.6%Genesis G70686– 4.6%1,672+ 9.8%Kia Rio648– 72.8%1,577– 65.5%Toyota bZ4X557+ 9.4%1,070+ 10.7%Lexus LX523+ 17.8%1,138+ 89.7%Mazda MX-5 Miata436– 44.3%825– 45.3%Lexus RZ352new745newGenesis G80346+ 69.6%598+ 29.2%Subaru Solterra322– 7.2%701– 17.1%Subaru BRZ243– 34.0%493– 29.6%Lexus LS224+ 34.9%436+ 27.5%Volvo V60210+ 50.0%414+ 35.7%Toyota GR86203– 65.7%677– 34.5%Lexus RC148+ 15.6%265+ 6.9%Genesis GV60147– 14.0%313+ 4.3%Lexus LC141– 7.2%290+ 9.0%Toyota Supra121– 61.8%282– 54.8%Volvo C40105– 69.2%596– 5.8%Genesis G90100– 9.9%302+ 39.8%Volvo S9098– 24.6%216– 28.5%Toyota Mirai57– 76.1%101– 78.0%Volvo V9023– 4.2%63– 1.6%Mazda CX-7016new16newHyundai Nexo11– 60.7%34– 22.7%Toyota Avalon4– 80.0%5– 84.8%Mazda CX-91– 100.0%1– 100.0%Ford Ranger0– 100.0%303– 95.6%
Source: Manufacturers


