UK February 2024: Strongest February volume in 20 years, VW Golf up to #2
The VW Golf hits its highest UK ranking in 2.5 years.
New car sales in the UK score their best February volume in 20 years, up 14% year-on-year to 84,886 vs. 91,460 in February 2004. The year-to-date cume is up 10.3% to 227,762. However this outstanding result is entirely due to fleet and business sales instead of private sales. Indeed fleet sales are up 25.2% year-on-year to 54,740 and 64.5% share vs. 58.8% last year whereas private sales actually drop -2.6% to 28,630 and 33.7% share vs. 39.5% in February 2023. Business sales are up 15.5% to 1,516. Year-to-date, the discrepancy is even more blatant with fleets up 28.1% to 145,055 and 63.7% share vs. 54.9% and private sales off -11.4% to 78,874 and 34.6% share vs. 43.1% last year. Business sales are down -7.1% to 3,833.
In February, petrol sales are up 13.3% to 48,001 and 56.6% share vs. 56.9% a year ago, diesel is down -7.4% to 4,995 and 5.9% vs. 7.3%, BEVs are up 21.8% to 14,991 and 17.7% share vs. 16.5% in February 2023, PHEVs gain 29.1% to 6,098 and 7.2% share v. 6.3% and HEV are up 12.1% to 10,801 and 12.7% share vs. 12.9%. Year-to-date, petrol is up 9.5% to 129,906 and 57% share vs. 57.4%, diesel drops -9.2% to 14,343 and 6.3% share vs. 7.7%, BEVs surge 21.3% to 35,926 and 15.8% share vs. 14.3%, PHEVs surge 30.4% to 18,042 and 7.9% share vs. 6.7% and HEVs edge up 3.3% to 29,545 and 13% share vs. 13.9 a year ago.
Source: SMMT
In the brands ranking, Volkswagen (+13.3%) keeps hold of the pole position with 9.1% share, its highest since last August (9.7%). BMW (+65.5%) shoots up year-on-year and stays in 2nd place with 7% of the market. It is the fourth month in a row that BMW ranks #2 in the UK. It is followed by Ford (-14.7%) unable to capitalise on the market growth. Audi (+11.8%) also trails the overall lift at #4 while Vauxhall (-13.2%) is in a rut but gains two spots on last month to #5. MG (+244.5%) delivers the largest gain in the Top 30 but drops two ranks on January to #10. Nissan (+28%) and Kia (+24.3%) also gain share in the remainder of the Top 10.
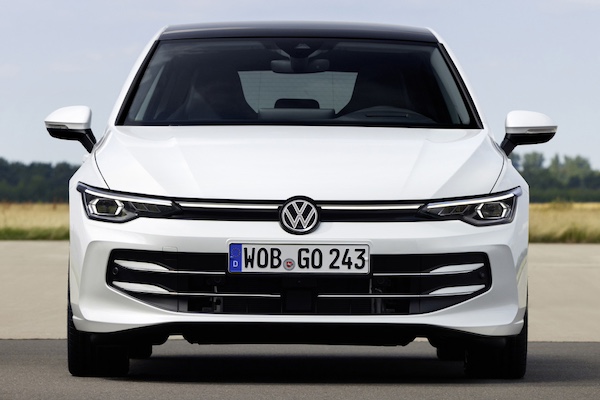
Spectacularly the Top 9 models all outrun the market. The Ford Puma (+59.4%) returns to the top spot it held over the Full Year 2023. It distances the VW Golf (+89.4%) up six spots on January to #2, its highest ranking since June 2021. The T-Roc (+46%) makes it two Volkswagens on the podium. #1 last month, the Kia Sportage (+54.4%) posts another strong result but falls three ranks to #4. The Mini (+49.6%) is also very dynamic at #5 while the BMW 1 Series (+235.5%) lodges the largest year-on-year gain in the Top 10. It is now #4 year-to-date which is higher than its monthly ranking record. The Tesla Model Y (+19.9%) makes its comeback inside the UK monthly Top 10 at #8.
Previous month: UK January 2024: Kia Sportage #1, BMW 1 Series up to record #5
One year ago: UK February 2023: Skoda (#6), Vauxhall Mokka (#2) break records in market up 26.2%
Full February 2024 Top 45 All brands and Top 10 models below.
UK February 2024 – brands:
PosBrandFeb-24%/23Jan2024%/23PosFY231Volkswagen7,7249.1%+ 13.3%119,1848.4%– 0.3%112BMW 5,9117.0%+ 65.5%216,7067.3%+ 46.8%243Ford 5,8456.9%– 14.7%415,5416.8%– 2.9%324Audi 5,1766.1%+ 11.8%514,0086.2%+ 2.6%535Vauxhall 4,7845.6%– 13.2%713,1115.8%+ 21.8%676Kia4,3995.2%+ 24.3%314,6066.4%+ 16.4%467Nissan 4,2055.0%+ 28.0%612,8445.6%+ 43.4%788Hyundai3,7194.4%– 13.9%99,9104.4%– 6.1%9109Skoda3,5384.2%– 11.2%138,4693.7%– 11.0%131210MG3,4934.1%+ 244.5%810,2044.5%+ 20.8%81111Peugeot 3,3293.9%+ 28.1%119,3624.1%+ 48.8%101312Mercedes 3,2543.8%+ 47.2%128,7493.8%+ 20.8%12913Toyota3,1963.8%– 17.8%109,3074.1%– 25.5%11514Tesla3,1923.8%+ 39.8%244,7732.1%+ 66.8%191615Seat2,3782.8%+ 42.4%185,1092.2%+ 4.1%181916Mini2,3662.8%+ 30.7%176,1102.7%+ 34.5%151717Volvo2,2162.6%+ 14.3%156,0972.7%– 2.5%161518Citroen2,1652.6%+ 18.3%204,5042.0%+ 6.6%202019Renault2,0632.4%+ 28.6%165,8812.6%+ 27.1%171820Honda1,8522.2%+ 56.6%194,2631.9%+ 21.5%212521Land Rover1,5171.8%+ 11.7%146,1962.7%+ 36.4%141422Dacia1,2451.5%– 21.6%213,3321.5%– 4.8%222223Cupra1,1831.4%+ 46.2%233,0011.3%+ 29.6%232424Suzuki1,0811.3%+ 4.4%252,6271.2%+ 4.0%252325Mazda8741.0%– 25.4%222,8391.2%– 23.7%242126Fiat7750.9%– 4.4%281,8720.8%– 27.3%272727Jaguar7380.9%+ 136.5%262,0690.9%+ 54.6%262928Porsche5280.6%– 6.9%271,7200.8%– 27.2%282629Lexus4160.5%+ 18.5%291,1050.5%– 0.4%292830Jeep3680.4%+ 63.6%308800.4%+ 57.1%303131BYD2710.3%new315190.2%new313832Polestar2590.3%– 73.8%324950.2%– 74.0%323033KGM/SsangYong1340.2%+ 139.3%372180.1%+ 35.4%353434Smart780.1%+ 1460.0%342250.1%+ 476.9%344335DS780.1%– 62.0%361860.1%– 59.5%373336Subaru650.1%+ 75.7%332580.1%+ 89.7%333237Alfa Romeo600.1%– 1.6%391330.1%– 0.7%383538Abarth590.1%+ 293.3%401290.1%+ 396.2%394139Ora560.1%+ 330.8%421120.0%+ 330.8%403940Fisker530.1%new351970.1%new364541Alpine190.0%+ 58.3%44600.0%+ 57.9%444442Bentley160.0%– 61.0%38980.0%– 39.9%413743Genesis150.0%– 76.6%41770.0%– 58.4%423644Maserati130.0%– 55.2%43650.0%– 46.3%434045Ineos80.0%new45320.0%new4542 –Other British890.1%– 9.2% –3290.1%+ 5.4% – – –Other Imports830.1%+ 62.7% –2500.1%+ 70.1% – –
UK February 2024 – models:
PosModelFeb-24%/23Jan2024%/23PosFY231Ford Puma2,5353.0%+ 59.4%26,7363.0%+ 72.5%112VW Golf2,2032.6%+ 89.4%84,6592.0%+ 84.4%6123VW T-Roc1,9862.3%+ 46.0%n/a4,1521.8%– 10.1%9204Kia Sportage1,9482.3%+ 54.4%16,1872.7%+ 68.5%245Audi A31,8352.2%+ 121.6%74,4832.0%+ 86.9%896Mini1,8282.2%+ 49.6%64,9072.2%+ 67.6%577BMW 1 Series1,8152.1%+ 235.5%55,0192.2%+ 181.1%4228Tesla Model Y1,7772.1%+ 19.9%n/an/an/an/an/a59Nissan Qashqai1,6161.9%+ 35.0%35,6242.5%+ 30.2%3210Vauxhall Mokka1,5131.8%– 16.2%n/a1,5130.7%– 56.5%1010n/aNissan Juke1,4391.7%– 7.8%93,8601.7%#VALUE!108n/aMG HS1,1551.4%+ 105.9%44,5682.0%+ 13.0%713
Source: SMMT

