France February 2024: Stellantis (+21%) shines in market up 13%
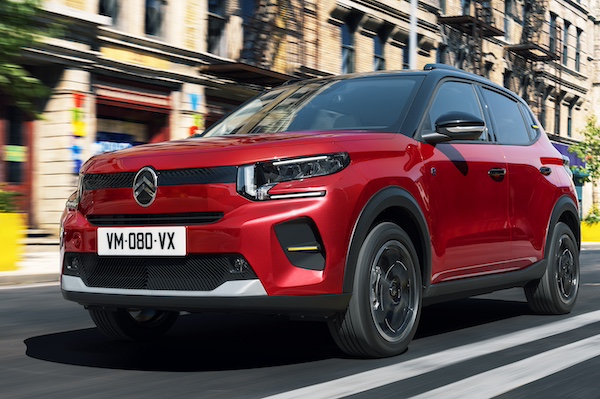
Citroen C3 sales are up 60.9% year-on-year. Next generation pictured. Copyright William Crozes @ Continental Productions
French new car sales gain 13% year-on-year in February to 142,597 units, however this is till -15% below the pre-pandemic figure of February 2020 (167,785). The year-to-date volume is up 11.2% to 264,881. Petrol sales edge up 2% year-on-year to 48,075 and 33.7% share vs. 37.3% a year ago, diesel sinks -30.5% to 10,221 and 7.2% share vs. 11.7% in February 2023, HEVs are up 41.5% to 41,244 and 28.9% share vs. 23.1% last year, PHEVs are up 18.6% to 11,738 and 8.2% share vs. 8.3% and BEVs surge 32% to 25,872 and 18.1% share vs. 15.5% a year ago.
Peugeot (+10.8%) repeats at #1 with 15.6% share, keeping Renault (+9.9%) at bay. In fact Stellantis is the big winner of the month with overall sales up 21% year-on-year thanks to great performances by Citroen (+29.7%) up to #3 overall for the first time since March 2023, Fiat (+69.8%), Opel (+24.2%), Jeep (+116.9%) and Alfa Romeo (+48.9%). After a record-breaking month in January, Dacia (-1.5%) is bumped down to #4 with 8.2% share vs. 9.7% year-to-date. Toyota (+21.7%) is also very solid at #5 and 7.1% share, staying above Volkswagen (-0.6%). BMW (+45.2%) and Kia (+22.5%) also shine in the remainder of the Top 10. Note Tesla is down -3.9%.
Over in the models ranking, the Top 4 all beat the market, with the Peugeot 208 (+37.8%) cementing its lead for the year with a strong 7% share, followed by the Renault Clio (+31.1%), Citroen C3 (+60.9%) and Dacia Sandero (+23.1%). In contrast the Peugeot 308 (-7.5%), Renault Captur (-3.6%) and Peugeot 2008 (-4.8%) underperform below. The Toyota Yaris (+31.7%) is the best-selling “foreigner” – although built locally – ahead of the Toyota Yaris Cross (+21.5%) and Fiat 500 (+33%). The Renault Austral (+15.1%) is back up eight spots on last month to #12 and the Citroen C4 (+33.8%) up 7 to #15. At #16, the Tesla Model Y is down -20.2%.
Previous month: France January 2024: Dacia smashes share record, ends the month 914 sales behind Renault
One year ago: France February 2023: Dacia, Audi, Toyota shine, Renault Austral #13, market up 9.4%
Full February 2024 Top 60 All brands and Top 75 models below.
France February 2024 – brands:
PosBrandFeb-24%/23Jan2024%/23PosFY231Peugeot 22,22215.6%+ 10.8%142,63216.1%+ 13.0%122Renault 20,30114.2%+ 9.9%235,14513.3%– 1.2%213Citroen 11,8488.3%+ 29.7%521,7508.2%+ 25.4%444Dacia 11,7278.2%– 1.5%325,6579.7%+ 9.5%335Toyota10,1187.1%+ 21.7%420,4537.7%+ 20.4%566Volkswagen8,4675.9%– 0.6%614,1905.4%– 15.4%657BMW 5,3673.8%+ 45.2%79,5193.6%+ 40.4%788Kia 4,1992.9%+ 22.5%97,9923.0%+ 16.6%9139Fiat 4,1662.9%+ 69.8%107,3712.8%+ 53.3%101510Opel 4,0592.8%+ 24.2%88,0103.0%+ 30.7%81411Ford 3,8122.7%– 4.1%116,9442.6%– 0.6%111012Mercedes 3,7712.6%+ 12.5%175,6212.1%+ 1.1%15913Audi 3,4482.4%– 6.6%146,1712.3%– 6.0%141114Hyundai3,3882.4%– 11.5%136,4412.4%– 8.5%121215Tesla3,2442.3%– 3.9%126,3622.4%+ 54.5%13716Skoda 2,7721.9%– 5.6%194,5351.7%– 12.3%171617Nissan 2,2691.6%– 22.9%154,6201.7%– 12.5%161718MG1,9821.4%+ 34.6%213,2521.2%+ 1.2%201819Suzuki1,9031.3%+ 54.3%183,7011.4%+ 54.9%192120DS1,8401.3%– 9.6%163,8231.4%– 5.3%182021Volvo1,7541.2%+ 63.0%222,9731.1%+ 37.3%222322Mini1,6921.2%– 6.3%203,1701.2%– 2.6%211923Seat 1,5741.1%+ 2.9%232,5030.9%– 11.6%232224Cupra1,3170.9%+ 103.9%242,0500.8%+ 98.5%242425Jeep8460.6%+ 116.9%251,4390.5%+ 75.7%252626Porsche7700.5%+ 231.9%311,1190.4%+ 169.0%263127Land Rover5670.4%+ 32.5%261,1080.4%+ 40.4%272728Lexus5220.4%+ 119.3%289580.4%+ 80.1%292829Mazda5060.4%– 5.9%279600.4%– 2.8%282530Alfa Romeo4140.3%+ 48.9%308000.3%+ 53.0%303031Honda3910.3%+ 58.9%337100.3%+ 38.4%322932BYD3630.3%new297900.3%new313833Mitsubishi2460.2%+ 17.1%345370.2%+ 28.8%333434Alpine1940.1%+ 280.4%382670.1%+ 102.3%353335Smart1920.1%+ 195.4%325340.2%+ 263.3%343536Abarth1240.1%n/a362290.1%n/a363737Lynk & Co460.0%– 82.8%351760.1%– 68.1%373238Jaguar410.0%– 33.9%39730.0%– 18.0%393639Ferrari260.0%+ 52.9%43330.0%+ 3.1%404040Caterham160.0%+ 300.0%52170.0%+ 142.9%424841Leapmotor150.0%+ 150.0%371060.0%+ 1225.0%383942Aiways150.0%+ 7.1%42230.0%– 54.0%414543Minimoke120.0%n/a –160.0%n/a436444Fisker110.0%new46150.0%new454745Lotus80.0%+ 300.0%44150.0%+ 400.0%444346Subaru70.0%+ 133.3%48110.0%+ 266.7%475247Lamborghini60.0%+ 200.0%5070.0%+ 0.0%504448Secma40.0%+ 100.0% –40.0%+ 0.0%525049Seres (ex DFSK)20.0%– 88.2%40140.0%– 72.0%464150VinFast20.0%new4570.0%new495451Morgan20.0%+ 100.0%4760.0%+ 200.0%515152Aston Martin20.0%– 50.0%5130.0%– 50.0%544653De Fremont 20.0%n/a –20.0%n/a565554Maserati10.0%– 90.9%4190.0%– 35.7%484255Devalliet10.0%n/a5420.0%n/a555856Bentley10.0%– 50.0% –10.0%– 85.7%584957Rolls-Royce10.0%n/a –10.0%n/a595758Genesis10.0%n/a –10.0%+ 0.0%606259McLaren00.0%n/a4930.0%n/a535360Chevrolet00.0%n/a5310.0%n/a5756
France February 2024 – models:
PosModelFeb-24%/23Jan2024%/23PosFY231Peugeot 20810,0307.0%+ 37.8%118,4026.9%+ 39.3%122Renault Clio6,9934.9%+ 31.1%312,8274.8%+ 24.5%213Citroen C36,1254.3%+ 60.9%411,1104.2%+ 61.1%444Dacia Sandero5,8074.1%+ 23.1%212,7314.8%+ 12.9%335Peugeot 308 III3,7242.6%– 7.5%67,5562.9%+ 6.2%576Renault Captur3,6522.6%– 3.6%126,1012.3%– 14.2%867Peugeot 20083,3202.3%– 4.8%57,2002.7%– 3.0%658Toyota Yaris2,9882.1%+ 31.7%76,1362.3%+ 38.1%7169Toyota Yaris Cross2,9112.0%+ 21.5%85,6582.1%+ 17.5%91110Fiat 5002,8972.0%+ 33.0%144,8251.8%+ 20.0%13911Dacia Duster2,7962.0%+ 4.2%105,2952.0%+ 23.9%101012Renault Austral2,7341.9%+ 15.1%204,1301.6%+ 4.3%141313Peugeot 3008 II2,3971.7%– 15.5%114,8751.8%– 12.0%121214Dacia Jogger2,3561.7%+ 44.9%94,9261.9%+ 59.2%111815Citroen C4 III2,1531.5%+ 33.8%223,4831.3%+ 27.9%173016Tesla Model Y1,9821.4%– 20.2%183,4591.3%+ 18.9%18817Opel Corsa1,9151.3%+ 25.2%163,7381.4%+ 32.3%162518Ford Puma1,8731.3%+ 15.7%193,3061.2%+ 19.2%192019Citroen C3 Aircross1,8461.3%+ 33.7%133,8951.5%+ 41.4%152220Renault Twingo1,8101.3%+ 22.4%253,0121.1%+ 15.0%202821Peugeot 50081,7531.2%+ 11.2%322,8201.1%+ 9.8%233222Renault Megane E-Tech1,6121.1%+ 50.8%332,6751.0%+ 3.9%252723BMW X11,5711.1%+ 148.2%412,4610.9%+ 171.0%293924Citroen C5 Aircross1,5361.1%– 23.0%232,8561.1%– 28.0%212425VW T-Cross1,4991.1%+ 25.2%711,8550.7%– 25.0%424426MG41,4911.0%+ 48.5%392,4150.9%+ 42.9%302327Kia Sportage1,4311.0%+ 45.3%302,5331.0%+ 22.4%273628VW Polo1,3490.9%– 22.7%262,5271.0%– 29.9%281729VW T-Roc1,3320.9%+ 4.8%442,0810.8%– 22.9%372130Toyota C-HR1,2550.9%+ 11.8%212,5941.0%+ 10.1%263531Tesla Model 31,2160.9%+ 39.4%172,8391.1%+ 146.9%221932VW Golf1,2050.8%+ 9.0%272,3590.9%+ 26.2%323433Mini Hatch1,1380.8%+ 19.9%312,3900.9%+ 42.3%313334Suzuki Swift1,1380.8%+ 87.8%362,1260.8%+ 81.6%344835Hyundai Tucson1,1220.8%– 19.0%282,2420.8%– 16.4%332636Kia Niro1,0820.8%+ 147.6%382,0130.8%+ 140.5%395237Toyota Corolla1,0400.7%+ 10.3%342,1000.8%+ 8.2%364238BMW iX11,0100.7%+ 1047.7%591,4770.6%+ 789.8%4610039Nissan Juke9940.7%+ 35.1%351,9990.8%+ 62.8%404540VW Tiguan9590.7%– 16.4%401,7570.7%– 12.3%433141Ford Kuga9280.7%+ 1.9%471,6400.6%+ 14.8%443742Toyota Aygo X9270.7%+ 31.1%292,0410.8%+ 3.7%383843Nissan Qashqai9170.6%– 41.8%371,8920.7%– 31.6%412944Cupra Formentor8900.6%+ 85.0%661,3010.5%+ 77.0%525345Renault Arkana8890.6%– 37.3%242,1050.8%– 40.2%351546Renault Espace8470.6%+ 4135.0%601,3020.5%+ 4240.0%517447Audi Q38110.6%+ 10.3%581,2950.5%– 2.5%534748Hyundai Kona7820.5%– 26.8%431,5300.6%– 14.9%454149Volvo EX307700.5%new811,0770.4%new5931950Dacia Spring7680.5%– 73.3%152,7051.0%– 43.4%241451VW Taigo7540.5%+ 24.4%561,2430.5%– 23.8%545052Audi A37250.5%+ 9.5%511,3160.5%+ 15.7%505653Porsche Cayenne 7050.5%+ 400.0%849950.4%+ 264.5%6315454Mercedes GLA7040.5%– 20.0%999400.4%– 29.6%674055DS 46920.5%– 17.4%451,4280.5%– 18.4%475456Opel Mokka6750.5%– 14.1%461,4020.5%– 18.8%485157Seat Ibiza6260.4%– 17.2%958820.3%– 37.9%747058Mercedes GLC6220.4%– 12.6%899000.3%– 10.2%724959Peugeot 4085820.4%+ 54.0%641,0170.4%+ 18.1%625960Toyota RAV45750.4%+ 1.8%501,2000.5%+ 29.0%566561DS 75670.4%– 30.5%481,2410.5%– 17.4%555562Skoda Octavia 5650.4%+ 41.3%749090.3%+ 27.3%706863Jeep Avenger5600.4%new739050.3%new7113364BMW Série 15580.4%– 22.4%421,3960.5%– 4.8%494665Mercedes Classe A5560.4%+ 19.3%868420.3%+ 19.3%766066Renault Trafic5500.4%+ 134.0%768840.3%+ 86.1%737567Hyundai i205480.4%+ 17.3%689380.4%+ 17.1%686668DS 3/Crossback5410.4%+ 49.9%521,0970.4%+ 46.3%587869Opel Crossland5370.4%+ 98.2%491,1980.5%+ 134.9%577770Fiat 500X5350.4%+ 664.3%551,0570.4%+ 843.8%6011771Kia Picanto5290.4%+ 13.8%571,0170.4%+ 16.0%616972Fiat 6005200.4%new639650.4%new6517173Seat Arona5080.4%– 4.9%1017410.3%– 22.7%838874Renault Megane IV5070.4%– 55.2%679100.3%– 56.0%694375Ford Focus4980.3%– 7.4%619490.4%– 3.2%6682
Source: PFA, AAA

