Australia February 2024: Another record result, Nissan at highest in 11 years
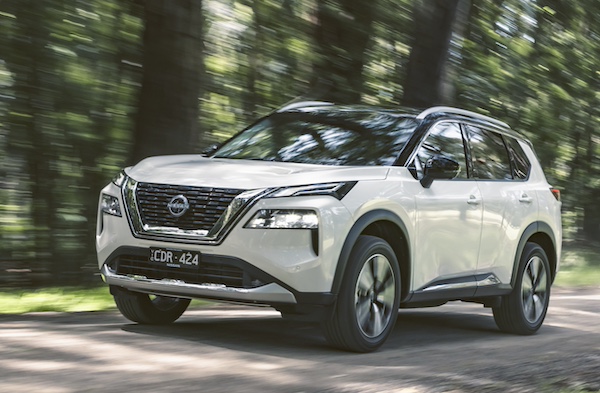
The Nissan X-Trail manages its best ranking since September 2018.
It’s yet another record for new vehicle sales in Australia with sales up a whopping 20.9% year-on-year in February to 105,023. It smashes the previous February record of 96,443 established back in 2016. Part of the explanation for this fantastic result is the fact that year-ago sales were hampered by quarantine bottlenecks, as 60,000 vehicles needed to be treated by biosecurity for seeds and pests. Year-to-date sales are up 13.4% to 194,805. Private sales are up 22.7% to 55,729, business sales up 21.1% to 37,103, sales to rental companies are up 9.3% to 5,104 and government sales up 37% to 3,212. Petrol registrations are up 4.5% to 46,533, diesel is up 21.1% to 32,022, HEVs up 100.2% to 11,447, BEVs up 70.4% to 10,111 and PHEV up 127.8% to 1,034.
All regions are in positive, with New South Wales is up 15.7% to 31,943 sales, Victoria up 29.8% to 28,415, Queensland up 21.9% to 22,466, Western Australia up 15.3% to 11,317, South Australia up 16.3% to 6,451, Tasmania up 28.5% to 1,817, Australian Capital Territory up 19.9% to 1,743 and Northern Territory up 20.1% to 871. SUVs are up 20.6% to 57,773 and 55% share vs. 55.1% a year ago, light commercials gain 26.3% to 23,675 and 22.6% share vs. 21.6% in February 2023, even passenger cars are up significantly at +19.3% to 19,610 and 18.7% share vs. 18.9% last year while heavy commercials hold 3.7% share at 3,875 sales. As for sales by country of origin, Japan is up 30.9% to 32,476, Thailand up 24.8% to 23,160, China up 31.7% to 17,943, South Korea up 1.5% to 12,424 and Germany up 33.8% to 3,980.
Toyota (+35.2%) compensates for a drab year-ago result and holds 18.4% of the market. Mazda (-4.1%) is in difficulty but holds onto the 2nd spot for just 75 sales above Ford (+20.8%). Nissan (+157.2%) surges eight spots on January to land in 4th place with 6.3% share. This is the brand’s highest monthly ranking since the #3 it hit in March 2013 and its best market share since November 2016 (6.4%). Mitsubishi (+16.6%) and Kia (+2.4%) repeat their January positions at #5 and #6 while Hyundai (+3.6%) is down three ranks to #7. It’s a great month also for Tesla (+61.1%) up 11 spots to #8 and Isuzu Ute (+48.7%) at #9. MG (+2.5%) has a rare underperforming month and falls from #7 in January to #10. GWM (+47%), Suzuki (+26%), BMW (+63.3%), Honda (+39.2%) and BYD (+101.2%) also have strong months.
Model-wise, the Ford Ranger (+19.7%) manages a 5th consecutive month in the lead, cementing its domination of the Australian market. The Toyota Hilux (+11.8%) follows but vastly trails the market. Notably the Hilux normally holds to top spot in the 4×2 pickup ranking but is this month outsold by both the Ford Ranger and Isuzu D-Max. The Tesla Model 3 (+34.5%) rallies back up 36 spots on last month to #3 and now ranks #6 year-to-date. The Isuzu D-Max (+52.3%) follows with another splendid result. The Toyota RAV4 (+34.4%) holds onto the #1 SUV position. It is followed this month by a resurgent Nissan X-Trail (+283.5%), up 24 ranks on January to #6, the nameplate’s highest ranking since also hitting #6 in September 2018. The Toyota Corolla (+105.5%) and Tesla Model Y (+145.2%) also shine in the remainder of the Top 10.
Previous month: Australia January 2024: Record market, Ford Ranger #1, Toyota, Isuzu Ute shine
One year ago: Australia February 2023: Market up 1.8% despite quarantine bottleneck, Ford Ranger threepeats at #1
Full February 2024 Top 49 All brands and Top 40 models below.
Australia February 2024 – brands:
PosBrandFeb-24%/23Jan2024%/23PosFY231Toyota 19,37418.4%+ 35.2%137,27719.1%+ 34.6%112Mazda 7,3507.0%– 4.1%215,5158.0%– 9.1%223Ford 7,2756.9%+ 20.8%313,8997.1%+ 9.9%334Nissan 6,6176.3%+ 157.2%129,3174.8%+ 85.6%7125Mitsubishi6,4116.1%+ 16.6%512,3226.3%+ 14.3%466Kia 6,1415.8%+ 2.4%611,8486.1%– 1.3%647Hyundai 5,7035.4%+ 3.6%411,8656.1%+ 4.9%558Tesla5,6655.4%+ 61.1%196,7723.5%– 0.8%1189Isuzu Ute4,6924.5%+ 48.7%88,4504.3%+ 45.0%91010MG4,4744.3%+ 2.5%78,4804.4%+ 1.2%8711Subaru 3,8023.6%– 6.2%106,8703.5%– 10.3%10912GWM3,4583.3%+ 47.0%96,5823.4%+ 35.5%121313Volkswagen3,1693.0%+ 8.2%115,8863.0%+ 7.6%131114Suzuki 1,7421.7%+ 26.0%153,2691.7%+ 17.1%151815BMW1,7101.6%+ 63.3%143,3121.7%+ 31.1%141516Honda 1,7091.6%+ 39.2%173,0551.6%+ 31.1%172017Mercedes1,6451.6%– 9.0%163,0101.5%– 23.2%181418BYD1,5491.5%+ 101.2%182,8591.5%+ 175.7%192119LDV1,3871.3%– 16.0%133,1991.6%+ 4.0%161620Audi1,2191.2%– 27.4%202,2281.1%– 26.5%201721Lexus1,0091.0%+ 40.9%211,8821.0%+ 54.5%211922Porsche7170.7%+ 16.8%251,2130.6%+ 21.8%242723Chery6290.6%new221,3580.7%new222924Volvo6040.6%– 29.6%231,2480.6%– 27.4%232225Skoda5330.5%– 17.4%261,0180.5%– 23.1%262526Land Rover5200.5%+ 293.9%241,0420.5%+ 234.0%252327Renault5140.5%– 9.7%289250.5%– 28.0%272428Ssangyong4220.4%– 11.0%278900.5%– 5.1%282829Ram3250.3%– 40.6%296650.3%– 30.4%292630Chevrolet2870.3%+ 33.5%305730.3%+ 25.7%303331Mini2860.3%+ 53.8%325030.3%+ 10.5%313132Jeep 2190.2%– 44.1%314950.3%– 29.2%323033Cupra2190.2%+ 3.8%343660.2%+ 1.9%333234Peugeot2060.2%+ 82.3%353530.2%+ 56.2%343435Polestar1130.1%– 34.3%332640.1%– 21.4%353536Fiat1040.1%– 32.9%362420.1%– 24.1%363637Genesis750.1%– 31.8%372050.1%– 5.1%373738Alfa Romeo640.1%+ 113.3%381580.1%+ 167.8%383839Jaguar430.0%+ 95.5%391060.1%+ 92.7%394040Maserati340.0%+ 36.0%40580.0%+ 52.6%403941Lamborghini180.0%+ 20.0%43270.0%+ 8.0%434142Lotus170.0%+ 30.8%44260.0%+ 13.0%444543Ferrari130.0%– 40.9%42270.0%– 30.8%424444Citroen130.0%+ 0.0%46200.0%– 4.8%454345Bentley110.0%– 75.6%41300.0%– 33.3%414246Aston Martin90.0%– 10.0%45170.0%+ 30.8%464647Rolls-Royce40.0%+ 300.0%4870.0%+ 133.3%474848McLaren20.0%– 50.0%4950.0%– 64.3%494749Dodge00.0%n/a4760.0%n/a48 –
Australia February 2024 – models:
PosModelFeb-24%/23Jan2024%/23Pos1Ford Ranger5,3535.1%+ 19.7%110,1005.2%+ 9.5%12Toyota Hilux4,4034.2%+ 11.8%28,4954.4%+ 5.3%23Tesla Model 33,5933.4%+ 34.5%394,3162.2%– 22.9%64Isuzu D-Max2,9412.8%+ 52.3%35,4822.8%+ 45.3%35Toyota RAV42,8432.7%+ 34.4%45,0542.6%+ 24.1%46Nissan X-Trail2,5082.4%+ 283.5%303,4371.8%+ 113.6%97Toyota Corolla2,4952.4%+ 105.5%64,3842.3%+ 88.2%58MG ZS2,3572.2%+ 15.1%74,2452.2%+ 9.2%89Mitsubishi Outlander2,2092.1%+ 2.0%54,2862.2%+ 11.6%710Tesla Model Y2,0722.0%+ 145.2%662,4561.3%+ 99.5%2111Isuzu MU-X1,7511.7%+ 42.9%182,9681.5%+ 44.6%1512Hyundai Tucson1,6871.6%+ 8.4%133,1931.6%+ 0.7%1113Mazda CX-51,6421.6%– 36.8%103,3621.7%– 29.8%1014Toyota Land Cruiser Wagon1,5781.5%+ 54.4%143,0411.6%+ 50.7%1315Toyota Camry1,5521.5%+ 295.9%192,7441.4%+ 259.2%1916Mitsubishi Triton1,5371.5%+ 11.3%152,9201.5%+ 10.9%1617Nissan Navara1,5011.4%+ 181.1%581,9771.0%+ 105.3%3218Mazda BT-501,3891.3%+ 12.0%212,5541.3%– 0.2%2019Hyundai i301,3721.3%– 3.1%93,0991.6%+ 4.0%1220Kia Sportage1,3501.3%+ 45.9%113,0151.5%+ 20.7%1421Subaru Crosstrek1,2541.2%new332,0641.1%#DIV/0!2922Mazda CX-31,2321.2%+ 17.8%122,7561.4%– 20.4%1823Subaru Forester1,2061.1%– 29.4%232,2671.2%– 26.4%2324GWM Haval Jolion1,2021.1%+ 47.8%242,2571.2%+ 33.7%2425Toyota Hiace1,1841.1%+ 114.5%361,9491.0%+ 80.8%3326Kia Cerato1,1161.1%+ 168.3%272,1381.1%+ 195.3%2827Toyota Land Cruiser PU/CC1,1151.1%+ 46.5%222,1931.1%+ 57.1%2628Mitsubishi ASX1,0601.0%+ 65.1%292,0051.0%+ 15.4%3029Ford Everest1,0591.0%+ 40.8%202,2351.1%+ 12.8%2530Hyundai Kona1,0241.0%+ 55.4%162,3921.2%+ 86.9%2231Nissan Patrol1,0201.0%+ 206.3%561,5290.8%+ 160.9%3932Toyota Prado1,0181.0%– 9.3%82,7641.4%+ 19.9%1733MG 31,0151.0%– 37.4%311,9111.0%– 35.7%3434Nissan Qashqai9740.9%+ 42.8%571,4650.8%+ 16.9%4035Kia Sorento9500.9%– 9.1%451,5970.8%– 23.5%3836Mazda CX-309440.9%+ 96.3%251,9841.0%+ 73.7%3137Toyota Kluger8900.8%– 19.4%172,1461.1%+ 20.2%2738Subaru Outback8720.8%– 29.3%371,6270.8%– 19.7%3739Mitsubishi Eclipse Cross8620.8%+ 4.7%321,7440.9%+ 25.1%3540Toyota Corolla Cross8600.8%+ 68.3%351,6350.8%+ 57.4%36
Source: VFACTS


