Puerto Rico (USA) Full Year 2022: Toyota and Corolla strengthen lead, Hyundai Accent up to #3
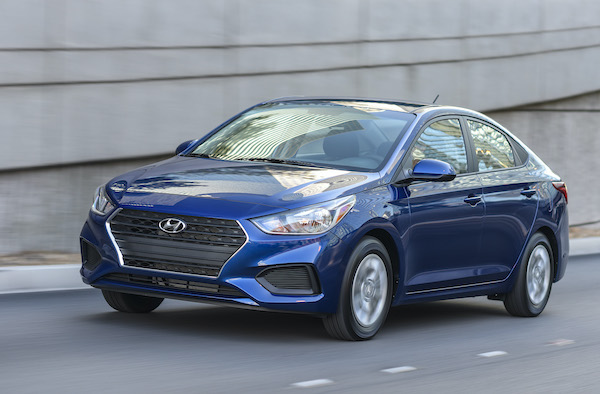
The Hyundai Accent sees its sales leap up 82.9% in 2022.
123,603 new light vehicles found a buyer in Puerto Rico in 2022, a -4.3% year-on-year drop. Note Puerto Rican sales are released separately from the US. Toyota (+17.9%) goes completely against the negative market to deliver the largest gain in the Top 10 and rise to a suffocating 29.2% market share vs. 23.7% over the Full Year 2021. Hyundai (-3.5%) remains in the 2nd spot with 15.9% share while both Ford (+8.7%) and Mitsubishi (-2%) leap up two spots on last year to #3 and #4 respectively. In contrast Kia (-22.4%) and Nissan (-35.9%) implode below. BMW (+7%) is the only additional gainer in the Top 10.
Model-wise, the Toyota Corolla (+23.7%) repeats at #1 with a stellar 8.7% share, two percentage points above its 2021 level. The Toyota RAV4 (+0.9%) stays at #2 while the Hyundai Accent (+82.9%) climbs four ranks on 2021 to #3, dislodging the Toyota Tacoma (-5.1%) from the podium. It’s an excellent showing for the Kia Seltos (+12.4%) up six spots on last year to #5. Below a hard-hit Hyundai Venue (-20.3%), the Toyota Corolla Cross (+1053.8%) ends its first full year in market at a splendid 7th place. The Ford F-Series (-6.1%) and Mitsubishi Outlander (-3.9%) resist somewhat unlike the Hyundai Tucson (-45.1%).
Previous year: Puerto Rico (USA) 2021: Podium 100% Toyota, Corolla new #1 in market up 35.9%
Full Year 2022 Top 37 All brands and Top 50 models vs. Full Year 2021 data below.
Puerto Rico (USA) Full Year 2022 – brands:
PosBrand2022%/212021%Pos1Toyota36,12729.2%17.9%30,64923.7%12Hyundai19,68615.9%-3.5%20,39415.8%23Ford (est)12,43310.1%8.7%11,4388.9%54Mitsubishi10,2458.3%-2.0%10,4508.1%65Kia9,4087.6%-22.4%12,1179.4%46Nissan8,0276.5%-35.9%12,5189.7%37Jeep (est)6,6245.4%-1.7%6,7365.2%88Honda5,3044.3%-32.7%7,8816.1%79Ram (est)2,9742.4%-1.7%3,0242.3%910BMW2,2001.8%7.0%2,0571.6%1011Lexus1,3821.1%21.1%1,1410.9%1412Mazda1,3631.1%-27.8%1,8891.5%1113Mercedes1,2051.0%9.7%1,0980.9%1614Chevrolet (est)1,0910.9%-3.2%1,1270.9%1515Volkswagen7990.6%-30.6%1,1520.9%1316Volvo7060.6%7.3%6580.5%1717Acura6390.5%-51.4%1,3161.0%1218Infiniti6240.5%11.8%5580.4%1819Audi5340.4%14.1%4680.4%1920Genesis4000.3%25.0%3200.2%2221Dodge (est)3330.3%-1.8%3390.3%2122Mini2840.2%-16.7%3410.3%2023Porsche2170.2%-11.1%2440.2%2524Land Rover1940.2%-30.7%2800.2%2325Subaru1930.2%-27.2%2650.2%2426Lincoln (est)1820.1%9.0%1670.1%2627GMC (est)920.1%-3.2%950.1%2728Chrysler (est)810.1%-1.2%820.1%2829Cadillac (est)670.1%-2.9%690.1%2930Alfa Romeo460.0%-8.0%500.0%3031Buick (est)450.0%-2.2%460.0%3132Jaguar250.0%-41.9%430.0%3233Lamborghini210.0%10.5%190.0%3634Maserati160.0%-59.0%390.0%3335Fiat150.0%-59.5%370.0%3436Ferrari120.0%-29.4%170.0%3737Bentley110.0%-47.6%210.0%35
Puerto Rico (USA) Full Year 2022 – models:
PosModel2022%/212021%Pos1Toyota Corolla10,7358.7%23.7%8,6766.7%12Toyota RAV48,2356.7%0.9%8,1606.3%23Hyundai Accent6,7115.4%82.9%3,6692.8%74Toyota Tacoma5,9084.8%-5.1%6,2264.8%35Kia Seltos3,5542.9%12.4%3,1632.4%116Hyundai Venue3,4932.8%-20.3%4,3813.4%57Toyota Corolla Cross3,4732.8%1053.8%3010.2%658Hyundai Tucson3,2602.6%-45.1%5,9404.6%49Mitsubishi Outlander 3,0732.5%-3.9%3,1972.5%1010Ford F-Series3,0282.4%-6.1%3,2252.5%911Mitsubishi Outlander Sport2,9072.4%3.5%2,8092.2%1412Mitsubishi Mirage2,5172.0%-10.4%2,8102.2%1313Ram Pickup (est)2,5162.0%-1.7%2,5592.0%1614Toyota Highlander2,4332.0%18.3%2,0561.6%1815Kia Soul2,1581.7%20.6%1,7901.4%2216Honda CR-V2,1331.7%-34.6%3,2632.5%817Nissan Kicks1,7931.5%-30.2%2,5682.0%1518Mitsubishi Eclipse Cross1,7481.4%7.0%1,6341.3%2619Kia Rio1,7181.4%6.6%1,6111.2%2820Hyundai Kona1,6791.4%-15.8%1,9951.5%1921Jeep Grand Cherokee1,6621.3%-15.3%1,9621.5%2022Nissan Rogue1,6421.3%-34.3%2,4981.9%1723Nissan Versa1,6361.3%-59.5%4,0373.1%624Hyundai Elantra1,6251.3%-2.3%1,6631.3%2525Ford Ranger1,6041.3%40.3%1,1430.9%3626Ford Transit (est)1,5711.3%8.7%1,4451.1%3127Jeep Gladiator (est)1,4951.2%2.5%1,4581.1%3028Toyota C-HR1,4441.2%-16.3%1,7251.3%2429Jeep Wrangler1,3501.1%-16.5%1,6171.3%2730Jeep Compass1,3201.1%37.4%9610.7%3831Ford Bronco Sport1,2091.0%-32.0%1,7791.4%2332BMW X5/X61,2021.0%61.6%7440.6%4133Ford Maverick1,2001.0%1566.7%720.1%12834Toyota 4Runner1,1280.9%9.6%1,0290.8%3735Nissan Frontier1,0190.8%41.7%7190.6%4436Hyundai Santa Cruz9060.7%new00.0%26937Honda Accord 8910.7%10.1%8090.6%4038Ford Bronco8880.7%616.1%1240.1%10339Ford Explorer7980.6%44.0%5540.4%5040Ford Ecosport7820.6%-33.3%1,1730.9%3541Hyundai Palisade7620.6%31.6%5790.4%4942Nissan Sentra7570.6%-44.5%1,3631.1%3443Kia Forte7080.6%-54.4%1,5511.2%2944Hyundai Santa Fe6970.6%-62.3%1,8471.4%2145Honda HR-V6930.6%-50.3%1,3941.1%3246Jeep Renegade6250.5%-4.6%6550.5%4747Ford Transit Connect6190.5%-54.9%1,3711.1%3348Mazda CX-56070.5%-27.5%8370.6%3949Toyota Venza5910.5%43.8%4110.3%5650Lexus NX5550.4%52.9%3630.3%57
Source: Manufacturers
