
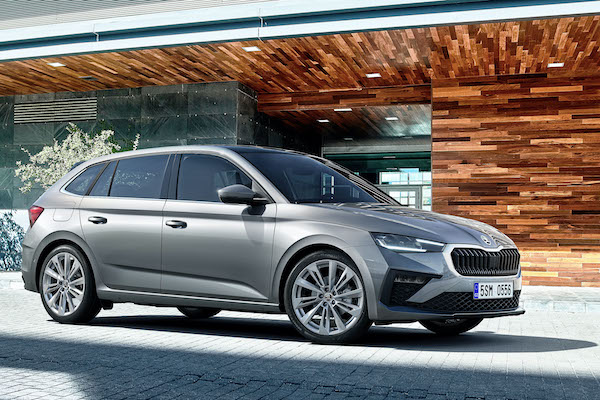
Czech Republic October 2023: Skoda Scala (+283.9%) stays at #2
The Skoda Scala is the 2nd best-selling car at home in October.
Czech new car sales jump 18.7% year-on-year in October to 19,322 units, leading to a year-to-date tally up 16.7% to 186,886. Skoda (+13.8%) falls below the market growth rate to hold 33.6% share vs. 35% so far this year. Volkswagen (+34.3%) overtakes Toyota (+93.3%) with both carmakers evolving above their year-to-date shares at 9.3% and 8.9% vs. 8.8% and 7.9% respectively. Hyundai (+3.2%) is weak at #4, whereas Kia (+27.2%) and BMW (+46.6%) are in great shape. Reversely Ford (-24.8%) and Peugeot (-21.5%) both struggle. MG (+337.7%) equals its ranking record at #12 and beats its volume and share records at 337 and 1.7%. It is up to #18 year-to-date vs. #29 over the Full Year 2022. Below, Ssangyong (+64.6%), Lexus (+68.8%), Subaru (+156.6%) and Tesla (+473.7%) impress.
Model-wise, the Skoda Octavia (-10.3%) retains the top spot by far with 7.5% share while the Skoda Scala (+283.9%) posts a stellar lift to stay at #2 with 5% share. The Skoda Kodiaq (+76%) is also in great shape at #3 vs. #6 year-to-date. The Skoda Karoq (+4.2%) is more discreet whereas the Skoda Fabia (-36.5%) tumbles down to #5. The VW Golf (+152%) is the best-selling foreign model in the country this month as it also was in August and September and showing great health unlike in most other European markets. No other Top 10 model beat the market, with the Hyundai i30 (-12.6%) and Tucson (+18.3%) being the next most popular foreigners. Below, the MG ZS (+277.3%) and Skoda Enyaq (+327.4%) stun.
Previous month: Czech Republic September 2023: Skoda Scala (+105.4%), Kodiaq (+100.5%) shine in market up 15.5%
One year ago: Czech Republic October 2022: Skoda (+51.6%) beats home market up 28.5%
Full October 2023 Top 52 All brands and Top 307 All models below.
Czech Republic October 2023 – brands:
PosBrandOct-23%/22Sep2023%/22PosFY221Skoda6,49133.6%+ 13.8%165,43435.0%+ 26.5%112Volkswagen1,8009.3%+ 34.3%316,4328.8%+ 22.1%333Toyota1,7228.9%+ 93.3%214,8547.9%+ 41.2%444Hyundai1,5948.2%+ 3.2%417,2139.2%+ 6.4%225Kia1,0015.2%+ 27.2%59,6495.2%+ 14.0%556Mercedes6673.5%+ 2.0%67,1533.8%+ 22.7%687BMW5793.0%+ 46.6%95,0072.7%+ 29.0%8108Dacia5662.9%+ 1.4%76,2583.3%– 18.7%769Ford4582.4%– 24.8%84,9602.7%– 22.2%9710Peugeot3862.0%– 21.5%103,7492.0%– 11.7%10911Audi3822.0%+ 2.1%113,4331.8%+ 22.2%111412MG3371.7%+ 337.7%132,1151.1%+ 770.4%182913Volvo3351.7%+ 25.0%152,4121.3%+ 40.2%161714Renault2781.4%– 16.5%143,3201.8%+ 9.1%121215SsangYong2601.3%+ 64.6%122,6511.4%+ 37.4%131616Suzuki2581.3%+ 31.0%192,4521.3%+ 65.5%152017Citroen 2531.3%– 9.6%221,7811.0%– 23.9%201518Opel2461.3%– 13.4%172,3601.3%– 34.9%171119Seat2081.1%– 10.0%162,4871.3%– 23.8%141320Lexus1891.0%+ 68.8%201,2680.7%+ 89.8%222221Mazda1810.9%– 22.6%181,8521.0%– 4.9%191822Subaru1360.7%+ 156.6%258050.4%+ 46.4%242523Cupra1340.7%– 27.2%231,5180.8%– 25.3%211924Tesla1090.6%+ 473.7%241,2400.7%+ 456.1%233225Honda1000.5%+ 25.0%266100.3%– 27.8%282126Nissan950.5%+ 26.7%216710.4%+ 16.9%262427Land Rover840.4%+ 64.7%287250.4%+ 29.9%252328Porsche720.4%+ 30.9%276330.3%+ 37.6%272829Fiat620.3%+ 82.4%314970.3%– 11.6%292730Jeep580.3%+ 346.2%303860.2%– 32.2%302631Mitsubishi380.2%+ 81.0%293310.2%– 7.3%323032Mini290.2%+ 45.0%323460.2%+ 8.1%313133Dodge200.1%+ 150.0%341100.1%+ 89.7%363834Alfa Romeo170.1%+ 325.0%351630.1%+ 114.5%343735Jaguar160.1%+ 0.0%39970.1%– 10.2%373436DS120.1%– 57.1%361930.1%+ 0.0%333337Ferrari120.1%+ 140.0%371210.1%+ 17.5%353538Bentley100.1%+ 11.1%40460.0%– 17.9%414039Chevrolet60.0%+ 200.0%33670.0%+ 157.7%384440Lamborghini60.0%+ 100.0%44580.0%+ 26.1%394141DFSK50.0%+ 150.0%42430.0%– 35.8%423942Ineos50.0%new46200.0%new49 –43Maserati30.0%+ 0.0%38470.0%+ 67.9%404244Aston Martin30.0%+ 200.0%49210.0%+ 75.0%474845Chrysler30.0%+ 200.0% –80.0%– 33.3%524946Rolls Royce20.0%+ 100.0%45320.0%+ 14.3%434347Alpina20.0%– 33.3%41280.0%+ 27.3%444548Forthing20.0%new43220.0%new46 –49Alpine20.0%+ 100.0% –180.0%+ 350.0%505050Cadillac20.0%n/a50120.0%– 47.8%514651Lada10.0%– 88.9%47250.0%– 75.0%453652KTM10.0%n/a5340.0%n/a55 – –Others840.4%+ 50.0% –1,0530.6%– 22.8% – –
Czech Republic October 2023 – models:
PosModelOct-23%/22Sep2023%/22PosFY221Skoda Octavia1,4477.5%– 10.3%118,4259.9%+ 54.4%112Skoda Scala9755.0%+ 283.9%28,2464.4%+ 54.0%363Skoda Kodiaq9244.8%+ 76.0%57,6094.1%+ 47.3%684Skoda Karoq8944.6%+ 4.2%37,8494.2%+ 20.3%545Skoda Fabia7804.0%– 36.5%68,6174.6%– 16.8%226VW Golf7033.6%+ 152.0%74,8712.6%+ 71.5%10127Skoda Kamiq6983.6%+ 12.2%47,9144.2%+ 43.4%458Hyundai i306603.4%– 12.6%86,6853.6%– 5.4%739Skoda Superb4962.6%+ 9.3%105,3182.8%– 0.2%9710Hyundai Tucson4852.5%+ 18.3%95,4072.9%+ 2.8%8911Kia Ceed4382.3%+ 63.4%123,7702.0%+ 12.0%111012Toyota Corolla4322.2%+ 108.7%113,1741.7%+ 79.8%121613Toyota RAV43031.6%+ 124.4%141,5560.8%– 3.2%231714MG ZS2831.5%+ 277.3%241,6380.9%+ 606.0%219715Skoda Enyaq2651.4%+ 327.4%161,2420.7%+ 9.6%263016Toyota Yaris Cross2601.3%+ 140.7%152,4611.3%+ 120.5%142617Dacia Duster2181.1%– 23.5%172,5261.4%– 24.8%131118VW Touran2171.1%+ 255.7%131,6380.9%+ 260.8%227419Dacia Sandero1971.0%+ 105.2%201,8321.0%– 17.4%191420Toyota Yaris1921.0%+ 36.2%192,1911.2%+ 66.5%162221Toyota Proace1710.9%+ 96.6%181,3010.7%+ 1.5%242822SsangYong Korando1690.9%+ 128.4%211,8921.0%+ 81.4%173223VW Tiguan1650.9%– 12.2%232,2081.2%– 4.3%151324Kia Sportage1630.8%– 4.7%251,8431.0%– 5.0%181525Dacia Jogger1430.7%– 5.9%341,8031.0%+ 21.5%202026Peugeot 20081430.7%+ 68.2%271,0450.6%+ 9.9%353427Kia Stonic1390.7%+ 65.5%359300.5%+ 24.8%404528Hyundai Bayon1380.7%+ 7.0%281,0830.6%– 4.7%322929Toyota C-HR1320.7%+ 266.7%261,2210.7%+ 58.2%284830Suzuki S-Cross1220.6%+ 93.7%451,1330.6%+ 104.1%305331Renault Captur1190.6%+ 67.6%588420.5%+ 12.4%444432Opel Corsa1120.6%+ 600.0%614730.3%+ 69.5%8211733Citroen C31110.6%+ 26.1%896820.4%– 5.8%575034VW Caddy1090.6%+ 60.3%221,2830.7%+ 102.7%255435BMW X51080.6%+ 10.2%388810.5%+ 8.9%424136Volvo XC601060.5%– 0.9%746550.4%+ 32.1%616037Ford Transit/Tourneo Custom1050.5%– 5.4%468250.4%– 38.0%452438Cupra Formentor1030.5%– 40.1%371,1400.6%– 40.5%291839Ford Puma1020.5%– 15.0%299810.5%– 17.4%382740Mercedes GLE990.5%+ 13.8%511,0350.6%+ 42.2%374241Ford Kuga910.5%– 37.2%331,0540.6%– 33.9%342142Hyundai Kona900.5%+ 0.0%301,2280.7%+ 31.3%273843VW Polo860.4%+ 7.5%875380.3%– 53.0%703144Seat Leon850.4%+ 54.5%364930.3%+ 12.8%776945Tesla Model Y820.4%new406400.3%new62 –46VW Transporter780.4%– 3.7%439740.5%+ 98.4%396647Audi Q3770.4%+ 37.5%1095210.3%+ 24.9%757848BMW X7730.4%+ 192.0%1033940.2%+ 45.9%9610449Peugeot 208720.4%– 20.9%497260.4%– 21.2%523550Subaru Outback720.4%+ 700.0%623090.2%+ 42.4%10812851Volvo XC40710.4%+ 31.5%475990.3%+ 29.1%666252Suzuki Vitara700.4%– 24.7%637920.4%+ 52.9%485753VW Taigo690.4%– 17.9%786910.4%+ 7.6%554754Lexus RX690.4%– 21.6%554300.2%+ 17.2%867655Volvo XC90680.4%+ 13.3%816920.4%+ 40.7%546156VW T-Roc680.4%+ 23.6%955190.3%– 30.9%764957Audi Q8670.3%+ 26.4%526870.4%+ 93.5%568358Mercedes GLC670.3%+ 42.6%486820.4%+ 48.3%585959Kia Rio660.3%– 13.2%391,0440.6%+ 53.3%365160Toyota Proace City650.3%+ 22.6%311,0640.6%+ 24.0%333661Audi A6650.3%+ 35.4%714240.2%– 0.5%897762VW Multivan640.3%+ 23.1%845470.3%+ 8.3%696563Kia Xceed630.3%– 7.4%657260.4%+ 14.3%515264Lexus NX630.3%+ 950.0%934080.2%+ 221.3%9314365Ford Focus620.3%– 33.3%427060.4%+ 27.0%535566VW Passat610.3%– 38.4%568250.4%– 7.9%463367Hyundai Santa Fe610.3%+ 96.8%506360.3%+ 82.2%638668BMW X3610.3%+ 190.5%794470.2%+ 47.5%8410069Hyundai i20580.3%+ 7.4%411,0860.6%+ 48.4%314670Peugeot 308580.3%+ 28.9%686750.4%+ 23.9%596471VW Touareg570.3%+ 307.1%1024220.2%+ 61.1%9011872Nissan Qashqai570.3%+ 18.8%324120.2%+ 7.0%918473Seat Arona540.3%– 18.2%838110.4%– 54.5%471974Mercedes V Class520.3%+ 4.0%548910.5%+ 2.3%413775BMW 3 Series520.3%+ 48.6%1054850.3%+ 29.3%798776Hyundai i10500.3%+ 25.0%606020.3%+ 22.9%656777Citroen C4490.3%+ 28.9%1493630.2%– 8.1%998178Mercedes CLA480.2%– 27.3%704540.2%+ 0.9%837379Mercedes GLS460.2%+ 48.4%1134910.3%+ 102.9%7810780Volvo V90460.2%+ 155.6%1271880.1%+ 74.1%14115481Mazda CX-5450.2%– 41.6%725220.3%+ 6.3%747182Renault Arkana440.2%– 27.9%734800.3%– 12.4%805683Toyota Aygo X430.2%– 30.6%577360.4%+ 120.4%507084VW Arteon430.2%– 46.3%1245570.3%– 30.5%683985Mercedes GLA430.2%– 8.5%1112910.2%+ 23.3%11211486Kia Proceed410.2%– 4.7%765230.3%+ 10.6%736887Opel Mokka410.2%+ 36.7%1184790.3%– 15.4%816388Audi Q5410.2%– 4.7%963270.2%– 3.0%1039489Kia Sorento410.2%+ 192.9%1072460.1%+ 134.3%12115290Mercedes GLB400.2%– 38.5%443510.2%+ 21.5%1019891Honda CR-V400.2%+ 33.3%1252800.1%– 28.4%1158292Opel Crossland X390.2%– 61.4%646710.4%– 53.4%602393Audi Q7390.2%– 44.3%865720.3%+ 103.6%679594Mazda CX-30390.2%+ 8.3%803720.2%– 23.1%987595Mazda CX-60390.2%– 7.1%913220.2%+ 297.5%10414796Seat Ateca380.2%– 53.7%757810.4%+ 43.0%495897Porsche Cayenne380.2%+ 90.0%1011790.1%+ 27.9%14314498BMW X1370.2%+ 12.1%1205250.3%+ 126.3%7212399BMW 5 Series370.2%+ 37.0%1324100.2%+ 25.4%9291100Suzuki Swift370.2%+ 236.4%982540.1%+ 95.4%117149101Ford Tourneo Connect360.2%+ 100.0%1042580.1%+ 19.4%116129102Peugeot 408360.2%new852280.1%new124300103Citroen C3 Aircross360.2%– 28.0%1312180.1%– 28.5%129101104Honda Civic360.2%+ 38.5%1331540.1%+ 49.5%152156105Renault Clio 350.2%– 75.2%948810.5%– 20.4%4325106Mercedes S Class350.2%– 42.6%973180.2%– 10.9%10590107Toyota Land Cruiser340.2%+ 25.9%904250.2%+ 80.1%88121108Opel Astra 340.2%+ 385.7%773610.2%+ 20.7%100108109BMW 4 Series340.2%+ 30.8%992980.2%+ 7.2%110111110Fiat Tipo340.2%+ 750.0%1571950.1%– 4.9%135132111SsangYong Tivoli340.2%+ 88.9% –1900.1%– 15.6%140124112Peugeot 3008330.2%– 67.0%1213830.2%– 54.7%9743113Land Rover Defender330.2%+ 153.8%1352240.1%+ 16.1%126131114VW T-Cross320.2%– 62.8%596170.3%– 18.4%6440115Peugeot 5008320.2%– 31.9%884300.2%+ 20.4%8788116Mercedes C Class320.2%+ 6.7%824080.2%+ 44.7%94110117BMW X6320.2%+ 18.5%1512390.1%– 16.1%123113118Mercedes A Class310.2%+ 3.3%1222850.2%+ 1.1%114103119Audi A3290.2%+ 52.6%1563160.2%– 7.9%10696120Renault Austral290.2%new1142490.1%new118 –121SsangYong Torres290.2%new92870.0%new189 –122Cupra Leon280.1%+ 1300.0%1292940.2%+ 600.0%111217123Mercedes Vito270.1%+ 17.4%1104470.2%+ 22.5%8585124MG HS270.1%new533980.2%new95 –125Subaru XV260.1%+ 225.0%1261960.1%+ 48.5%134153126Hyundai Staria250.1%+ 78.6%1002870.2%+ 348.4%113184127SsangYong Rexton240.1%+ 166.7%1433150.2%+ 218.2%107157128Audi A4240.1%+ 4.3%1531720.1%+ 3.0%145136129Lexus ES240.1%+ 300.0%1401420.1%+ 238.1%160218130Jeep Compass240.1%+ 380.0%1411350.1%– 56.2%162112131Toyota Camry230.1%+ 228.6%662990.2%+ 160.0%109158132Ford Transit230.1%+ 64.3%1342480.1%– 6.4%119120133Mazda3220.1%– 18.5%1442470.1%– 31.0%12093134Mercedes G Class220.1%– 4.3%1302450.1%+ 10.4%122126135Suzuki Ignis220.1%+ 175.0%1452030.1%+ 99.0%133162136Citroen C5 Aircross220.1%+ 15.8%1381330.1%– 14.2%164138137Toyota Highlander220.1%+ 29.4%1281200.1%– 57.1%171102138Volvo S60220.1%n/a117890.0%+ 394.4%187259139MG 4220.1%new209320.0%new242 –140Subaru BRZ210.1%n/a1371680.1%n/a148 –141Nissan X-Trail210.1%n/a1391090.1%n/a176301142Seat Tarraco200.1%+ 17.6%1231690.1%+ 19.9%147148143Mazda6190.1%– 20.8%1461720.1%+ 6.8%146139144Toyota GT86/GR86190.1%+ 850.0%671590.1%+ 7850.0%150297145Mercedes E Class190.1%– 38.7%1581440.1%– 48.0%159116146Lexus UX180.1%+ 125.0%1122180.1%+ 147.7%130175147BMW 2 Series180.1%– 40.0%1191780.1%+ 11.3%144140148Mini 180.1%+ 200.0%1471500.1%+ 0.7%155142149BMW 7 Series180.1%+ 800.0%1701400.1%+ 366.7%161239150Range Rover 180.1%+ 260.0%1421280.1%+ 287.9%169237151BMW i4180.1%+ 350.0%181940.1%+ 104.3%180207152Mitsubishi Space Star170.1%+ 0.0%1152050.1%– 31.0%132109153Citroen C4 X170.1%new1601060.1%new177 –154Mitsubishi ASX170.1%n/a116890.0%n/a186 –155Audi A7170.1%+ 30.8%188840.0%– 16.8%191168156Fiat 500160.1%+ 60.0%1551930.1%+ 26.1%137146157Kia Picanto160.1%– 5.9%1081910.1%+ 69.0%139150158Opel GrandLand X160.1%– 38.5%1691820.1%– 38.9%142105159Renault Kangoo160.1%+ 433.3%2221170.1%+ 3800.0%173268160Hyundai Ioniq 5160.1%+ 1500.0%1781120.1%+ 55.6%175180161Kia EV6150.1%+ 36.4%1591280.1%+ 13.3%168165162Alfa Romeo Tonale150.1%+ 1400.0%200960.1%+ 638.5%179272163Renault Megane140.1%– 56.3%695290.3%+ 58.9%7189164BMW X4140.1%– 30.0%1711240.1%+ 5.1%170160165Mercedes EQS140.1%+ 1300.0%192890.0%+ 134.2%185225166BMW ix1140.1%new189670.0%new205 –167Jeep Avenger140.1%new208250.0%new256 –168Kia Niro130.1%– 58.1%1912110.1%– 14.9%131119169BMW 2 Series Active Tourer130.1%– 23.5%1981530.1%+ 10.9%154145170Volvo V60130.1%– 13.3%224910.0%+ 26.4%183169171Honda HR-V130.1%+ 8.3%148820.0%– 68.0%194127172Ford Fiesta120.1%– 63.6%1063440.2%– 16.7%10279173Mercedes Citan120.1%+ 33.3%1542260.1%+ 247.7%125172174Mercedes EQE120.1%+ 1100.0%187840.0%+ 300.0%193248175BMW i5120.1%new –130.0%new284 –176Ford S-Max110.1%– 52.2%1502210.1%– 14.0%127125177Seat Ibiza110.1%+ 83.3%1632200.1%– 23.6%128106178Mazda2110.1%– 35.3%1361600.1%– 12.1%149134179Jeep Renegade110.1%+ 450.0%1761350.1%+ 170.0%163208180Renault Trafic110.1%+ 37.5%1771310.1%+ 77.0%166176181Toyota bZ4X110.1%+ 1000.0%162580.0%+ 1060.0%210236182Range Rover Velar110.1%+ 120.0%212530.0%– 5.4%212212183Porsche Macan100.1%– 23.1%1791040.1%+ 48.6%178185184VW ID.5100.1%+ 66.7%203710.0%+ 6.0%201195185Ford Mustang Mach-E100.1%+ 11.1%174590.0%+ 25.5%208210186Tesla Model X100.1%n/a269280.0%n/a247 –187VW ID.390.0%– 30.8%1521940.1%+ 125.6%136171188Range Rover Sport90.0%+ 800.0%1641570.1%+ 528.0%151246189VW ID.490.0%– 43.8%1841490.1%+ 8.0%157133190Tesla Model 390.0%new1751480.1%new158 –191Citroen C5 X90.0%+ 50.0%1651310.1%+ 104.7%165187192Fiat Panda90.0%+ 50.0%240620.0%– 3.1%207202193Jaguar F-Pace90.0%– 10.0%230460.0%– 35.2%219188194Mercedes Sprinter80.0%+ 300.0%2211180.1%+ 145.8%172209195Subaru Forester80.0%– 72.4%199920.0%– 22.7%181151196Mercedes B Class80.0%+ 300.0%172770.0%+ 16.7%198194197Renault Espace80.0%n/a –80.0%+ 700.0%306321198Porsche 91170.0%+ 75.0%1671500.1%+ 145.9%156203199Mini Countryman70.0%– 46.2%1851290.1%+ 26.5%167167200Dacia Spring70.0%+ 40.0%223910.0%+ 42.2%182177201DS 470.0%– 22.2%259890.0%+ 58.9%184193202VW ID. Buzz70.0%+ 600.0%210880.0%+ 2833.3%188307203Mercedes EQA70.0%+ 75.0%194580.0%– 1.7%209196204Volvo C4070.0%+ 0.0%204520.0%+ 100.0%214235205BMW XM60.0%new161840.0%new192 –206Hyundai Ioniq 660.0%new182690.0%new203 –207Lexus LC60.0%+ 500.0%213460.0%+ 142.1%222261208Mercedes EQB60.0%+ 50.0%231430.0%+ 2.4%227214209Honda ZR-V60.0%new168350.0%new238 –210Suzuki Across60.0%+ 500.0%256150.0%+ 36.4%280278211Audi A550.0%– 28.6%201860.0%– 18.1%190164212Citroen Berlingo50.0%– 87.8%225800.0%– 73.7%19592213Nissan Townstar50.0%+ 0.0%202790.0%+ 393.8%197260214Land Rover Discovery50.0%– 16.7%244460.0%– 30.3%220192215Nissan Juke50.0%– 58.3%232420.0%– 55.3%228173216Porsche Taycan50.0%+ 25.0%216400.0%– 4.8%233205217Peugeot 50850.0%– 37.5%264340.0%– 60.9%240179218Toyota Supra50.0%n/a207240.0%+ 500.0%258295219Ineos Grenadier50.0%new252200.0%new266 –220Bentley Continental50.0%n/a238180.0%n/a272 –221Mercedes T Class50.0%new220170.0%new276 –222Peugeot Traveller50.0%– 50.0%255170.0%– 76.4%277189223Nissan Leaf50.0%n/a29480.0%– 46.7%304271224Kia EV950.0%new –50.0%new321 –225DS 7 Crossback40.0%– 50.0%193710.0%– 7.8%200174226VW Up40.0%– 66.7%226680.0%– 76.0%204122227Mitsubishi Eclipse Cross40.0%+ 0.0%196340.0%– 41.4%239197228Mazda MX-3040.0%+ 33.3% –130.0%+ 8.3%288274229Subaru Solterra40.0%+ 300.0% –120.0%+ 1100.0%292312230Opel Combo30.0%– 96.7%2391540.1%– 53.8%15380231BMW 1 Series30.0%+ 50.0%186760.0%– 1.3%199181232BMW IX30.0%– 62.5%173700.0%+ 27.3%202190233Mercedes AMG GT30.0%+ 0.0%195500.0%– 16.7%215200234Cupra Born30.0%– 50.0%228470.0%+ 104.3%217256235Land Rover Discovery Sport30.0%– 50.0%243460.0%– 29.2%221191236Audi Q430.0%– 57.1%190450.0%+ 7.1%224219237Range Rover Evoque30.0%– 70.0%262440.0%– 15.4%225199238MG EHS30.0%+ 50.0%229410.0%+ 310.0%231266239Porsche Panamera30.0%– 25.0%214410.0%+ 51.9%232247240BMW i730.0%new218290.0%new244294241Maserati Grecale30.0%+ 50.0%219270.0%+ 575.0%251284242Lamborghini Huracan30.0%n/a267230.0%n/a259 –243Mercedes EQV30.0%n/a251220.0%– 29.0%261245244Tesla Model S30.0%n/a183210.0%n/a263 –245Porsche Boxster30.0%+ 200.0%271190.0%+ 90.0%268285246Ferrari SF90 Stradale30.0%n/a272180.0%+ 157.1%274291247DFSK Fengon 530.0%n/a278130.0%– 68.3%285224248Jaguar F-Type30.0%+ 200.0% –130.0%+ 30.0%287280249Audi R830.0%+ 200.0% –110.0%+ 175.0%294302250Toyota Prius30.0%n/a283100.0%+ 25.0%300289251Lexus LS30.0%n/a28970.0%– 30.0%309283252Lexus RZ30.0%new29650.0%new317 –253Subaru Impreza30.0%n/a –50.0%– 80.0%320255254Peugeot Rifter20.0%– 98.0%1661930.1%– 54.4%13872255Ford Mustang20.0%– 83.3%260640.0%– 16.9%206178256Honda Jazz20.0%– 83.3%227550.0%– 38.9%211170257Renault Koleos20.0%+ 0.0%261520.0%+ 48.6%213213258Audi Q220.0%– 84.6% –460.0%– 41.0%218183259Audi A120.0%– 50.0%241450.0%+ 12.5%223221260VW California20.0%– 50.0% –420.0%– 33.3%229204261Porsche Cayman20.0%+ 100.0%263390.0%+ 254.5%234282262Audi A820.0%– 66.7%215370.0%+ 15.6%235232263Mini Cabrio20.0%+ 100.0%234320.0%– 3.0%243228264Mini Clubman20.0%n/a265280.0%– 6.7%246238265VW Crafter20.0%– 50.0% –280.0%– 3.4%248241266Citroen e-C4 X20.0%new246270.0%new249 –267Fiat 500X20.0%– 33.3%235250.0%– 24.2%255240268Mercedes CLS20.0%+ 100.0%248230.0%– 14.8%260244269Alpine A110 20.0%+ 100.0% –180.0%+ 350.0%270290270Citroen e-C420.0%– 33.3%237180.0%– 30.8%273242271Jaguar E-Pace20.0%+ 0.0%253150.0%+ 7.1%279275272Ferrari Roma20.0%+ 0.0%276140.0%+ 0.0%282270273Ferrari Portofino20.0%n/a –110.0%+ 175.0%295292274Bentley Bentayaga20.0%new28190.0%new302 –275Hyundai Nexo20.0%new –40.0%new325 –276MG 520.0%new –40.0%new328 –277Jaguar i-Pace20.0%+ 100.0% –20.0%– 66.7%343296278Subaru Crosstrek20.0%new –20.0%new344 –279Mercedes SL10.0%– 66.7%180800.0%+ 321.1%196258280Alfa Romeo Stelvio10.0%– 66.7%211470.0%+ 46.9%216229281BMW 6 Series10.0%+ 0.0%205410.0%+ 20.6%230220282Volvo S9010.0%– 80.0%217360.0%+ 5.9%237234283BMW Z410.0%+ 0.0%233330.0%– 23.3%241223284BMW X210.0%– 50.0% –290.0%– 37.0%245215285Mazda MX-510.0%– 66.7%245270.0%– 12.9%252243286Kia Stinger10.0%– 66.7%247260.0%+ 4.0%253251287Ferrari F810.0%+ 0.0%266250.0%+ 25.0%254262288Jeep Wrangler10.0%n/a236210.0%– 83.1%262163289DS 310.0%– 87.5%249200.0%– 54.5%264216290Ferrari 812 Superfast10.0%+ 0.0%250200.0%+ 100.0%265281291Alfa Romeo Giulia10.0%n/a197180.0%– 35.7%269249292Rolls Royce Cullinan10.0%n/a270180.0%+ 100.0%275276293BMW iX310.0%– 75.0%273150.0%– 46.4%278253294DFSK Glory 58010.0%+ 0.0% –140.0%+ 100.0%281287295Lamborghini Urus10.0%new275140.0%new283 –296Alpina XB710.0%+ 0.0%28090.0%+ 350.0%301314297DFSK Seres 310.0%+ 0.0%25770.0%– 58.8%307264298Ferrari 812 Competizione10.0%new28570.0%new308 –299Nissan Ariya10.0%+ 0.0%28670.0%+ 600.0%311328300Audi TT10.0%+ 0.0% –40.0%+ 0.0%323305301Chevrolet Corvette10.0%n/a29340.0%n/a324 –302Lexus RC10.0%n/a –30.0%– 25.0%334303303Jeep Grand Cherokee10.0%n/a –10.0%n/a358 –304Mercedes CLE10.0%new –10.0%new359 –305Rolls Royce Spectre10.0%new –10.0%new360 –306Fiat Freemont10.0%n/a10.0%n/a361 –307Mercedes Viano10.0%n/a10.0%n/a362 –
Source: SDA CIA


More Stories
2026 Hyundai Tucson Hybrid Invoice Price, Dealer Cost, and How to Get the Best Deal Near You
If you are shopping for a 2026 Hyundai Tucson Hybrid and want to know what dealers are actually paying, what...
Keyless Car Theft in 2026: The Most-Targeted Cars & How to Protect Yours
Keyless car theft in 2026: which cars are targeted, why relay attacks work, and practical steps to close the Relay...
2026 Hyundai Santa Fe Hybrid Invoice Price, Dealer Cost, and How to Get the Best Deal Near You
If you are shopping for a 2026 Hyundai Santa Fe Hybrid and want to know what dealers are actually paying,...
The Tailored British Grand Tourer: First Look at the New Range Rover GT
Experienced by Kimatni D. Rawlins, Automotive Rhythms There are reveals, and then there are unveilings that require realignment of one’s...
FixGo Expands to San Diego County with 20 New Tire-Installation Partners
LOS ANGELES, CA — July 6, 2026 — FixGo, an online tire retailer that pairs web-based purchasing with local installation,...
Ford Recalls 565,691 Bronco and Bronco Raptor SUVs Over Engine Bay Fire Risk
Ford is recalling 565,691 Bronco and Bronco Raptor SUVs in the United States because of a potential fire risk tied...