UK October 2023: Ford Puma leads, BMW 1 Series and Peugeot 2008 at record levels
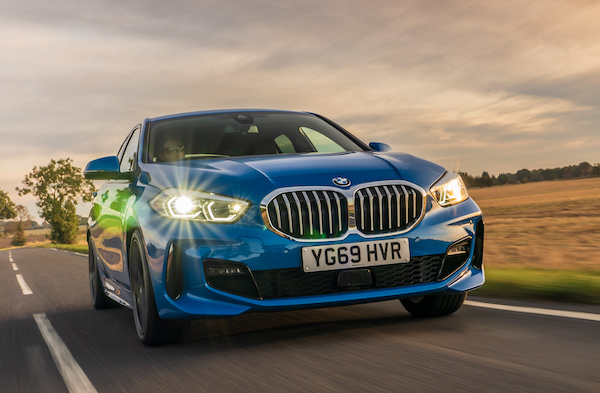
The BMW 1 Series is up to a highest ever #5 in October.
The UK new car market climbs up 14.3% year-on-year in October to 153,529 units, this is above the pre-pandemic level of October 2019 (143,251). The year-to-date volume is up 19.6% to 1,605,437, the best result since 2019. Fleet sales are solely responsible for the market’s growth in October, as it was also the case in September. They rise 28.8% to 87,479 and 57% share vs. 50.6% in October 2022. Private sales are stable at +0.3% to 62,915 and 41% share vs. 46.7% a year ago while business sales drop -15.2% to 3,135. Year-to-date, here too fleet sales push the market up at +40.8% to 854,372 and 53.2% share vs. 45.2% over the same period in 2022 whereas private sales only manage a meagre 1.6% gain to 713,301 and 44.4% share vs. 52.3%. Business sales are up 11.2% to 37,764.
In terms of propulsion, petrol is up 9.3% to 62,303 and 40.6% share vs. 42.4% a year ago, diesel falls further at -17.1% to 5,261 and 3.4% share vs. 4.7%, MHEV is up 6.4% to 28,163 and 18.3% share vs. 19.7%, HEV up 24.6% to 19,574 and 12.7% share vs. 11.7%, PHEV up 60.5% to 14,285 and 9.3% share vs. 6.6% and BEVs gain 20.1% to 23,943 and 15.6% share vs. 14.8% a year ago. Year-to-date, petrol is up 12.9% to 658.249 and 41% share vs. 43.4% over the first 10 months of 2022, diesel is off -15.6% to 61,947 and 3.9% share vs. 5.5%, MHEV are up 22.9% to 307,346 and 19.2% share vs. 18.6%, HEV is up 27.8% to 202,130 and 12.6% share vs. 11.8%, PHEV is up 36.7% to 113,278 and 7.1% share vs. 6.2% and BEVs are up 34.2% to 262,487 and 16.3% share vs. 14.6% last year.
Source: SMMT
In the brands ranking, Volkswagen (+2%) can only muster a tiny year-on-year growth but remains in the lead of the brands charts with 8.5% share. Audi (+23.6%) delivers a stellar evolution and its highest share since last April at 8.2%. Ford (-8.8%) endures the only drop in the Top 10 and falls to #3. It is followed by BMW (+21.6%) up six spots on September to #4 and Vauxhall (+20.2%) up three to #5. Both fare significantly higher than their YTD levels at 7.3% vs. 5.6% share and 6% vs. 5.3% respectively. MG (+28%) sports the largest uptick in the Top 10 with Peugeot (+25.9%) shooting up five ranks on last month to #7 and 4.6% share vs. 3.3% YTD. Cupra (+63.5%), Renault (+57%), Volvo (+52.6%) Land Rover (+39.9%) and Skoda (+37.3%) also impress while Tesla (+24236.4%) explodes its volume as its end of quarter skew is abandoned.
The Ford Puma (+49.9%) reclaims the top of the models ranking it holds year-to-date with 3.1% share, distancing the Mini (+45.6%) up from outside the September Top 10 directly into 2nd place. It now ranks #8 year-to-date. The Vauxhall Corsa (+24.4%) posts a very satisfying month and climbs back up four spots on September to #3, a ranking it also holds YTD. The VW Polo scores its highest ranking since September 2022 at #4 while the BMW 1 Series shoots up to #5, managing its first UK Top 10 finish since October 2020 (#9) and equalling its ranking record also hit in December 2012. Below the Kia Sportage (+64.4%) in outstanding shape, the Peugeot 2008 (+43.5%) breaks its ranking record at #7. The Audi A3 (+38.4%) and Ford Kuga (+49.8%) also impress as does the Volvo XC40 back inside the Top 10 for the first time since last May.
Previous month: UK September 2023: Fleets lift market up 21%, 6 SUVs in Top 6, MG places two models in Top 10
One year ago: UK October 2022: Ford Fiesta #1, Nissan Qashqai #1 YTD, Ora lands, market up 26.4%
Full October 2023 Top 45 brands and Top 10 models below.
UK October 2023 – brands:
PosBrandOct-23%/22Sep2023%/22PosFY221Volkswagen13,0588.5%+ 2.0%1136,3918.5%+ 29.9%112Audi 12,5988.2%+ 23.6%3116,6667.3%+ 29.3%333Ford 12,1197.9%– 8.8%2123,8947.7%+ 14.6%224BMW 11,1887.3%+ 21.6%1089,4035.6%+ 0.6%645Vauxhall 9,2666.0%+ 20.2%885,2195.3%+ 15.5%776Toyota8,6165.6%+ 3.3%593,6395.8%+ 7.3%557Peugeot 7,1064.6%+ 25.9%1253,4773.3%+ 10.4%13128Kia6,8314.4%+ 13.1%496,7846.0%+ 8.6%469Hyundai6,1564.0%+ 8.7%1175,4564.7%+ 8.2%8910MG6,0794.0%+ 28.0%967,7394.2%+ 57.3%111311Mercedes 5,9003.8%– 2.0%772,8014.5%+ 2.0%10812Skoda5,6703.7%+ 37.3%1358,9133.7%+ 47.4%121413Nissan 5,0363.3%– 26.1%674,5924.6%+ 25.1%91014Land Rover4,5823.0%+ 39.9%1744,1572.8%+ 19.0%141615Mini4,5122.9%+ 21.9%1837,5472.3%+ 4.5%171516Volvo4,4892.9%+ 52.6%1541,6562.6%+ 43.5%161717Renault4,3472.8%+ 57.0%1434,4672.1%+ 38.2%181818Tesla2,6771.7%+ 24236.4%1642,4062.6%+ 31.6%151119Cupra2,5231.6%+ 63.5%2321,1981.3%+ 76.4%252720Citroen2,4631.6%– 11.4%2026,1851.6%+ 2.3%211921Seat2,3391.5%+ 52.7%2226,6791.7%+ 44.5%202322Porsche1,9961.3%+ 65.4%2819,7481.2%+ 50.1%262523Suzuki1,9621.3%+ 96.0%2122,7561.4%+ 50.9%232624Dacia1,8431.2%+ 3.9%2423,2991.5%+ 1.1%222025Mazda1,8421.2%– 15.5%1926,7011.7%+ 28.2%192126Honda1,7771.2%– 20.8%2622,1471.4%+ 2.1%242227Jaguar1,4490.9%+ 286.4%2911,6280.7%+ 10.5%292828Lexus1,1570.8%+ 50.8%2513,1310.8%+ 65.4%282929Fiat1,0700.7%– 57.3%2715,3021.0%– 14.5%272430Polestar7440.5%– 30.4%3010,8620.7%+ 117.5%303031Jeep2610.2%+ 161.0%322,6570.2%+ 24.4%313232DS2340.2%– 56.6%352,2200.1%– 29.2%323133BYD1830.1%new366280.0%new42 –34SsangYong1530.1%– 7.8%341,4170.1%+ 3.2%343635Genesis1490.1%+ 106.9%411,1880.1%+ 86.2%363936Alfa Romeo1210.1%+ 15.2%381,2500.1%– 11.2%353437Smart1170.1%+ 105.3%424710.0%– 57.6%433838Bentley1060.1%– 24.8%401,1680.1%– 15.6%373339Ora920.1%+ 119.0%377600.0%+ 1709.5%414240Subaru890.1%– 47.0%311,9100.1%+ 80.9%333741Abarth790.1%– 74.8%337660.0%– 45.8%403542Maserati640.0%+ 52.4%437860.0%+ 27.2%394043Ineos620.0%new398000.0%new38 –44Alpine160.0%+ 23.1%442660.0%+ 11.8%444145Maxus00.0%new45120.0%new45 – –Other British2760.2%+ 52.5% –2,7950.2%+ 53.8% – – –Other Imports1320.1%+ 3.1% –1,5000.1%+ 13.7% – –
UK October 2023 – models:
PosModelOct-23%/22Sep2023%/22PosFY221Ford Puma4,8243.1%+ 49.9%242,1362.6%+ 36.4%142Mini3,7792.5%+ 45.6%n/a26,2491.6%+ 1.9%853Vauxhall Corsa3,4642.3%+ 24.4%733,6412.1%+ 4.7%324VW Polo3,4262.2%n/a8n/an/an/an/an/a5BMW 1 Series3,4242.2%n/an/an/an/an/an/an/a6Kia Sportage3,4222.2%+ 64.4%331,5752.0%+ 19.7%467Peugeot 20083,1452.0%+ 43.5%n/an/an/an/an/an/a8Audi A33,0122.0%+ 38.4%n/a25,4521.6%n/a10n/a9Ford Kuga2,9481.9%+ 49.8%4n/an/an/an/a910Volvo XC402,5771.7%n/an/an/an/an/an/an/an/aHyundai Tucson2,5611.7%+ 56.3%629,9901.9%+ 23.3%67n/aVauxhall Mokka2,5311.6%+ 3.6%n/a25,4731.6%#VALUE!9n/an/aNissan Qashqai2,3701.5%– 43.9%134,9522.2%+ 4.1%21n/aTesla Model Y1,9101.2%+ 47650.0%n/a30,0871.9%+ 45.6%53n/aNissan Juke1,7061.1%n/a927,2531.7%n/a7n/a
Source: SMMT

