
USA October 2023: Market slows its growth to just +1.8%
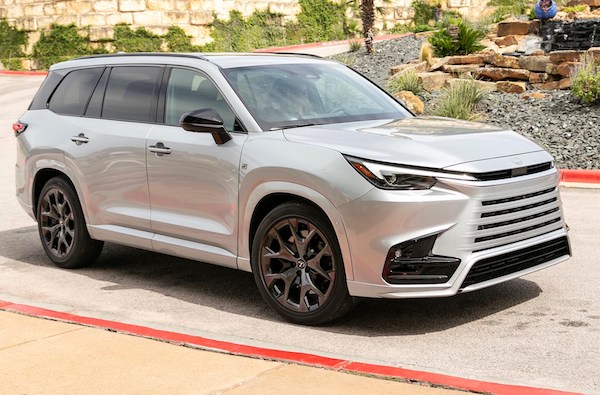
The Lexus TX has landed in the U.S. charts.
The U.S. new light vehicle market grows just 1.8% year-on-year in to an estimated 1.2 million units in October. This is a significant slowing down vs. the previous months of the year (Q3 up 16.7%), due in part by higher interest rates and the effects of the UAW strike, which is estimated to have cost 35,000 deliveries for the month. Near-term prospect remain rosy. The SAAR comes at 15.5 million units vs. 15.28 million in October 2022, and the average daily selling rate is 48,011 vs. 45,444 a year ago. The year-to-date tally is now up 14.4% to 12.9 million. Passenger car sales drop -2.2% year-on-year whereas light trucks climb 2.6% and account for 80% of the market vs. 78% a year ago.
As a reminder a lot of brands now only report quarterly and are excluded from this update. Among the groups still reporting monthly, American Honda (+32.6%), Toyota Motor (+4.5%) beat the market Hyundai-Kia (+2%) matches it whereas Ford Motor (-5.2%) falls. Brand-wise, Toyota (+1.8%) is in line with the overall growth, Ford (-5.2%) underperforms, Honda (+33.9%) posts a brilliant gain, mainly compensating for a weak year-ago result (-16.8% on the prior year). Likewise Honda sales are up 31.8% year-to-date but were down -36.3% over 10 months 2022 vs. 2021. Genesis (+31.5%), Lexus (+24.7%), Acura (+22.1%), Volvo (+19.2%) and Subaru (+10.7%) all shine.
Among models reported monthly, the Ford F-Series (-5.1%) disappoints, whereas the Toyota RAV4 (+20.3%) and Honda CR-V (+53%) shoot up. The RAV4 is only 11,000 sales below the F-Series for the month vs. over 21,000 a year ago in October 2022. The Toyota Camry (-17.2%) is in difficulty but remains above the Toyota Corolla (+33.7%) and Honda Civic (+51.8%), both euphoric. Below, the Ford Edge (+114.6%), Honda HR-V (+55.5%), Hyundai Kona (+37.1%) and Honda Accord (+30.6%) post notable gains. The new Toyota Grand Highlander confirms its success with almost 7,600 sales and we welcome its twin the Lexus TX in the charts.
Previous post: USA Q3 2023: Honda, Nissan, Tesla impress, market up 16.7%
One year ago: USA October 2022: Toyota, Subaru, Mazda shine, sales up 11.5%
Full October 2023 data for selected groups, brands and models below.
USA October 2023 – groups:
GroupOct-23/222023/22Toyota Motor Corporation195,799+ 4.5%1,824,615+ 3.7%Ford Motor Co148,760– 5.2%1,645,634+ 7.7%Hyundai-Kia125,693+ 2.0%1,376,175+ 13.7%American Honda108,088+ 32.6%1,078,763+ 33.2%Subaru53,772+ 10.7%520,995+ 15.9%Mazda23,504– 7.2%296,121+ 23.0%Volvo Cars11,296+ 19.2%103,421+ 26.6%
USA October 2023 – brands:
BrandOct-23/222023/22Toyota168,616+ 1.8%1,573,124+ 2.2%Ford141,886– 5.2%1,579,319+ 8.3%Honda96,934+ 33.9%957,074+ 31.8%Hyundai60,805+ 0.3%655,952+ 11.4%Kia59,164+ 1.5%663,838+ 15.2%Subaru53,772+ 10.7%520,995+ 15.9%Lexus27,183+ 24.7%251,491+ 14.1%Mazda23,504– 7.2%296,121+ 23.0%Volvo11,296+ 19.2%103,421+ 43.2%Acura11,154+ 22.1%121,689+ 45.2%Lincoln6,874– 4.5%66,315– 5.4%Genesis5,724+ 31.5%56,385+ 24.7%
USA October 2023 – models:
ModelOct-23/222023/22Ford F-Series53,509– 5.1%626,879+ 19.7%Toyota RAV442,226+ 20.3%345,057+ 2.0%Honda CR-V31,397+ 53.0%293,748+ 47.5%Toyota Camry24,596– 17.2%242,571– 0.6%Toyota Corolla22,272+ 33.7%187,965– 0.1%Toyota Tacoma17,456– 17.1%197,137+ 0.1%Honda Civic17,228+ 51.8%164,109+ 52.5%Ford Explorer16,634+ 4.7%154,766– 10.1%Hyundai Tucson15,638+ 3.8%168,818+ 20.0%Subaru Forester15,479+ 29.5%121,824+ 33.3%Honda Accord 15,346+ 30.6%167,548+ 37.1%Subaru Crosstrek13,768+ 1.0%128,400– 0.4%Ford Escape12,573+ 26.2%116,186– 2.6%Subaru Outback12,396+ 3.4%135,277+ 15.2%Honda HR-V11,696+ 55.5%98,730– 1.3%Kia Sportage11,053– 6.9%118,637+ 16.8%Ford Edge11,015+ 114.6%81,716+ 12.3%Toyota 4Runner10,344– 8.7%96,938– 7.5%Toyota Tundra10,330+ 11.0%103,018+ 22.9%Hyundai Santa Fe9,700– 10.2%105,862+ 9.2%Toyota Highlander9,536– 46.9%147,714– 19.0%Ford Maverick9,530+ 3.2%75,960+ 24.5%Hyundai Elantra9,456+ 10.9%116,759+ 23.7%Kia Forte9,393+ 5.0%105,528+ 16.0%Lexus RX8,591+ 4.1%92,082+ 4.0%Kia Telluride8,533+ 4.3%92,514+ 15.0%Ford Bronco Sport8,306+ 12.7%104,681+ 19.8%Honda Pilot8,223– 7.0%90,620+ 9.5%Ford Transit8,142– 23.6%106,194+ 34.4%Mazda CX-57,963– 15.7%123,818– 1.3%Hyundai Kona7,927+ 37.1%64,445+ 25.2%Toyota Grand Highlander7,571new31,947newToyota Corolla Cross7,446+ 0.4%56,606+ 26.0%Hyundai Palisade7,071+ 22.4%65,928– 5.2%Lexus NX6,930+ 24.7%58,615+ 57.5%Kia Sorento6,388– 12.7%74,014+ 2.9%Toyota Sienna6,343– 16.2%54,096– 5.5%Mazda CX-305,908– 11.4%65,210+ 48.0%Honda Odyssey5,500+ 13.1%61,859+ 72.5%Kia K55,200+ 6.9%54,794– 6.2%Ford Bronco4,805– 56.0%96,273– 1.1%Ford Expedition4,704– 23.1%61,131+ 28.1%Subaru Ascent4,374– 13.0%51,255+ 0.4%Kia Seltos4,355– 2.6%51,414+ 40.3%Ford Mustang4,270+ 11.0%39,585– 2.1%Ford E-Series4,218+ 14.2%34,720+ 34.0%Acura RDX4,200+ 169.7%31,402+ 47.5%Kia Soul4,192– 12.3%54,263+ 10.2%Honda Ridgeline4,133+ 6.9%43,701+ 20.8%Mazda CX-903,722new20,990newAcura MDX3,638– 10.2%48,557+ 30.3%Kia Carnival3,507+ 171.6%36,680+ 111.4%Honda Passport3,411– 5.7%36,758+ 7.4%Volvo XC603,307– 8.4%32,457+ 10.5%Mazda CX-503,168+ 20.5%34,887+ 118.0%Lexus ES3,093+ 3.1%32,034– 9.4%Volvo XC902,999+ 9.4%31,419+ 12.1%Hyundai Ioniq 52,979+ 88.7%28,285+ 40.9%Toyota Venza2,896– 21.8%24,983– 6.9%Lexus GX2,852+ 30.4%24,344– 1.3%Volvo XC402,764+ 44.9%22,392+ 63.1%Ford Mustang Mach E2,732– 10.6%31,614+ 1.5%Subaru Impreza2,662– 7.0%29,826+ 17.0%Hyundai Santa Cruz2,555– 15.1%31,638+ 6.1%Kia Rio2,544+ 44.0%23,740+ 7.7%Hyundai Sonata2,460– 63.8%39,801– 5.3%Kia Niro2,408– 23.9%31,493+ 44.0%Lincoln Corsair2,353– 9.2%19,836– 13.3%Acura Integra2,336– 11.4%27,170+ 213.2%Mazda32,205– 20.6%25,569+ 12.4%Subaru Legacy2,172+ 88.1%21,794+ 19.0%Genesis GV702,059+ 33.4%20,829+ 40.3%Toyota Sequoia1,976+ 100.0%17,766+ 1088.4%Lincoln Aviator1,911– 3.3%11,587– 37.9%Toyota Crown1,907new14,961newGenesis GV801,790+ 24.7%15,473+ 10.1%Hyundai Venue1,757+ 19.9%24,626+ 16.9%Lexus IS1,685+ 13.2%18,853+ 5.8%Volvo S601,623+ 235.3%7,715+ 52.7%Kia EV61,542+ 30.0%16,340– 12.9%Toyota Prius1,452– 50.5%29,342+ 11.2%Subaru WRX1,420– 14.7%21,994+ 52.9%Lexus TX1,384new1,384newToyota bZ4X1,326n/a7,812+ 3224.3%Lincoln Nautilus1,318– 0.9%20,215+ 11.5%Lincoln Navigator1,292– 0.6%14,677+ 40.4%Hyundai Ioniq 61,239new9,557newSubaru Solterra1,210new6,973newFord Transit Connect995– 44.5%15,119– 31.2%Genesis G70982+ 42.9%11,665+ 9.6%Acura TLX980+ 13.2%14,553+ 45.2%Lexus UX851+ 36.4%10,225+ 20.7%Toyota GR86794+ 20.3%9,531– 7.9%Lexus RZ743new3,254newLexus LX594+ 304.1%5,868+ 105.5%Mazda MX-5 Miata531+ 28.6%8,100+ 62.5%Genesis G80472+ 23.2%4,757+ 33.7%Ford Ranger453– 88.7%31,956– 36.5%Genesis GV60353+ 75.6%2,571+ 107.2%Volvo C40304– 33.3%6,090+ 115.0%Subaru BRZ291+ 4.7%3,652+ 34.9%Lexus LS169– 27.8%1,894– 14.8%Volvo V60152– 7.3%1,566+ 40.4%Lexus LC149+ 46.1%1,480+ 35.2%Lexus RC142– 30.7%1,456– 32.4%Volvo S9096+ 20.0%1,318+ 26.0%Toyota Supra85– 82.5%2,182– 49.7%Genesis G9068– 34.0%1,090+ 22.6%Toyota Mirai57– 62.5%2,661+ 67.5%Volvo V9051+ 54.5%464– 12.8%Kia Stinger49– 88.6%5,421– 23.4%Hyundai Nexo23– 23.3%196– 47.7%Mazda CX-97– 99.8%17,447– 35.0%Toyota Avalon3– 93.5%55– 99.5%
Source: Manufacturers
More Stories
2026 Kia EV6 Pricing: The EV That Just Got $5,900 Cheaper and Is Still Selling at Sticker
If you are shopping for a 2026 Kia EV6 and want to know what dealers are actually charging, what a...
2027 Genesis GV80 Pricing: What to Expect on a Carryover Model With a Modest Price Increase
The 2027 Genesis GV80 is confirmed on Genesis’s own official Build and Price configurator at a starting MSRP of $58,850,...
2026 Audi Q3 Pricing: What Real Buyers Are Paying on Audi’s All-New Single-Trim Subcompact Luxury SUV
The 2026 Audi Q3 is genuinely all-new, and it arrives with a buying structure unlike anything else covered in this...
2027 Genesis GV60 Magma Priced at $69,950 as Brand’s First High-Performance EV
Genesis has officially put a price on its first true high-performance model, and the 2027 GV Magma will start at $69,950...
2028 Mercedes-Benz GLA Goes Electric First With Hybrid Models to Follow
Mercedes-Benz is taking its entry-level SUV into a new era with the redesigned 2028 GLA, and the biggest change is...
2026 Mercedes-Benz GLS Pricing: What Real Buyers Are Paying on the Three-Row Flagship That Floats Over Bad Pavement
The Mercedes-Benz GLS is the full-size, three-row expression of the GLE, and TrueCar’s description of it is the most precise...