
Italy October 2023: Jeep Avenger up to #4, market up 20%
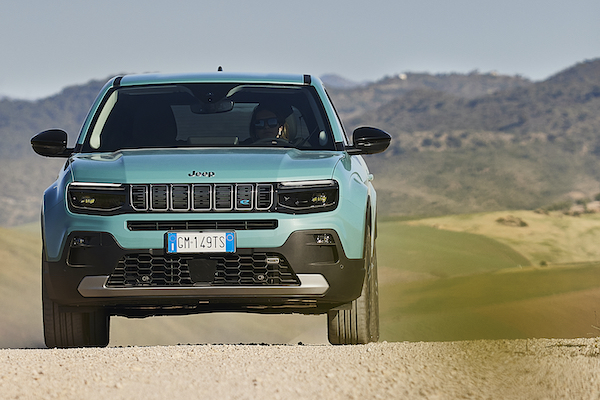
The Jeep Avenger BEV (pictured) only accounts for 5% of the nameplate’s volume.
New car sales in Italy jump 20% year-on-year in October to 139,052, lifting the year-to-date tally up 20.5% to 1,315,964. Private sales are up 21.4% to 83,122 and up 12.9% to 738,158 year-to-date, self registrations shoot up 70.4% to 16,220 for the month and up 41.2% to 132,982 year-to-date, long term leases edge up 4.9% to 31,263 and up 32.4% to 326,361 YTD, short term rentals actually drop -16.7% for the month to 1,863 but are up 27.2% YTD to 59,200 and company sales gain 22.6% to 9,262 and 19.7% YTD to 78,672.
Petrol sales are up 21% to 39,018 and up 22.6% YTD to 376,065, diesel slides -1.9% to 21,564 but gains 9.9% YTD to 244,295, LPG soars 35.5% to 14,041 and up 26.2% YTD to 119,951, HEVs are up 29.6% to 55,321 and up 27.8% YTD to 481,832. That includes 16,316 full hybrids (+40.7%) and 39,005 mild hybrids (+25.5%) for the month, 129,653 (+30.7%) and 352,179 (+26.8%) respectively year-to-date. Meanwhile PHEVs drop -4.3% to 5,853 in October but gain 7.4% to 59,907 year-to-date. Finally BEVs advance 57.3% to 5,814 and 4.1% share vs. 3.1% a year ago and up 30.3% YTD to 51,877 and 3.9% share vs. 3.6% over the same period in 2022. These are among the lowest BEV market shares in Europe.
In the brands ranking, for once Fiat (+21.4%) manages to keep up with its home market and gain market share year-on-year to 11.7% vs. 11.3% so far this year. Toyota (+9.6%) repeats at #2 with a solid score given it had broken all its record a year ago in October 2022. Volkswagen (+12.9%) is stuck in third place but has an unsurmountable advantage over Toyota in the year-to-date charts. Dacia (+62.5%) posts the largest year-on-year gain in the Top 15 and notches a fourth Top 4 finish in the past 5 months. Renault (+31.6%) is also in great shape at #5 with Jeep (+36.8%) the only remaining Top 10 member to beat the market.
Model-wise, the Fiat Panda (+32.3%) outpaces the market to reach a splendid 7.9% share vs. 6.4% year-to-date where it is down -3.9%. The Dacia Sandero (+114.8%) confirms it is “the best of the rest” by reinforcing its 2nd place overall with 3.8% share vs. 3.1% so far this year where it climbs up 50.9%. The Lancia Ypsilon (+15.4%) is back to the third place it holds year-to-date with 3% of the market. The event of the month is the Jeep Avenger breaking records again to land at #4 with 2.5% share. Note 95% of its sales are its petrol variant, with the EV variant only accounting for 5% of its volume both for the month and year-to-date. The Fiat 500X (+152.6%), Renault Captur (+60.4%) and Toyota Yaris Cross (+35.8%) also shine in the remainder of the Top 10.
Previous month: Italy September 2023: Jeep Avenger cracks Top 10, sales up 22.8%
One year ago: Italy October 2022: Toyota breaks all records in market up 14.6%
Full October 2023 Top 46 brands and Top 50 models below.
Italy October 2023 – brands:
PosBrandOct-23%/22Sep2023%/22PosFY221Fiat16,23611.7%+ 21.4%1148,96311.3%– 2.2%112Toyota9,8967.1%+ 9.6%281,4316.2%+ 8.8%333Volkswagen9,7507.0%+ 12.9%3102,9387.8%+ 19.4%224Dacia8,0775.8%+ 65.2%772,5685.5%+ 31.4%465Renault7,6855.5%+ 31.6%465,2545.0%+ 32.5%776Ford6,8214.9%+ 3.2%570,0395.3%+ 9.9%547Jeep6,8184.9%+ 36.8%861,6874.7%+ 46.1%8108Audi5,7814.2%+ 6.3%1057,1784.3%+ 27.2%999Peugeot5,4243.9%+ 6.0%669,6385.3%+ 18.6%6510BMW5,3533.8%+ 11.2%1149,1933.7%+ 26.2%101111Citroen5,1503.7%– 4.2%1244,9493.4%– 7.7%11812Mercedes4,6853.4%+ 5.2%942,5643.2%+ 13.6%121213Hyundai4,3233.1%+ 17.1%1440,1853.1%+ 19.2%141514Kia4,2513.1%+ 4.8%1340,2483.1%+ 14.6%131415Lancia4,2233.0%+ 15.6%1637,8812.9%+ 8.9%161616Suzuki3,6452.6%+ 110.8%1729,8122.3%+ 73.5%182017Nissan3,5432.5%+ 99.3%1830,0402.3%+ 40.0%171718Opel3,2882.4%– 4.3%1539,1333.0%+ 1.0%151319MG2,8112.0%+ 89.7%2023,8651.8%+ 331.2%203020Skoda2,6881.9%+ 46.5%1928,0502.1%+ 36.0%191821Alfa Romeo2,4341.8%+ 48.2%2122,5451.7%+ 102.2%212322Cupra1,6401.2%+ 59.5%2214,1971.1%+ 45.3%252523Mazda1,6201.2%+ 103.3%2312,9781.0%+ 71.8%262624DR Motor1,4051.0%– 47.9%2721,0561.6%+ 10.2%221925Volvo1,3381.0%– 9.3%2414,3511.1%+ 24.3%242226Mini1,2480.9%– 37.6%2615,7681.2%+ 15.5%232127Land Rover1,1780.8%+ 61.8%258,8680.7%+ 29.5%292728Seat1,1270.8%+ 34.5%2810,6400.8%– 6.2%282429EVO1,0380.7%+ 704.6%325,6230.4%+ 71.6%323530Porsche9380.7%+ 62.8%316,4970.5%+ 20.3%302931Honda9320.7%+ 31.6%295,5620.4%– 16.4%332832Tesla9080.7%+ 2926.7%3012,9401.0%+ 229.6%273233Smart6810.5%+ 44.9%354,1510.3%+ 7.6%343334DS4640.3%– 1.3%336,2240.5%+ 30.8%313135Lexus3540.3%+ 44.5%343,1530.2%+ 17.8%373636Maserati3090.2%– 13.2%363,3720.3%+ 57.4%353737Subaru2270.2%+ 108.3%382,2050.2%+ 58.7%384038Jaguar1620.1%– 8.5%371,5990.1%– 20.6%393939Lynk & Co1250.1%– 86.6%403,3610.3%– 0.5%363440Ferrari610.0%+ 48.8%435850.0%– 1.0%434241Mitsubishi550.0%– 51.8%419820.1%– 49.9%403842Polestar380.0%+ 137.5%398050.1%+ 4931.2%41n/a43Mahindra310.0%– 41.5%446040.0%– 14.3%424144SsangYong290.0%+ 61.1%422800.0%– 17.6%454345Lamborghini190.0%– 45.7%453290.0%+ 11.9%444446Aston Martin100.0%+ 150.0%46870.0%+ 89.1%4645 –Others2330.2%+ 468.3% –1,5860.1%+ 69.1% – –
Italy October 2023 – models:
PosModelOct-23%/22Sep2023%/22PosFY221Fiat Panda11,0307.9%+ 32.3%184,3986.4%– 3.9%112Dacia Sandero5,3123.8%+ 114.8%241,2743.1%+ 50.9%243Lancia Ypsilon4,2263.0%+ 15.4%437,8832.9%+ 8.9%324Jeep Avenger3,5142.5%new817,2381.3%new21 –5Toyota Yaris Cross3,5132.5%+ 35.8%529,2132.2%+ 33.7%596Citroen C33,3522.4%+ 13.3%625,4011.9%– 8.6%1157Renault Captur3,1352.3%+ 60.4%1325,5791.9%+ 17.4%10118Ford Puma2,5611.8%– 12.2%925,5881.9%+ 0.9%979Fiat 500X2,4251.7%+ 152.6%1924,6901.9%+ 20.0%121410Renault Clio2,3941.7%+ 6.2%1119,9601.5%+ 41.5%151811VW T-Roc2,3811.7%+ 34.1%727,2382.1%+ 29.5%61312MG ZS2,3101.7%+ 74.2%1415,6851.2%n/a25n/a13Peugeot 2082,2761.6%+ 41.7%1020,7851.6%– 7.2%131014Dacia Duster2,2401.6%+ 22.0%1725,6371.9%+ 20.8%81215Jeep Renegade2,1461.5%– 39.8%2226,7002.0%+ 12.3%7616Fiat 5002,1231.5%– 27.8%330,2082.3%+ 0.9%4317VW T-Cross2,1101.5%+ 15.8%2117,9971.4%+ 15.5%191618Peugeot 20081,9511.4%+ 22.2%1219,4161.5%+ 36.0%182019VW Polo1,9241.4%+ 159.0%2515,3011.2%+ 28.2%272620Kia Sportage1,8741.3%+ 39.9%2316,7011.3%+ 50.8%222321Toyota Aygo X1,7581.3%– 15.4%1511,7990.9%+ 2.5%322122Opel Corsa1,7431.3%+ 34.6%1620,1181.5%+ 27.5%141723Toyota Yaris1,7261.2%– 25.3%1819,8971.5%– 9.0%16824Nissan Qashqai1,6581.2%+ 71.5%2016,6721.3%+ 54.8%232925Alfa Romeo Tonale1,6511.2%+ 102.8%2715,8811.2%+ 428.7%24n/a26BMW X11,6151.2%+ 122.8%3511,5090.9%+ 33.7%343827Suzuki Ignis1,5881.1%+ 451.4%378,9550.7%+ 84.3%44n/a28Ford Focus1,4841.1%+ 84.3%3914,0391.1%+ 92.1%284429Ford Kuga1,3981.0%+ 62.7%2615,3951.2%+ 29.8%262430Jeep Compass1,3281.0%– 7.7%2419,4481.5%+ 2.0%171531Hyundai i101,2420.9%+ 16.4%3011,7250.9%+ 24.0%333532VW Tiguan1,2280.9%+ 3.5%3313,9671.1%+ 59.9%293233Mercedes GLA1,2150.9%– 9.7%289,5960.7%+ 16.6%403734Hyundai Tucson1,1440.8%– 6.7%3612,2000.9%+ 23.7%313035Nissan Juke1,1410.8%n/a298,8550.7%n/a45n/a36Cupra Formentor1,1370.8%+ 27.8%3210,9250.8%+ 26.1%363937Audi A31,1350.8%+ 10.0%439,4400.7%– 1.7%423338Audi Q31,1190.8%– 13.9%3113,6541.0%+ 28.0%302539Kia Picanto1,0780.8%– 7.0%3410,1810.8%+ 10.0%373640Ford Fiesta1,0650.8%– 5.1%4210,1540.8%+ 22.3%384041Citroen C3 Aircross1,0470.8%– 20.7%3811,3590.9%– 9.3%352242Nissan X-Trail8740.6%+ 765.3%n/an/an/an/an/an/a43Audi A18730.6%+ 38.6%418,4700.6%+ 88.4%46n/a44Mazda CX-308710.6%n/an/an/an/an/an/an/a45Toyota RAV48660.6%n/a46n/an/an/an/an/a46Renault Austral8620.6%newn/an/an/anewn/a n/a47Opel Mokka8430.6%– 23.6%509,6470.7%– 5.7%393448Suzuki Vitara8430.6%+ 8.6%n/a8,2350.6%n/a47n/a49Audi Q57860.6%+ 1.0%n/a8,0420.6%+ 32.3%50n/a50Toyota Corolla7730.6%n/an/an/an/an/an/an/an/aPeugeot 30086960.5%– 41.6%n/a17,6141.3%+ 22.0%2019n/aFiat Tipo6470.5%– 44.5%409,5910.7%+ 3.6%4128n/aMini Countryman5730.4%– 39.7%n/a8,1460.6%n/a4849n/aVW Taigo5490.4%– 18.7%n/a8,0590.6%+ 11.1%4948n/aVW Golf3970.3%– 71.8%499,2610.7%– 14.7%4327
Source: UNRAE


More Stories
2026 Kia EV6 Pricing: The EV That Just Got $5,900 Cheaper and Is Still Selling at Sticker
If you are shopping for a 2026 Kia EV6 and want to know what dealers are actually charging, what a...
2027 Genesis GV80 Pricing: What to Expect on a Carryover Model With a Modest Price Increase
The 2027 Genesis GV80 is confirmed on Genesis’s own official Build and Price configurator at a starting MSRP of $58,850,...
2026 Audi Q3 Pricing: What Real Buyers Are Paying on Audi’s All-New Single-Trim Subcompact Luxury SUV
The 2026 Audi Q3 is genuinely all-new, and it arrives with a buying structure unlike anything else covered in this...
2027 Genesis GV60 Magma Priced at $69,950 as Brand’s First High-Performance EV
Genesis has officially put a price on its first true high-performance model, and the 2027 GV Magma will start at $69,950...
2028 Mercedes-Benz GLA Goes Electric First With Hybrid Models to Follow
Mercedes-Benz is taking its entry-level SUV into a new era with the redesigned 2028 GLA, and the biggest change is...
2026 Mercedes-Benz GLS Pricing: What Real Buyers Are Paying on the Three-Row Flagship That Floats Over Bad Pavement
The Mercedes-Benz GLS is the full-size, three-row expression of the GLE, and TrueCar’s description of it is the most precise...