
Switzerland May 2024: BMW topples VW, now #1 year-to-date
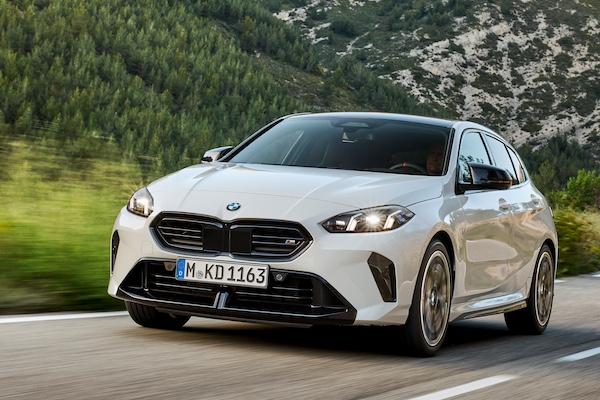
BMW 1 Series sales more than double year-on-year in May. Next generation pictured.
The Swiss new car market edges down -1.4% year-on-year in May to 21,265 sales, leading to a stable year-to-date tally at 98,529 units vs. 98,538 over the same period in 2023. 4×4 sales gain 2.6% to 11,070 and 52.1% share vs. 50% a year ago and are up 4.4% year-to-date to 51,852 and 52.6% share vs. 50.4% last year. Petrol is down -8% to 6,9881 and 32.4% share vs. 34.7% in May 2023, diesel actually jumps up 12% to 2,440 and 11.5% vs .10.1%, HEVs are up 11.8% to 6,595 and 31% share vs. 27.4%, PHEVs up 5.7% to 1,779 and 8.4% share vs. 7.8% but BEVs sink -17.3% to 3,568 and 16.8% share vs. 20% a year ago. Year-to-date BEV sales are down -4.3% to 17,171 and 17.4% share vs. 18.2% over the first five months of 2023.
BMW (+30%) sports a fantastic gain to climb up to #1 brand with 10.7% share. In the process the German manufacturer snaps the YTD top spot, toppling Volkswagen (-1.7%). Leader last month for only the 2nd time ever, Skoda (-4.6%) falls to #3 with a still strong 9.5% share. Mercedes (+7.9%) defies the negative market to rank #4 ahead of Audi (-9.3%) and Toyota (-9.8%) both weak. Volvo (+53.5%), Renault (+24.9%), Dacia (+10.8%) and Hyundai (+9.1%) also impress in the remainder of the Top 10. Tesla is down -43.3% to #16.
The Skoda Octavia (-8.5%) lodges its third monthly win of the year with 2.6% share and despite a sizeable year-on-year drop. The next four models all improve by double-digits: the Audi 3 is up 46.8% to #2, followed by the BMW X1 (+59.4%), Mercedes GLC (+93.8%) and VW Tiguan (+83.4%). The BMW 1 Series is up 110.1% year-on-year and 34 spots on April to #9, with the Dacia Sandero (+20.2%) also strong at #7. Still leader year-to-date, the Tesla Model Y (-43%) is down to #6 this month. The new Volvo EX30 is down four ranks on last month to a still outstanding 8th place and now ranks #14 year-to-date.
Previous month: Switzerland April 2024: Skoda #1 for 2nd time ever, hits record share, Volvo EX30 up to #4
One year ago: Switzerland May 2023: Skoda places three models in YTD Top 5
Full May 2024 Top 60 All brands and Top 360 All models below.
Switzerland May 2024 – brands:
PosBrandMay-24%/23Apr2024%/23PosFY231BMW2,28010.7%+ 30.0%39,4139.6%+ 15.5%122Volkswagen2,19310.3%– 1.7%29,3829.5%– 7.7%213Skoda2,0109.5%– 4.6%18,9549.1%+ 4.6%334Mercedes1,7278.1%+ 7.9%47,7247.8%– 6.4%455Audi1,6287.7%– 9.3%56,4656.6%– 22.2%546Toyota8924.2%– 9.8%65,4555.5%– 0.6%667Renault8684.1%+ 24.9%143,0303.1%– 5.2%1298Volvo8213.9%+ 53.5%73,8043.9%+ 28.1%8129Hyundai7763.6%+ 9.1%83,4473.5%+ 4.5%91010Dacia6453.0%+ 10.8%93,3033.4%+ 1.6%101111Seat6152.9%– 4.4%132,7262.8%– 3.8%141312Kia6062.8%+ 25.2%122,7102.8%+ 4.7%151413Porsche5972.8%+ 63.6%102,7502.8%+ 27.9%131814Ford5952.8%– 36.8%113,2333.3%– 26.2%11715Mazda5832.7%+ 64.2%181,8741.9%+ 0.8%171916Tesla5212.5%– 43.3%164,2354.3%+ 43.3%7817Suzuki4932.3%+ 15.7%151,8261.9%+ 7.3%182018Peugeot4131.9%– 9.2%172,0652.1%– 9.1%161519Mini3191.5%– 22.9%241,3431.4%– 18.2%222220Citroen2871.3%+ 26.4%231,2411.3%+ 13.1%232421Honda2771.3%+ 75.3%191,5481.6%+ 88.1%212622Fiat2671.3%– 35.4%211,7251.8%+ 8.6%192123Opel2591.2%– 43.9%221,5581.6%+ 2.9%201724Land Rover2291.1%+ 64.7%201,1181.1%+ 43.7%262825Cupra2091.0%– 47.0%271,0041.0%– 51.0%271626Mitsubishi1940.9%+ 26.8%251,1831.2%+ 58.4%252727Nissan1090.5%– 73.9%261,1841.2%– 1.6%242328Subaru1080.5%– 37.2%286210.6%– 6.1%282929Lexus960.5%+ 35.2%293950.4%+ 71.0%303230Smart730.3%+ 151.7%313900.4%+ 261.1%313331Alfa Romeo690.3%– 60.6%323650.4%– 37.1%323032Jeep680.3%– 62.0%304920.5%– 49.9%292533Maserati520.2%+ 0.0%361580.2%– 35.5%353634Ferrari510.2%– 8.9%332270.2%+ 0.9%333735Jaguar360.2%+ 9.1%341450.1%– 18.1%373836Polestar360.2%– 65.4%451270.1%– 57.1%393137KGM330.2%new44440.0%new44 –38DS300.1%– 58.3%351430.1%– 48.4%383539SsangYong240.1%+ 26.3%371860.2%+ 84.2%343940Aston Martin230.1%+ 53.3%41860.1%+ 48.3%414341Lamborghini210.1%– 12.5%401180.1%+ 6.3%404042Genesis190.1%– 78.7%391450.1%– 44.4%363443Cadillac170.1%+ 70.0%52280.0%– 12.5%484844Bentley140.1%+ 7.7%38750.1%+ 5.6%424245Alpine110.1%– 42.1%42570.1%+ 58.3%434446Aiways80.0%+ 100.0%43430.0%+ 79.2%455147Ineos70.0%– 53.3%46350.0%+ 94.4%474648JAC40.0%– 76.5%55420.0%– 40.8%464149Lotus40.0%– 73.3%48270.0%– 40.0%494750Dodge40.0%+ 300.0%56220.0%+ 1000.0%504951McLaren40.0%+ 0.0%49160.0%+ 6.7%535252Rolls-Royce30.0%+ 0.0%51180.0%– 10.0%525053Man30.0%+ 50.0% –60.0%+ 0.0%585454Chevrolet20.0%– 50.0%47190.0%– 32.1%514555Morgan20.0%+ 100.0%57150.0%+ 87.5%545556Lucid10.0%n/a5380.0%+ 700.0%565357Caterham10.0%n/a5460.0%+ 500.0%575858Maxus10.0%n/a –10.0%n/a605959MG00.0%new50120.0%new55 –60Bugatti00.0%– 100.0%5810.0%– 80.0%5957
Switzerland May 2024 – models:
PosModelMay-24%/23Apr2024%/23PosFY231Skoda Octavia5522.6%– 8.5%13,0113.1%+ 59.1%232Audi Q34992.3%+ 46.8%71,5171.5%– 13.4%643BMW X14432.1%+ 59.4%21,7881.8%+ 21.4%394Mercedes GLC4091.9%+ 93.8%61,7201.7%+ 23.8%585VW Tiguan3871.8%+ 83.4%31,7671.8%+ 52.6%456Tesla Model Y3291.5%– 43.0%53,2483.3%+ 56.9%117Dacia Sandero3211.5%+ 20.2%81,3711.4%+ 11.4%7158Volvo EX303001.4%new411781.2%new143789BMW 1 Series2921.4%+ 110.1%431,0111.0%+ 84.8%174310Skoda Kodiaq2901.4%– 5.8%111,2371.3%– 1.4%101711VW Golf2871.3%+ 24.8%101,3001.3%+ 7.3%91012Skoda Karoq2861.3%+ 2.1%121,3511.4%– 17.4%81213Porsche Macan2611.2%+ 153.4%149751.0%+ 27.6%214914Skoda Fabia2601.2%+ 30.7%139180.9%– 1.9%263515BMW 3 Series2491.2%+ 60.6%171,0501.1%+ 44.8%162916Audi A32411.1%– 18.6%181,2101.2%– 12.4%121417Toyota Yaris2411.1%+ 8.6%91,2181.2%+ 15.7%111918Suzuki Swift2411.1%+ 68.5%336370.6%+ 14.4%495719VW ID.32401.1%+ 8.6%497570.8%– 13.3%412320Audi Q42311.1%– 9.8%197700.8%– 38.3%40721Skoda Kamiq2311.1%+ 56.1%396030.6%– 5.5%515922Hyundai Kona2271.1%+ 31.2%209391.0%+ 64.2%234223Kia Sportage2221.0%+ 21.3%359360.9%+ 28.9%243424Ford Kuga2181.0%+ 0.5%488480.9%– 7.9%313125VW T-Roc2141.0%– 9.3%319841.0%– 5.2%201826Mini Hatch (incl Cabrio, Clubman)2131.0%– 29.7%239901.0%– 11.9%192027VW T62131.0%+ 97.2%685220.5%+ 9.0%657928Volvo XC602081.0%+ 45.5%371,0941.1%+ 49.0%152829VW Polo2051.0%– 31.4%259220.9%– 29.9%25630Skoda Enyaq2041.0%– 44.7%161,1931.2%– 20.5%13231BMW X31950.9%+ 3.7%261,0061.0%– 24.4%181332BMW X51860.9%+ 39.8%478260.8%+ 16.5%344033Mazda21850.9%+ 140.3%595590.6%+ 15.0%618634Seat Ibiza1840.9%– 16.4%417770.8%+ 17.2%386135Peugeot 3081830.9%– 14.9%388290.8%+ 32.6%335836Fiat 5001710.8%– 46.6%428750.9%– 33.7%271637Mazda CX-51700.8%+ 93.2%715230.5%+ 17.3%647138Citroen C31640.8%+ 187.7%815610.6%+ 112.5%5911439Volvo XC401630.8%– 31.5%247860.8%– 41.7%371140Tesla Model 31610.8%+ 1.3%1087720.8%+ 49.0%394741Dacia Duster1570.7%– 29.6%349451.0%– 24.8%222242Mercedes GLA1550.7%– 2.5%447070.7%– 12.5%463843Porsche 9111540.7%+ 8.5%158650.9%+ 34.7%286544Renault Captur1540.7%+ 83.3%1393650.4%+ 1.1%868245Hyundai Tucson1530.7%+ 5.5%367300.7%+ 10.4%433946BMW 2 Series1520.7%– 10.1%467230.7%– 13.4%442747Audi Q51480.7%– 27.5%884910.5%– 47.9%683348Dacia Jogger1460.7%+ 78.0%558290.8%+ 38.6%324149Mercedes GLE1440.7%+ 21.0%546430.7%– 16.4%484850Seat Leon1440.7%+ 21.0%785720.6%+ 53.8%575351Seat Ateca1420.7%– 14.5%218620.9%– 19.2%292452Renault Clio1390.7%+ 52.7%308020.8%+ 92.3%357453Mercedes V Class1380.6%+ 11.3%965050.5%– 9.5%666254Renault Scénic1380.6%+ 375.9%2741660.2%+ 86.5%15122455Audi Q21360.6%+ 18.3%297300.7%+ 50.8%426456Opel Astra1320.6%+ 6.5%406310.6%+ 156.5%5010057Toyota Yaris Cross1280.6%– 35.7%528620.9%– 16.6%302558Cupra Formentor1250.6%– 43.7%587880.8%– 36.1%362159Mercedes C Class1250.6%– 16.7%286850.7%– 1.4%475060Ford Puma1240.6%– 27.1%277210.7%– 22.3%453061VW T-Cross1240.6%– 4.6%775290.5%– 1.3%638062VW ID.41210.6%– 14.8%803560.4%– 50.5%883763BMW ix11200.6%– 13.7%455740.6%+ 69.8%565664Mercedes E Class1160.5%+ 136.7%633990.4%+ 44.0%8210865Audi A11150.5%– 22.3%605600.6%– 16.3%604466Toyota Corolla1150.5%– 5.7%325850.6%– 24.4%555467Mercedes A Class1140.5%– 46.2%575960.6%– 32.4%523268BMW 4 Series1120.5%– 10.4%863430.3%– 35.9%958369VW Caddy1110.5%+ 4.7%724330.4%– 24.8%748770Toyota RAV41110.5%+ 48.0%565890.6%+ 14.4%536771VW T71090.5%+ 12.4%695040.5%+ 26.3%678572Mitsubishi Space Star1080.5%+ 9.1%654840.5%+ 11.8%706373Mini Countryman1050.5%– 5.4%853520.4%– 32.0%927074Hyundai i201030.5%+ 47.1%644880.5%+ 66.0%696975Suzuki Ignis1020.5%+ 32.5%704100.4%+ 19.9%7810576Hyundai Ioniq 5990.5%– 16.8%834050.4%– 45.1%806877Skoda Scala980.5%+ 5.4%662830.3%– 18.7%10711778Porsche Cayenne980.5%+ 188.2%825870.6%+ 92.5%5411979Honda HR-V950.4%+ 150.0%505570.6%+ 220.1%6212580Toyota C-HR910.4%+ 40.0%225630.6%+ 17.5%587381Kia Picanto900.4%+ 136.8%982510.3%+ 27.4%11512982Skoda Superb890.4%– 16.0%533580.4%+ 0.3%879583BMW X2870.4%+ 148.6%912560.3%+ 106.5%11320184Renault Austral860.4%– 33.8%1133440.3%– 30.8%947285Range Rover Sport850.4%+ 240.0%613900.4%+ 209.5%8316886Cupra Born840.4%– 51.2%1072160.2%– 73.5%1312687BMW 5 Series840.4%+ 13.5%1482850.3%– 17.2%10610288Seat Arona830.4%+ 31.7%1651800.2%– 48.4%14512789Hyundai i10830.4%+ 43.1%793530.4%+ 30.7%9012390Audi Q8810.4%– 56.9%1003540.4%– 31.0%894691Mercedes EQA800.4%– 35.0%674070.4%– 32.4%795592Peugeot 208780.4%+ 9.9%514020.4%– 35.4%815193Mazda CX-30770.4%– 3.8%1012900.3%– 17.4%10410694Renault Espace750.4%+ 837.5%1232900.3%+ 480.0%10516795Suzuki Vitara730.3%+ 32.7%903700.4%+ 36.5%8410196Kia Cee’d680.3%– 1.4%1172530.3%– 29.9%11410497Ford Focus670.3%– 70.9%924570.5%– 50.2%714598Volvo XC90650.3%– 5.8%1203700.4%+ 25.9%859499Kia Niro650.3%+ 4.8%973320.3%– 9.8%9890100Mercedes GLB630.3%– 1.6%933440.3%– 4.4%9398101Seat Tarraco620.3%– 15.1%893350.3%– 1.5%9677102VW Touran620.3%+ 1.6%624250.4%+ 24.6%7581103Mazda CX-60620.3%+ 37.8%1302300.2%– 1.7%123116104Ford Connect610.3%+ 74.3%1272420.2%+ 56.1%119149105Renault Mégane560.3%– 61.1%744110.4%– 38.9%7736106Audi A6560.3%– 17.6%1532040.2%– 33.1%135110107Suzuki SX4 S-Cross550.3%– 59.0%753240.3%– 29.7%9988108Mercedes Vito540.3%+ 14.9%873520.4%+ 57.1%91128109Peugeot 3008530.2%+ 32.5%1242460.2%+ 8.8%117126110Audi A4520.2%– 45.3%1033160.3%– 35.8%10192111Opel Mokka510.2%– 32.9%1861380.1%– 63.9%16476112BMW ix2510.2%new1212220.2%new126 –113Mercedes CLE510.2%new1831030.1%new190303114Mitsubishi Colt490.2%new942700.3%new110246115Honda Jazz480.2%– 26.2%1622250.2%– 33.4%124115116Hyundai i30460.2%– 2.1%1221990.2%– 39.3%137112117Toyota Aygo450.2%+ 15.4%1043350.3%+ 14.3%97111118Jeep Avenger450.2%+ 800.0%1112650.3%+ 5200.0%111190119Renault Rafale450.2%new360460.0%new245 –120BMW X7430.2%– 34.8%1311830.2%+ 11.6%141156121Renault Arkana420.2%– 44.7%2641110.1%– 67.1%181103122Porsche Taycan420.2%+ 2.4%1871090.1%– 50.2%184131123Renault Kangoo420.2%+ 121.1%1561640.2%+ 51.9%152146124Citroen Berlingo410.2%– 12.8%1281420.1%– 12.9%161157125Alfa Romeo Tonale400.2%– 66.1%1142470.3%– 30.6%11689126BMW i4400.2%– 29.8%1152450.2%– 2.0%118121127Range Rover 400.2%+ 2.6%1192180.2%+ 51.4%127159128Nissan Qashqai390.2%– 83.1%764470.5%– 19.0%7266129BMW IX390.2%+ 0.0%1352160.2%+ 54.3%130145130Smart #1390.2%+ 875.0%1262250.2%+ 5525.0%125132131Honda e:Ny1390.2%new1471610.2%new153259132Mercedes CLA380.2%– 34.5%1411770.2%– 37.7%146120133BMW X4380.2%– 2.6%1291660.2%– 16.6%150147134Mercedes EQC380.2%+ 40.7%241730.1%– 49.0%208193135Mazda3380.2%+ 52.0%1841110.1%– 9.0%180177136Toyota Corolla Cross370.2%– 51.9%952630.3%– 48.7%11275137Land Rover Defender370.2%+ 5.7%1021920.2%– 13.5%139135138Polestar 2360.2%– 65.4%2211270.1%– 57.1%17096139Toyota Land Cruiser360.2%+ 9.1%1462100.2%+ 39.1%134162140Honda ZR-V360.2%new992340.2%new122222141VW Passat350.2%– 73.7%734390.4%– 18.6%7360142Ford Mustang Mach-E350.2%– 52.7%1361750.2%– 46.3%14791143Honda CR-V350.2%+ 40.0%1421850.2%+ 58.1%140185144Volvo V60350.2%+ 66.7%1501580.2%– 5.4%156165145Subaru Outback350.2%+ 84.2%1381230.1%+ 24.2%173204146Mercedes EQE350.2%+ 118.8%1631810.2%+ 115.5%144148147Subaru Forester340.2%– 2.9%1601040.1%– 29.3%188164148Renault Trafic340.2%+ 70.0%1711330.1%+ 18.8%166194149Maserati Grecale330.2%+ 13.8%1691080.1%– 35.3%185170150Hyundai Staria330.2%+ 17.9%207720.1%– 2.7%211207151Mazda MX-5330.2%+ 37.5%227600.1%+ 11.1%231244152Fiat Panda330.2%+ 312.5%1333210.3%+ 365.2%100163153Range Rover Evoque320.2%+ 100.0%1251690.2%+ 15.8%149180154BMW i5320.2%new1571090.1%new183273155Kia Stonic310.1%+ 10.7%1052350.2%+ 28.4%121152156BMW X6310.1%+ 40.9%1371290.1%+ 12.2%169184157Citroen C5 Aircross310.1%+ 93.8%841980.2%+ 28.6%138136158Kia Pro Cee’d310.1%+ 121.4%152910.1%+ 12.3%199230159Smart #3310.1%new1671440.1%new159 –160Nissan X-Trail290.1%– 75.6%1063030.3%+ 7.1%103109161Audi A5290.1%– 12.1%1551210.1%– 23.4%174172162Lexus NX290.1%– 6.5%1091530.2%+ 57.7%157181163Kia EV6290.1%+ 0.0%1511730.2%+ 21.8%148124164Renault Twingo290.1%+ 93.3%225730.1%– 52.3%210166165Toyota Proace280.1%– 36.4%1102180.2%– 14.2%128130166Toyota GR86280.1%+ 27.3%1821130.1%+ 85.2%179221167Peugeot Rifter280.1%+ 86.7%239920.1%– 37.8%198186168Nissan Juke270.1%+ 3.8%1452400.2%+ 137.6%120178169Lexus LBX270.1%new176720.1%new212 –170Opel Corsa260.1%– 72.9%1343060.3%– 20.5%10278171Mitsubishi Eclipse Cross260.1%– 31.6%2231520.2%– 26.2%158154172Renault Zoe250.1%– 54.5%1741040.1%– 64.1%187133173Ford Custom250.1%– 21.9%175980.1%– 49.7%194141174BMW XM250.1%– 16.7%213760.1%+ 33.3%203223175Audi Q7240.1%+ 0.0%2031290.1%+ 15.2%168196176Honda Civic240.1%+ 71.4%1491810.2%+ 15.3%143169177Porsche Boxster240.1%+ 242.9%1611030.1%+ 119.1%191276178Fiat 600240.1%new1941210.1%new175313179Kia EV9240.1%new1721590.2%new154237180Mercedes S Class230.1%– 32.4%195960.1%– 33.8%197192181VW Touareg230.1%– 32.4%1431310.1%+ 10.1%167144182Tesla Model X220.1%– 72.8%2321170.1%– 32.4%177160183Kia Xceed220.1%– 24.1%173800.1%– 62.4%202174184Ferrari 296220.1%+ 144.4%204670.1%+ 67.5%220248185Mercedes EQB210.1%– 30.0%1441100.1%+ 0.9%182179186Citroen Jumpy210.1%+ 31.3%197500.1%– 19.4%238238187Dacia Spring210.1%+ 110.0%1581580.2%– 4.8%155140188Kia Sorento210.1%+ 162.5%1701820.2%+ 0.6%142171189Peugeot 2008200.1%– 52.4%1812120.2%– 27.1%133122190Mercedes SL Class200.1%– 9.1%224470.0%– 47.2%242217191Opel Zafira200.1%+ 33.3%322520.1%– 10.3%236215192Volvo V90200.1%+ 66.7%271460.0%+ 24.3%246271193VW ID.5190.1%– 64.2%222660.1%– 69.4%222118194Alfa Romeo Stelvio190.1%– 44.1%231710.1%– 51.4%213173195Mercedes B Class190.1%– 17.4%1911030.1%– 21.4%189183196Peugeot 408190.1%+ 18.8%166620.1%– 51.6%229191197KGM Torres190.1%new258260.0%new280 –198Hyundai Ioniq 6180.1%– 14.3%1771410.1%+ 80.8%163209199Subaru XV170.1%– 78.5%1791180.1%– 60.0%17699200BMW i7170.1%+ 70.0%268300.0%– 25.0%272272201Range Rover Velar170.1%+ 112.5%198560.1%– 6.7%234226202Citroen C3 Aircross160.1%– 56.8%1402130.2%+ 23.1%132143203BMW 8 Series160.1%+ 60.0%252440.0%– 25.4%250253204Mercedes Sprinter160.1%+ 100.0%178650.1%+ 41.3%223242205DS 7150.1%– 53.1%185830.1%– 13.5%201202206VW ID.Buzz150.1%– 51.6%289650.1%– 44.0%224142207Ford Explorer150.1%+ 25.0%324570.1%– 10.9%233249208Mercedes GLS150.1%+ 66.7%226640.1%– 5.9%225233209Ford Mustang150.1%+ 87.5%292300.0%– 41.2%274262210Opel Grandland X140.1%– 65.9%1322790.3%+ 108.2%108107211BMW 7 Series140.1%– 12.5%244450.0%+ 32.4%247263212Land Rover Discovery Sport140.1%+ 40.0%192760.1%+ 28.8%204239213Lexus RZ140.1%+ 55.6%304320.0%+ 68.4%269260214KGM Rexton140.1%new285180.0%new299 –215Mercedes G Class130.1%– 69.8%1591250.1%– 53.4%172139216Subaru Soltera130.1%– 56.7%219350.0%– 59.8%267212217Citroen C4 130.1%– 50.0%234750.1%– 57.4%205138218Cadillac Lyriq130.1%new284190.0%new297 –219Fiat Ulysse130.1%new237480.0%new241341220VW Taigo120.1%– 87.4%180980.1%– 71.8%19697221DS 4120.1%– 50.0%242350.0%– 70.3%262198222Fiat 500X120.1%– 45.5%1161990.2%+ 255.4%136161223Lexus RX120.1%– 36.8%189680.1%– 18.1%219206224VW ID.7120.1%new210380.0%new259250225Mercedes EQS110.1%– 64.5%202660.1%– 48.0%221189226Alpine A110110.1%– 42.1%205570.1%+ 58.3%232241227Lamborghini Urus110.1%– 42.1%201710.1%– 13.4%214225228Porsche Cayman110.1%– 38.9%188730.1%– 14.1%209234229Mitsubishi ASX110.1%– 31.3%1642740.3%+ 158.5%109175230Jaguar E-Pace110.1%+ 10.0%214520.1%– 8.8%235229231Lexus UX110.1%+ 10.0%245380.0%+ 40.7%256236232Mercedes AMG GT110.1%+ 10.0%229610.1%+ 103.3%230255233Suzuki Swace110.1%+ 83.3%215470.0%+ 46.9%244267234Aston Martin DB12110.1%new247280.0%new276389235Jeep Compass100.0%– 87.5%1991010.1%– 78.6%19284236Genesis GV70100.0%– 73.7%233620.1%– 32.6%227187237Peugeot 5008100.0%– 72.2%251750.1%– 47.9%206182238Opel Combo100.0%– 37.5%190630.1%– 44.7%226205239Peugeot Traveller100.0%– 33.3%2351160.1%+ 84.1%178228240Jaguar F-Pace100.0%+ 0.0%200350.0%– 41.7%265240241Mazda MX-30100.0%+ 233.3%257740.1%+ 957.1%207245242Tesla Model S90.0%– 91.2%259980.1%– 49.7%195137243Volvo C4090.0%– 82.4%1121350.1%– 62.5%16593244Genesis GV6090.0%– 71.0%240500.1%– 55.0%239188245Alfa Romeo Giulia90.0%– 60.9%250440.0%– 43.6%249216246Mercedes Citan90.0%+ 28.6%218420.0%– 37.3%252251247Ssangyong Korando90.0%+ 80.0%230700.1%+ 169.2%216269248Toyota Prius90.0%+ 80.0%2361420.1%+ 343.8%162197249Nissan Ariya90.0%+ 200.0%3291000.1%+ 156.4%193208250Volvo S6090.0%n/a283220.0%+ 29.4%290308251Ferrari Purosangue90.0%new217490.0%new240321252Fiat Tipo80.0%– 81.0%2061430.1%+ 16.3%160150253Hyundai Bayon80.0%– 50.0%193690.1%– 15.9%218213254Mazda680.0%– 38.5%320270.0%– 83.0%278195255Ssangyong Tivoli80.0%+ 14.3%305470.0%+ 62.1%243282256Bentley Bentayga80.0%+ 60.0%253250.0%+ 19.0%283300257Aiways U580.0%+ 100.0%216430.0%+ 79.2%251305258Peugeot 50880.0%+ 166.7%263240.0%+ 14.3%286286259Ford Bronco80.0%new299120.0%new311371260Ford Courier80.0%n/a209380.0%n/a255 –261Toyota bZ4X70.0%– 90.5%1542170.2%– 11.8%129113262Jeep Renegade70.0%– 83.7%211620.1%– 81.8%228134263BMW Z470.0%– 68.2%212510.1%– 45.2%237227264Porsche Panamera70.0%– 65.0%260380.0%– 56.8%257211265Ferrari 812 Superfast70.0%– 56.3%243300.0%– 40.0%273252266Ineos Grenadier70.0%– 53.3%246350.0%+ 94.4%264258267Audi e-tron GT70.0%– 36.4%293210.0%– 72.4%291214268Maserati Levante70.0%+ 16.7%308140.0%– 41.7%307279269Audi A770.0%+ 75.0%280200.0%+ 11.1%295291270Ferrari Roma70.0%+ 75.0%262380.0%+ 31.0%254281271Ford Fiesta60.0%– 94.7%1684220.4%– 32.5%7652272Hyundai Santa Fe60.0%– 81.8%248450.0%– 76.9%248153273Suzuki Across60.0%– 45.5%228260.0%– 27.8%282232274Jaguar F-Type60.0%– 25.0%254250.0%+ 4.2%284301275Bentley Continental GT60.0%+ 0.0%208410.0%+ 5.1%253266276Maserati Granturismo60.0%+ 0.0%328190.0%+ 26.7%298314277Subaru Impreza60.0%+ 50.0%1181060.1%+ 430.0%186293278Rolls Royce Cullinan60.0%+ 100.0% –110.0%+ 22.2%317325279Volvo EX4060.0%new60.0%new343 –280Toyota Supra50.0%– 16.7%277230.0%+ 0.0%289278281Toyota Camry50.0%+ 0.0%276280.0%– 9.7%277306282Lamborghini Huracan50.0%+ 25.0%306360.0%+ 33.3%261285283Jaguar XF50.0%n/a295110.0%+ 83.3%315347284Suzuki Jimny50.0%n/a316110.0%+ 450.0%318355285Toyota Highlander50.0%n/a220840.1%+ 950.0%200247286Lamborghini Revuelto50.0%new28690.0%new325 –287Volvo EC4050.0%new50.0%new350 –288Opel Crossland X40.0%– 95.3%323710.1%– 55.6%215151289Jeep Wrangler40.0%– 86.7%249350.0%– 69.8%266176290Mercedes T Class40.0%– 63.6%278240.0%– 17.2%285274291Ferrari SF9040.0%– 55.6%294260.0%– 13.3%279284292Land Rover Discovery40.0%– 33.3%275170.0%– 15.0%301294293Dodge Challenger40.0%+ 100.0%315130.0%+ 550.0%308311294Aston Martin Valkyrie40.0%n/a35160.0%+ 20.0%337354295Ford Transit40.0%n/a –210.0%+ 133.3%292296296Ssangyong Torres40.0%new238310.0%new271292297Ford S-Max30.0%– 91.2%196690.1%– 36.1%217219298VW Up!30.0%– 89.3%321240.0%– 81.4%287155299Smart Fortwo30.0%– 88.0%291210.0%– 79.4%294200300JAC ES430.0%– 82.4%32550.0%– 93.0%349210301Lotus Emira30.0%– 80.0%266100.0%– 77.8%321289302Nissan Primastar30.0%– 70.0%310320.0%+ 68.4%270283303Ssangyong Rexton30.0%– 57.1%261380.0%– 17.4%258256304Aston Martin DBS30.0%+ 0.0%350150.0%+ 150.0%305318305Maserati Ghibli30.0%+ 0.0%30770.0%– 61.1%335328306Man TGE30.0%+ 50.0% –60.0%+ 0.0%340332307Alpina XD3 Biturbo30.0%+ 200.0%33470.0%+ 75.0%334346308Ford GT30.0%+ 200.0% –30.0%– 62.5%370352309Renault Master30.0%n/a31170.0%+ 16.7%336348310McLaren 750S30.0%new28790.0%new326395311Rolls Royce Spectre30.0%new28890.0%new328367312Jeep Grand Cherokee20.0%– 90.0% –290.0%– 42.0%275203313DS 320.0%– 86.7%270230.0%– 61.0%288235314Ford Galaxy20.0%– 86.7%265350.0%– 42.6%263261315VW Arteon20.0%– 85.7%33290.0%– 77.5%329290316Maserati MC2020.0%– 66.7%33880.0%– 50.0%332317317Jaguar i-Pace20.0%– 60.0% –120.0%– 45.5%312304318Mercedes EQV20.0%– 60.0%267210.0%– 50.0%293254319Subaru BRZ20.0%– 60.0%3318 0.0%– 38.5%333268320Kia Soul20.0%– 50.0%269110.0%– 47.6%316297321Alpina B3 Biturbo20.0%+ 0.0%273110.0%– 21.4%314326322Cadillac Escalade20.0%+ 100.0% –50.0%– 28.6%347333323Ferrari Daytona20.0%+ 100.0%281100.0%+ 150.0%319350324Morgan Plus 620.0%+ 100.0% –60.0%+ 50.0%342359325Fiat Scudo20.0%n/a –30.0%n/a365 –326Lexus LC20.0%n/a298120.0%+ 300.0%313351327Mercedes EQT20.0%new –30.0%new367330328Nissan Townstar10.0%– 91.7%272260.0%– 53.6%281243329Cadillac XT410.0%– 87.5% –30.0%– 87.0%362295330Nissan Leaf10.0%– 87.5% –340.0%– 17.1%268265331Opel Vivaro10.0%– 87.5%327170.0%– 46.9%303270332Kia Rio10.0%– 85.7% –40.0%– 95.4%353158333Aston Martin DBX10.0%– 83.3%279190.0%– 29.6%296280334Audi TT10.0%– 75.0%302140.0%– 65.9%306257335Chevrolet Corvette10.0%– 66.7%255120.0%+ 9.1%310287336VW Crafter10.0%– 66.7%314100.0%+ 0.0%322316337Audi A810.0%– 50.0%33650.0%– 72.2%346319338Maserati Quattroporte10.0%– 50.0% –10.0%– 80.0%404353339Alpina XB710.0%+ 0.0% –20.0%+ 0.0%374364340Aston Martin DB1110.0%+ 0.0%34130.0%– 57.1%358356341Cadillac XT610.0%+ 0.0% –10.0%– 50.0%403349342Chevrolet Tahoe10.0%+ 0.0% –20.0%– 33.3%377338343DS 910.0%+ 0.0% –20.0%– 50.0%378339344Volvo S9010.0%+ 0.0%34340.0%– 66.7%357334345Alpina D5 Biturbo10.0%n/a –10.0%+ 0.0%402404346Aston Martin Speedster10.0%new –10.0%new408 –347Caterham Seven10.0%n/a29760.0%+ 500.0%338361348Citroen SpaceTourer10.0%n/a –10.0%n/a411 –349Fiat Ducato10.0%n/a –10.0%n/a409 –350Jaguar XE10.0%n/a31390.0%+ 12.5%324336351Lucid Air10.0%n/a28280.0%+ 700.0%331331352McLaren GT10.0%n/a –10.0%+ 0.0%406373353Peugeot Boxer10.0%n/a –10.0%n/a410 –354Toyota Sienna10.0%n/a –10.0%n/a407374355Aston Martin Valour10.0%new35630.0%new360 –356JAC E-JS110.0%new357370.0%new260394357Lexus LM10.0%new31840.0%new354379358Lotus Eletre10.0%new –170.0%new302327359Maxus Mifa 910.0%new –10.0%new405397360Subaru Crosstrek10.0%new3191260.1%new171 –
Source: Auto Suisse


More Stories
2026 Subaru Crosstrek Dealer Cost Breakdown: Invoice Price and How to Save Near You
If you are shopping for a 2026 Subaru Crosstrek and want to know what dealers are actually paying, what a...
Discover the Fun of PH Bingo Online on GameZone
PH Bingo online has become one of the most recognizable digital gaming formats in the Philippines because it builds on a...
2026 Honda HR-V Invoice Price, Dealer Cost, and How to Get the Best Deal Near You
If you are shopping for a 2026 Honda HR-V and want to know what dealers are actually paying, what a...
2026 Volkswagen Taos True Dealer Cost: Invoice Pricing and the Best Deal Near You
If you are shopping for a 2026 Volkswagen Taos and want to know what dealers are actually paying, what a...
Slate Truck Price Leak Hints at $24,950 Starting Price for Bare-Bones Electric Pickup
Slate may have just given the clearest indication yet of where its highly anticipated electric pickup will land on the...
2027 Maserati Updates Bring More Power, More Range, and a Sharper Edge
Maserati is heading into 2027 with a welcome round of updates that touch nearly every important part of its current...