
Canada May 2024: Hyundai (+31.7%), Volvo (+18.9%) shine, 19th consecutive positive month
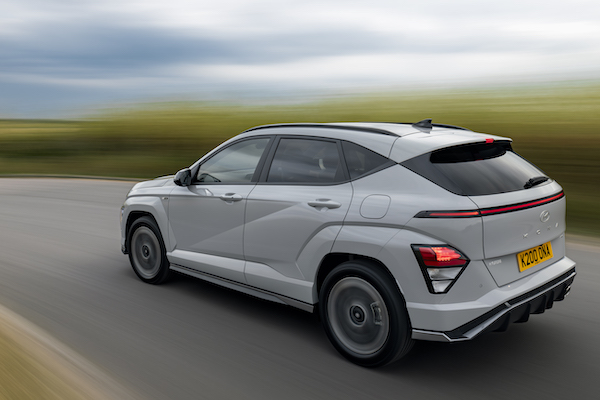
Hyundai Kona sales are up 108.5% year-on-year in May.
According to estimates by local consultancy DesRosiers Automotive, the Canadian new light vehicle market is up 5.7% year-on-year in May to 169,000 units, marking a 19th consecutive month of year-on-year gains. The SAAR comes in a 1.63 million units, the weakest this year so far. Among manufacturing groups still sharing monthly sales data, Hyundai-Kia fares best at +22.9% with Toyota Motor up 8.9% but Honda Canada off -14.7. Brand-wise, Hyundai (+31.7%) delivers the best performance above Volvo (+18.9%), Subaru (+14.2%), Toyota (+13%) and Kia (+12.6%). Lexus (-16.6%) and Honda (-16.7%) struggle.
Looking at models with monthly data available, the Toyota RAV4 outpaces the market at +8.9% unlike the Honda CR-V (-21.9%) in freefall. The Hyundai Kona (+108.5%) lodges another very impressive result at over 3,000 sales and is now up 82% year-to-date. The Toyota Corolla Cross (+142.5%), Hyundai Elantra (+24%), Hyundai Tucson (+21.8%) and Kia Seltos (+18.9%) also shine.
Previous month: Canada April 2024: Market up 14% on low year-ago result
One year ago: Canada May 2023: Mazda, Honda stand out in market up 13.5%
Full May 2024 data for selected groups, brands and models below.
Canada May 2024 – groups:
GroupMay-24/232024/23Toyota Motor Co.23,670+ 8.9%105,996+ 23.4%Hyundai-Kia21,840+ 22.9%93,331+ 12.1%Honda Canada12,181– 14.7%52,808+ 16.0%Mazda6,908+ 6.8%26,475+ 19.0%Subaru5,993+ 14.2%29,923+ 56.6%Volvo Cars Canada1,233+ 18.9%5,069+ 13.9%
Canada May 2024 – brands:
BrandMay-24/232024/23Toyota21,155+ 13.0%94,025+ 29.5%Hyundai13,000+ 31.7%53,373+ 17.3%Honda11,003– 16.7%47,939+ 17.7%Kia8,209+ 12.6%37,155+ 5.7%Mazda6,908+ 6.8%26,475+ 19.0%Subaru5,993+ 14.2%29,923+ 56.6%Lexus2,515– 16.6%11,971– 10.2%Volvo1,233+ 18.9%5,069+ 13.9%Acura1,178+ 8.7%4,869+ 0.9%Genesis631+ 4.8%2,803+ 7.6%
Canada May 2024 – models:
ModelMay-24/232024/23Toyota RAV47,911+ 8.9%36,568+ 17.0%Honda CR-V5,060– 21.9%21,755+ 19.1%Honda Civic3,409+ 6.0%12,565+ 34.8%Hyundai Kona3,124+ 108.5%14,820+ 82.0%Hyundai Tucson2,759+ 21.8%12,384+ 16.5%Toyota Corolla2,758– 4.1%12,182+ 30.5%Subaru Crosstrek2,277+ 10.5%11,940+ 99.7%Mazda CX-52,152– 23.9%8,948+ 6.5%Toyota Corolla Cross2,105+ 142.5%7,462+ 116.9%Hyundai Elantra2,025+ 24.0%7,801– 11.3%Kia Seltos1,756+ 18.9%9,228+ 3.7%Kia Sportage1,648– 8.0%8,397+ 29.3%Toyota Tacoma1,573– 7.9%3,895– 28.7%Hyundai Santa Fe1,388– 6.5%4,346– 14.7%Subaru Forester1,375+ 214.6%7,069+ 140.0%Toyota Tundra1,271+ 15.3%5,690+ 41.6%Mazda31,257+ 37.5%4,387+ 7.8%Mazda CX-301,223– 12.3%5,746+ 7.4%Subaru Outback1,187+ 7.8%5,672+ 17.6%Hyundai Venue1,179+ 9.1%4,752– 0.7%Toyota Camry1,023– 0.9%6,520+ 64.7%Toyota Sienna1,014+ 85.7%4,335+ 199.4%Mazda CX-501,005+ 158.4%3,809+ 171.3%Hyundai Ioniq 5993+ 370.6%3,488+ 113.6%Honda HR-V924– 5.0%5,728+ 32.0%Kia Sorento922+ 89.3%3,382+ 5.9%Toyota Grand Highlander912new3,392newKia EV6887+ 384.7%2,752+ 299.4%Kia Forte862– 8.5%4,610– 11.4%Lexus RX833– 20.4%4,038– 17.4%Hyundai Palisade791– 15.2%2,991– 12.5%Toyota Highlander722– 44.0%3,221– 57.6%Kia Niro701+ 57.2%2,851+ 145.8%Mazda CX-90587+ 34.0%2,365+ 440.0%Acura RDX585+ 5.2%2,381– 4.4%Honda Pilot555– 37.2%2,408– 14.6%Lexus NX548– 41.6%3,439– 30.0%Kia EV9515new1,347newToyota Venza495+ 326.7%2,625+ 491.2%Toyota bZ4X480+ 55.3%2,217+ 76.5%Mazda CX-70437new500newKia Carnival405– 38.3%1,827– 38.2%Genesis GV70395+ 38.1%1,773+ 29.6%Honda Odyssey386– 17.3%1,532– 25.2%Toyota 4Runner384– 52.3%2,104– 11.2%Subaru Impreza383+ 89.6%1,593+ 38.3%Acura MDX379+ 89.5%1,843+ 37.0%Kia Telluride351– 25.8%1,265– 42.9%Lexus UX325– 4.7%1,303+ 28.8%Hyundai Ioniq 6302+ 14.0%1,179+ 147.7%Honda Passport289+ 12.5%1,174+ 2.9%Subaru Ascent288– 33.8%1,125– 24.5%Subaru WRX285– 60.4%1,136– 29.4%Honda Accord258– 55.0%1,261– 9.0%Mazda MX-5 Miata240+ 39.5%585– 14.3%Hyundai Sonata232+ 236.2%492– 40.4%Lexus TX231new1,215newHyundai Santa Cruz207– 52.4%1,120– 33.4%Lexus IS180– 14.7%695– 16.2%Toyota 86166+ 225.5%392+ 132.0%Kia Soul158+ 1.9%795– 43.5%Genesis GV80123+ 6.0%443– 0.9%Toyota Sequoia123+ 59.7%370+ 88.8%Acura Integra120– 37.5%277– 29.7%Lexus GX118+ 78.8%195– 47.0%Honda Ridgeline116– 67.1%1,509+ 9.0%Subaru Solterra106– 24.8%982+ 50.8%Lexus ES105– 27.1%402– 23.1%Acura TLX94– 29.9%365– 35.5%Toyota Crown83– 43.9%438– 8.0%Subaru BRZ75– 39.0%317– 2.5%Lexus LX74– 47.9%304– 28.6%Genesis G7070– 49.3%396– 7.7%Lexus RZ61– 28.2%243– 7.3%Toyota Supra51+ 59.4%137+ 6.2%Toyota Land Cruiser45– 19.6%194– 10.6%Toyota Prius33– 92.4%2,269+ 186.5%Lexus LC28+ 64.7%72+ 118.2%Genesis GV6023– 34.3%106– 34.6%Genesis G8018– 25.0%74– 58.7%Subaru Legacy17– 37.0%89– 30.5%Lexus RC11– 47.6%54– 3.6%Mazda MX-307– 88.1%106– 60.3%Honda Prologue6new6newToyota Mirai6+ 200.0%14+ 40.0%Genesis G902– 33.3%11– 47.6%Kia K52– 97.7%28– 94.3%Kia Rio1– 99.8%653– 67.4%Kia Stinger1– 99.0%20– 95.5%Lexus LS1– 66.7%11– 21.4%
Source: Manufacturers, DAC

More Stories
Revolutionizing Engagement on Game Zone with Real-Player Competition
Online gaming often highlights advanced graphics, immersive features, and enticing rewards. While these aspects contribute to enjoyment, the true thrill...
Honda Element Comeback Report Points To A Boxy Hybrid SUV Revival For 2029
The Honda Element has been gone since 2011, but it never really disappeared from the hearts of the people who...
Jaguar Type 01 Electric GT Set for New York Debut This October as Brand Reset Gets Real
Jaguar’s long-teased reinvention finally has a reveal window, and the stage will be New York City this October. According to...
How GTM AI Is Driving Growth for Automotive Technology Companies
The automotive industry is evolving rapidly. Electric vehicles are becoming more common. Connected vehicle platforms continue to expand. Fleet technology...
125cc or 140cc? How to Choose a First Manual-Clutch Dirt Bike by the Rider, Not Just the CC
When a rider is ready for a real manual-clutch dirt bike, the right pick comes down to fit and experience,...
The Biggest Reliability Concerns for Used EV Buyers
The used EV market has grown up fast. A few years ago, buying a pre-owned electric vehicle felt like a...