
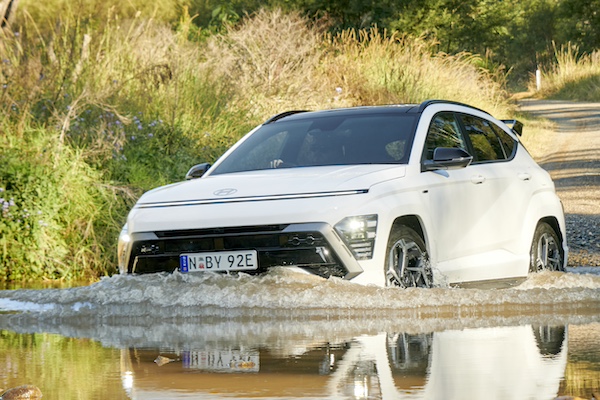
Australia May 2024: All time high market, Toyota Camry (+185.6%), Hyundai Kona (+127.4%) stand out
The Hyundai Kona knocks at the Top 10’s door in May.
It’s a 5th consecutive monthly record for new car sales in Australia, up 5.1% to 111,099 units, eclipsing the previous record of 105,694 established just last year. The year-to-date tally is now up 12.2% to 512,753. SUV sales are timid for once at +1.2% year-on-year to 59,737 and 53.8% share vs. 55.8% in 2023 and 54.5% in 2022. Light Commercials advance 6.3% to 25,317 and 22.8% share vs. 22.5% last year and 23% in 2022 while Passenger Cars catch up on lost sales at +17.3% to 21,252 and 19.1% share vs. 17.1% in 2023 and 18.3% two years ago. Private sales trail the market slightly at +3.8% to 56,315, business fleets outpace it at +8.5% to 41,007 but rentals (-14.9% to 5,046) struggle. Government sales soar +31.6% to 3,938.
Petrol sales drop -13.5% to 45,262 for the month and -5.1% to 222,368 so far this year, reversely diesel is up 7.4% to 34,479 in May and +13.4% to 156,941 YTD just as hybrids surge 113.4% to 16,218 in May and +126.8% to 66,437 YTD. BEVs are up 10.5% to 8,974 and up 26.8% to 40,636 YTD and PHEV soar 73.6% to 1,373 for May and up 118.1% to 6,099 YTD. All states and territories are up this month bar the Northern Territory (-8.8% to 999). New South Wales is up 5.3% to 33,145, Victoria up 3.2% to 30,095, Queensland up 5.5% to 23,534, Western Australia up 5.4% to 12,334, South Australia up 11.3% to 7,501, Tasmania up 7.1% to 1,818 and Australian Capital Territory up 10.6% to 1,673. Looking at sales by provenance, Japan is up 20.7% to 34,214, Thailand up 20.4% to 24,841, China unusually down -7.1% to 16,682, South Korea off -3.6% to 14,643 and Germany up 4.2% to 5,152.
In the brands ranking, Toyota (+27.5%) vastly outpaces the market as it fills months or even years-old orders. Ford (+40.9%) is even more dynamic and confirms it is now the #2 brand in Australia. Mazda (-5.6%) disappoints in third place ahead of Kia (+7.2%) again outselling its twin brand Hyundai (-8.2%). Mitsubishi (+39.8%) and Isuzu Ute (+26.4%) shine at #6 and #7 respectively as does GWM (+17.9%) equalling its ranking record at #9. Tesla (-20.3%) is in freefall but climbs back into the Top 10 at #10, with MG (-13.9%) seemingly having reached a peak. BYD (+32.2%) breaks its ranking (#16), volume (1,914) and share (1.7%) records this month. Notice also Honda (+63.8%) and Chery (+22.9%) in fantastic shape further down the charts.
Model-wise, the Ford Ranger (+43.8%) for the 7th time in the past 8 month with 5.3% share. This time the Toyota Hilux (-1.2%) is not far behind at 5.1%. Leader last month, the Toyota RAV4 (+110.9%) falls to #3 but surges year-on-year. The Isuzu D-Max (+10.2%) and Mitsubishi Outlander (+33%) return to the rankings they hold year-to-date at #4 and #5 respectively. The Toyota Camry (+185.6%) shoots up year-on-year to #6, the nameplate’s highest ranking in almost 7 years: since July 2017 (#5). The Ford Everest (+159.9%), Toyota Corolla (+76%) and Tesla Model 3 (+50.8% and up 19 spots on April) also impress in the remainder of the Top 10. Just outside, the Hyundai Kona (+127.4%) equals its record ranking at #11, also reached in December 2020. The MG ZS (-26.4%) is kicked out of the Top 10 at #12, the Kia Cerato (+178.6%), Isuzu MU-X (+61.2%) and Kia Sportage (+59.1%) shine below. Notice also the BYD Seal breaking into the Top 30 for the first time at #29.
Previous month: Australia April 2024: Another record market, Toyota RAV4 and Ford Everest at all-time high
One year ago: Australia May 2023: Record market, Toyota Hilux reclaims lead
Full May 2024 Top 48 All brands and Top 35 models below.
Australia May 2024 – brands:
PosBrandMay-24%/23Apr2024%/23PosFY231Toyota 23,38921.1%+ 27.5%1100,39819.6%+ 40.8%112Ford 8,8067.9%+ 40.9%240,1297.8%+ 31.9%233Mazda 8,0027.2%– 5.6%339,0647.6%– 4.1%324Kia 7,5046.8%+ 7.2%433,0756.5%+ 4.6%445Hyundai 6,4955.8%– 8.2%629,5305.8%+ 0.1%656Mitsubishi6,4095.8%+ 39.8%531,9116.2%+ 24.4%567Isuzu Ute4,4014.0%+ 26.4%721,4584.2%+ 28.1%7108MG4,1593.7%– 13.9%820,3694.0%– 1.5%979GWM3,8203.4%+ 17.9%917,3513.4%+ 27.1%111310Tesla3,5673.2%– 20.3%1318,4333.6%– 0.7%10811Nissan 3,4253.1%+ 11.0%1120,6234.0%+ 42.0%81212Subaru 3,4013.1%– 4.6%1017,2833.4%– 1.7%12913Volkswagen3,3623.0%– 14.7%1215,1122.9%– 4.6%131114BMW2,5772.3%+ 10.6%1410,4952.0%+ 10.9%141515Mercedes2,5762.3%– 11.0%159,5461.9%– 20.9%151416BYD1,9141.7%+ 32.2%187,8051.5%+ 67.3%172117Suzuki 1,8021.6%+ 6.3%168,7161.7%+ 21.7%161818Audi1,5861.4%– 2.3%176,5151.3%– 13.1%201719LDV1,4161.3%– 30.0%207,1391.4%– 15.9%191620Honda 1,3331.2%+ 63.8%197,2071.4%+ 27.7%182021Volvo1,0420.9%– 13.5%223,6590.7%– 26.6%222222Lexus1,0200.9%– 43.1%215,0771.0%– 6.3%211923Chery7180.6%+ 22.9%243,2160.6%+ 218.7%232924Land Rover6870.6%– 37.6%233,0230.6%+ 1.7%242325Ssangyong6240.6%+ 2.5%262,4530.5%– 4.5%272826Porsche4880.4%– 28.8%282,7170.5%+ 8.5%252727Skoda4720.4%– 31.7%252,5000.5%– 20.8%262528Renault4580.4%– 44.5%272,3190.5%– 32.8%282429Chevrolet3800.3%+ 9.5%291,6350.3%+ 29.7%303330Ram2730.2%– 64.4%301,6370.3%– 45.1%292631Peugeot2660.2%+ 10.4%349350.2%+ 10.0%343432Cupra2500.2%– 3.8%359990.2%– 18.6%333233Mini2150.2%– 46.1%311,2720.2%– 17.9%313134Jeep 1680.2%– 62.5%321,1080.2%– 45.0%323035Fiat1600.1%– 20.4%336740.1%– 20.4%353636Polestar1460.1%– 35.4%n/a5940.1%– 33.7%363537Genesis1050.1%– 44.1%365750.1%– 9.2%373738Jaguar580.1%+ 26.1%383120.1%+ 63.4%384039Alfa Romeo420.0%– 26.3%373070.1%+ 69.6%393840Lamborghini340.0%+ 70.0%41950.0%+ 93.9%414141Maserati310.0%– 62.7%391610.0%– 24.8%403942Ferrari220.0%– 12.0%44850.0%– 6.6%424443Bentley200.0%– 47.4%42780.0%– 17.9%444244Citroen150.0%– 42.3%46530.0%– 45.4%464345Aston Martin120.0%+ 33.3%45620.0%+ 3.3%454646Lotus100.0%+ 0.0%40840.0%+ 121.1%434547Rolls-Royce70.0%+ 16.7%47200.0%+ 25.0%484848McLaren60.0%– 62.5%43270.0%– 25.0%4747
Australia May 2024 – models:
PosModelMay-24%/23Apr2024%/23Pos1Ford Ranger5,9125.3%+ 43.8%227,2425.3%+ 27.3%12Toyota Hilux5,7025.1%– 1.2%322,8854.5%+ 4.3%23Toyota RAV45,5175.0%+ 110.9%121,4984.2%+ 101.6%34Isuzu D-Max2,6122.4%+ 10.2%512,9392.5%+ 20.4%45Mitsubishi Outlander2,5002.3%+ 33.0%911,3982.2%+ 17.3%56Toyota Camry2,4682.2%+ 185.6%88,7751.7%+ 219.1%127Toyota Corolla2,4392.2%+ 76.0%610,9472.1%+ 98.9%68Ford Everest2,1101.9%+ 159.9%49,0091.8%+ 102.2%109Mazda CX-52,1081.9%+ 14.2%129,2331.8%– 5.7%910Tesla Model 31,9581.8%+ 50.8%298,8231.7%– 12.8%1111Hyundai Kona1,8421.7%+ 127.4%167,1441.4%+ 110.4%1912MG ZS1,8411.7%– 26.4%109,8391.9%+ 0.2%713Kia Sportage1,7901.6%+ 59.1%118,6181.7%+ 61.6%1314Isuzu MU-X1,7891.6%+ 61.2%78,5191.7%+ 41.9%1415Tesla Model Y1,6091.4%– 49.4%219,6101.9%+ 13.8%816Kia Cerato1,5381.4%+ 178.6%146,3231.2%+ 185.3%2217Toyota Land Cruiser Wagon1,4821.3%+ 8.7%207,8511.5%+ 57.7%1618Hyundai Tucson1,4341.3%– 25.0%137,6671.5%– 5.1%1719Mitsubishi Triton1,4051.3%+ 6.2%177,5661.5%+ 17.0%1820Mazda BT-501,3831.2%– 22.7%226,4641.3%– 8.2%2121Mazda CX-31,3001.2%+ 8.1%156,9391.4%+ 6.3%2022GWM Haval Jolion1,2651.1%+ 17.6%235,8261.1%+ 30.7%2323Nissan X-Trail1,1941.1%+ 13.7%188,0111.6%+ 70.5%1524Toyota Hiace1,1761.1%– 17.0%394,8881.0%+ 24.6%2825Toyota Land Cruiser PU/CC1,0961.0%+ 16.7%355,0301.0%+ 29.3%2626MG 31,0771.0%– 28.6%314,8560.9%– 31.1%3027Subaru Forester1,0420.9%– 0.3%285,5411.1%– 19.5%2528Mazda CX-301,0100.9%– 13.6%274,8680.9%– 1.4%2929BYD Seal1,0020.9%new343,3860.7%new4130Subaru Outback9950.9%+ 25.9%264,4990.9%– 2.6%3531Kia Sorento9940.9%+ 43.2%244,6000.9%– 1.6%3232Toyota Corolla Cross9570.9%+ 127.3%194,5510.9%+ 97.7%3333Kia Carnival9250.8%+ 7.3%443,2790.6%– 30.1%4234Mitsubishi Eclipse Cross9200.8%+ 61.4%434,4470.9%+ 30.4%3735VW Amarok9110.8%+ 41.2%403,9140.8%+ 169.0%3936Mazda38840.8%+ 13.5%304,4920.9%+ 12.8%3637Suzuki Jimny8780.8%+ 17.4%323,9150.8%+ 51.2%3838GWM Haval H68470.8%+ 1.4%383,8080.7%+ 8.3%4039Nissan Navara8450.8%+ 24.1%474,5120.9%+ 42.4%3440Mitsubishi ASX8420.8%+ 53.4%254,9281.0%+ 27.7%27
Source: VFACTS

More Stories
Rolls-Royce Black Badge Ghost Tourist Trophy Celebrates Charles Rolls’ Historic Isle of Man Victory
Rolls-Royce has never been a brand to treat history like a museum piece. Instead, Goodwood tends to bring its past...
Rivian Starts Contacting R2 Reservation Holders as Orders Near the Finish Line
When Rivian pulled the covers off the R2 in the spring of 2024, the announcement generated plenty of attention. Then...
Four Tips for Choosing a Business Legal Team for Your Trucking Company
There is a lot involved in running a trucking company, and it’s so much more than just moving freight from...
How Auto Dealers Haven Helps Car Dealerships Run Like a Well-Oiled Machine
Walk into any professionally run car dealership and everything feels seamless – the lot is organized, the service bay moves...
2026 Jeep Cherokee Limited 4×4 Review & Test Drive
After a few-year hiatus, the Jeep Cherokee returns, sporting a redesign for its third generation, bringing a hybrid setup to...
Porsche Just Gave the Taycan Fake Gears, a Bigger Battery, and a Bigger Price Tag
Porsche has rolled out the 2027 Taycan, and while the sheet metal hasn’t changed, almost everything underneath has. The biggest...