
Germany February 2026: Skoda repeats at record #2, Elroq up to #6
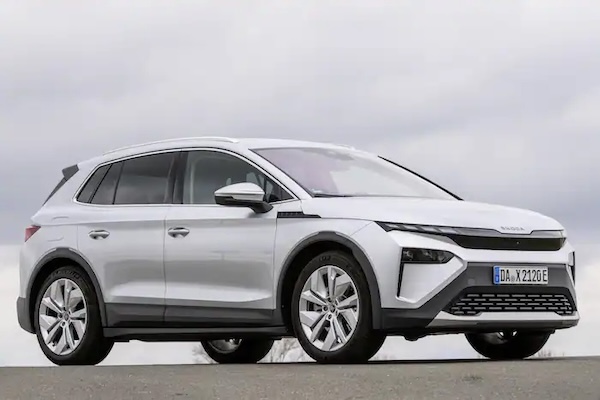
The Skoda Elroq is by far the best-selling BEV in Germany in February.
211,262 new cars hit German roads in February, a 3.8% year-on-year improvement. Due to a weak start of the year, the year-to-date tally remains in negative at -1.4% to 405,243. BEV sales are up 28.7% to 46,275 and 21.9% share vs. 17.7% a year ago. Year-to-date, sales of electric vehicles gain 26.3% to 88,967 and 22% share vs. 17.1% over the same period in 2025.
Volkswagen (-2.1%) can’t benefit from the market lift and ends the month at 19% share. Skoda (+26.5%) posts a splendid score and repeats at a record 2nd place with 9% share. BMW (+0.3%), Mercedes (-9.9%) and Audi (-2.3%) follow and all underperform. Opel (+44.4%) is in sensational shape with 5.2% share in 6th place ahead of Seat (+13.6%) also strong. Fiat (+113.2%) impresses at #10. BYD (+1550.3%) is up to #20 and outsells Tesla (+59.3%) at #24. Alpine (+650%), Leapmotor (+486.6%) and Xpeng (+104.3%) stand out below.
Model-wise, the VW Golf (-5.1%) stays on top with 3.1% share. That’s a full one percentage point above its next followers the VW T-Roc (+20%) and Tiguan (-18.8%) both collapsing. The Fiat Ducato (+106.1%) soars 30 spots on last month to #4, followed by the Skoda Octavia (-1.3%). At a record #6, the Skoda Elroq (+651.9%) confirms it is a new blockbuster in Germany and ranks #1 BEV by a distance. Notice also the VW Tayron (+1176%) at #13, the BMW X3 (+82.6%) at #14 (4.4% of which are the iX3), and the Mercedes CLA (+143.4%) at #18.
Previous month: Germany January 2026: Skoda up to record #2, places Elroq inside Top 10 for the first time
One year ago: Germany February 2025: Volkswagen’s EVs surge as Tesla sinks -73.3%
Full February 2026 Top 60 All brands and Top 358 All models below.
Germany February 2026 – brands:
PosBrandFeb-26%/25Jan2026%/25PosFY251Volkswagen40,17419.0%– 2.1%178,45619.4%– 10.3%112Skoda19,0349.0%+ 26.5%237,5849.3%+ 19.1%243BMW17,1348.1%+ 0.3%434,2398.4%+ 2.8%434Mercedes16,9318.0%– 9.9%335,3858.7%– 8.1%325Audi15,5197.3%– 2.3%529,5737.3%– 3.2%556Opel11,0385.2%+ 44.4%619,8674.9%+ 36.3%667Seat7,6533.6%+ 13.6%913,3423.3%– 8.8%8108Ford7,5743.6%– 19.4%714,3943.6%– 15.7%779Hyundai7,2003.4%+ 16.2%813,3413.3%+ 8.4%9810Fiat5,9932.8%+ 113.2%1010,4832.6%+ 101.2%101711Toyota4,8282.3%– 14.3%158,4232.1%– 23.9%12912Peugeot4,7232.2%+ 2.8%119,2092.3%– 3.6%111613Citroen4,5902.2%+ 18.7%168,0922.0%+ 12.0%141814Kia4,2882.0%– 0.2%148,2042.0%– 11.4%131315Dacia4,0771.9%– 15.4%187,2181.8%– 31.6%171216Volvo3,9821.9%– 29.6%137,9492.0%– 28.0%151517Renault3,8361.8%– 1.1%177,1971.8%– 9.4%181418Cupra3,7141.8%– 38.6%127,7411.9%– 35.5%161119Mazda3,2631.5%+ 7.4%206,0781.5%+ 14.1%191920BYD3,0531.4%+ 1550.3%225,6821.4%+ 1252.9%202421Mini2,9491.4%+ 49.2%215,5941.4%+ 32.7%212022Nissan2,8131.3%+ 24.1%234,8721.2%+ 8.6%232123Porsche2,5831.2%+ 10.0%195,5251.4%+ 16.7%222224Tesla2,2761.1%+ 59.3%263,5770.9%+ 32.2%252725MG Roewe2,1601.0%+ 23.2%253,6180.9%+ 6.5%242326Suzuki1,9190.9%– 7.1%243,4280.8%– 0.3%262527Leapmotor1,0910.5%+ 486.6%301,7800.4%+ 422.0%283128Land Rover1,0140.5%+ 16.6%272,1230.5%+ 1.5%272829Jeep7500.4%– 32.7%291,5320.4%– 27.4%302930Mitsubishi7160.3%– 49.1%281,6800.4%– 49.6%292631Honda5220.2%– 5.3%349220.2%– 5.8%313232Alfa Romeo3860.2%– 40.5%338250.2%– 32.4%333033Smart3560.2%+ 26.7%328220.2%+ 6.6%343434Xpeng3310.2%+ 104.3%356580.2%+ 157.0%353735Polestar2960.1%+ 12.5%318280.2%+ 66.3%323336Subaru2580.1%– 24.3%374640.1%– 25.4%373637Lexus2220.1%– 35.7%364920.1%– 29.0%363538KGM1760.1%– 20.7%383390.1%– 39.7%383839DS1440.1%– 73.2%402620.1%– 67.0%393940Alpine1350.1%+ 650.0%422420.1%+ 149.5%404441Lamborghini1210.1%+ 5.2%432030.1%– 1.9%434342Ferrari1190.1%– 15.0%412320.1%– 14.4%414143GWM1030.0%– 6.4%471470.0%– 66.6%444044Man930.0%+ 4.5%392240.1%+ 14.3%424245Iveco820.0%– 2.4%441440.0%+ 3.6%454646Lynk & Co770.0%+ 165.5%451280.0%+ 287.9%464747Genesis 620.0%+ 17.0%51920.0%– 12.4%474548Aston Martin390.0%n/a49740.0%n/a485349Ineos340.0%+ 36.0%53620.0%+ 34.8%505050Maserati320.0%+ 45.5%52620.0%– 8.8%514851Bentley310.0%– 45.6%48720.0%– 39.0%494952Rolls-Royce210.0%– 51.2%54480.0%– 30.4%535153Togg160.0%new46620.0%new525854Lotus160.0%– 33.3%55400.0%– 39.4%555255Deepal130.0%new –130.0%new586456Zeekr120.0%new57220.0%new566557Vinfast100.0%– 44.4%50440.0%– 4.3%545558Lucid 70.0%– 22.2%56180.0%– 35.7%575759Cadillac60.0%– 25.0%5990.0%– 59.1%596060NIO50.0%– 80.0%6160.0%– 86.0%615461Morgan20.0%– 50.0%5860.0%– 25.0%606162Jaecoo20.0%new –20.0%new626663Maxus20.0%+ 0.0% –20.0%– 77.8%645964DAF10.0%n/a –10.0%n/a656965Lada00.0%n/a6020.0%n/a6368 –Others6550.3%– 41.0% –1,4880.4%– 31.8% – –
Germany February 2026 – models:
PosModelFeb-26%/25Jan2026%/25PosFY251VW Golf6,6363.1%– 5.1%113,1653.2%– 10.3%112VW T-Roc4,3442.1%– 20.0%48,2032.0%– 31.0%323VW Tiguan4,3342.1%– 18.8%28,5622.1%– 28.6%234Fiat Ducato3,9721.9%+ 106.1%345,5791.4%+ 70.4%13195Skoda Octavia3,7671.8%– 1.3%37,7601.9%– 1.7%466Skoda Elroq3,4061.6%+ 651.9%86,5271.6%+ 790.5%6327BMW X13,1501.5%– 3.9%105,9981.5%+ 4.0%958Opel Corsa3,1441.5%– 0.7%56,8491.7%+ 21.7%549VW Passat3,1061.5%– 24.3%96,1741.5%– 21.6%8710Mini All2,9491.4%+ 49.2%145,5941.4%+ 32.7%121311Audi A62,9411.4%+ 16.2%66,3041.6%+ 48.6%71012VW Transporter2,8691.4%+ 16.2%115,6981.4%+ 7.1%101513VW Tayron2,7691.3%+ 1176.0%135,5321.4%+ 2060.9%142614BMW X32,5971.2%+ 82.6%125,3961.3%+ 60.2%153415Mercedes GLC2,5341.2%– 12.1%75,6741.4%– 5.9%111116VW ID.32,4551.2%+ 22.3%184,8601.2%+ 20.8%171717Audi A32,4241.1%+ 7.5%234,4521.1%– 2.7%221618Mercedes CLA-Klasse2,4171.1%+ 143.4%174,8351.2%+ 179.3%194119BMW 5er2,3801.1%– 16.7%194,7721.2%– 11.9%20920Skoda Enyaq2,3091.1%+ 18.7%274,1501.0%– 17.0%253321Skoda Kodiaq2,2921.1%+ 5.4%164,8561.2%+ 13.8%182222Seat Ibiza2,2831.1%+ 94.0%573,3980.8%+ 45.6%345423Audi A52,2731.1%+ 16.4%314,0031.0%+ 18.8%272524VW Polo2,2721.1%+ 26.9%204,5941.1%+ 8.1%212325VW ID.72,2461.1%– 24.4%154,8781.2%– 20.2%161426Opel Mokka2,2071.0%+ 93.3%863,0260.7%+ 22.3%434327Seat Leon2,1851.0%– 24.6%214,4331.1%– 35.0%23828Skoda Karoq2,1741.0%+ 13.7%224,3451.1%+ 14.6%242429Opel Astra2,1721.0%+ 9.4%303,9081.0%+ 1.2%281230BMW 3er2,0981.0%– 1.7%254,0041.0%– 4.2%261831Opel Grandland X2,0571.0%+ 95.9%353,6440.9%+ 79.9%305132Hyundai Tucson2,0331.0%+ 55.7%463,4050.8%+ 30.5%334233Mercedes E-Klasse/EQE1,8620.9%– 4.7%373,4380.8%– 13.5%322734Ford Transit Custom1,8130.9%– 16.4%453,1920.8%– 24.8%383935VW T-Cross1,7400.8%+ 4.8%243,6690.9%– 8.4%292036Citroen C3/C3 Aircross1,6930.8%+ 90.7%323,3970.8%+ 115.8%356037Skoda Fabia1,6900.8%– 5.8%333,3360.8%– 6.4%363538Volvo XC601,6630.8%– 24.6%263,5050.9%– 29.8%313739Seat Arona1,6570.8%+ 9.4%732,5950.6%– 8.5%516140VW Caddy1,6560.8%+ 10.3%423,0430.8%– 10.6%414841VW ID.4, ID.51,6230.8%– 35.3%672,6140.6%– 49.6%502842BMW 1er1,5670.7%+ 7.7%403,0410.8%+ 4.2%423043Skoda Superb1,5380.7%+ 71.5%393,0570.8%+ 37.4%405344Nissan Qashqai1,5260.7%+ 67.3%622,5750.6%+ 38.6%526745Seat Ateca1,5250.7%+ 35.4%432,9080.7%+ 12.0%446846Audi Q31,4980.7%+ 24.3%492,7150.7%+ 12.2%485947Mercedes GLA/EQA1,4880.7%+ 57.6%283,3040.8%+ 90.5%377348Toyota Yaris/Cross1,4800.7%– 15.2%642,5120.6%– 27.2%542149Dacia Sandero1,4140.7%– 29.8%582,5090.6%– 42.3%552950Skoda Kamiq1,4030.7%– 9.4%482,7330.7%– 13.7%473851VW Touran1,3930.7%+ 39.4%532,5610.6%+ 12.6%536952BMW 2er1,3840.7%– 6.7%382,9070.7%+ 8.4%454753Mercedes C-Klasse 1,3600.6%– 37.5%293,1730.8%– 23.6%393654Tesla Model Y1,3400.6%+ 29.5%562,4590.6%+ 22.1%578155Citroen Jumper1,3140.6%+ 110.9%1161,7880.4%+ 57.7%8111556Mercedes V-Klasse/EQV1,3070.6%– 16.7%362,8930.7%– 25.8%464457Mazda CX-301,3050.6%+ 47.8%502,5000.6%+ 52.4%567758BMW 4er1,2990.6%– 30.9%412,6900.7%– 19.0%494059Ford Puma1,2820.6%– 24.5%742,2180.5%– 28.8%635860VW Taigo1,2800.6%– 8.6%752,2140.5%– 28.5%644561BYD Dolphin Surf1,2200.6%new842,0530.5%new6917962Cupra Formentor1,2000.6%– 52.7%542,3460.6%– 54.4%603163Dacia Bigster1,1900.6%+ 4307.4%782,1020.5%+ 7685.2%687464Toyota Aygo X1,1720.6%– 3.5%911,9040.5%– 17.3%774665Toyota Corolla/Cross1,1580.5%+ 35.1%822,0130.5%+ 44.8%707866Ford Kuga1,1150.5%– 19.4%522,2830.6%– 9.8%626267Hyundai Kona1,1140.5%+ 30.6%512,2940.6%+ 43.7%617068Audi Q41,0960.5%– 35.0%891,8700.5%– 30.4%798369Mercedes GLE1,0840.5%+ 60.8%632,1230.5%+ 40.3%658570Audi Q51,0520.5%– 29.1%442,4310.6%– 27.2%584971Audi Q61,0510.5%+ 32.7%472,4090.6%+ 65.1%597572Cupra Born1,0480.5%– 34.3%612,1020.5%– 39.7%675073Peugeot 30081,0460.5%+ 93.0%712,0030.5%+ 66.1%7210074Peugeot 2081,0300.5%– 16.9%702,0020.5%– 37.2%736675Audi Q21,0210.5%+ 1.2%1211,4670.4%– 22.0%968776Cupra Terramar1,0040.5%– 1.5%652,0050.5%+ 21.7%715577Mercedes GLB/EQB9960.5%+ 84.8%881,7790.4%+ 15.7%8212578Kia Ceed/Xceed9930.5%– 8.0%771,9250.5%– 21.5%765679Ford Transit, Tourneo9890.5%+ 66.8%1041,5310.4%+ 49.5%9210380BMW X59830.5%+ 44.1%552,1220.5%+ 26.2%667181Porsche Cayenne9780.5%+ 90.3%801,8590.5%+ 84.4%8011982Volvo XC409730.5%– 24.6%661,9660.5%– 0.8%756483Audi A19450.4%– 1.0%941,6350.4%– 19.9%877684Peugeot 20089380.4%– 2.4%601,9940.5%+ 9.9%748085Suzuki Swift9220.4%– 19.6%831,7670.4%– 3.5%838486Hyundai Inster9180.4%+ 111.5%921,6120.4%+ 91.4%889287Opel Frontera9100.4%n/a901,6730.4%+ 55666.7%868988Tesla Model 38720.4%+ 137.0%1811,0340.3%+ 61.6%11412489Renault Clio8680.4%– 7.4%791,7500.4%– 9.5%848690BYD Seal U8620.4%+ 1695.8%1131,3520.3%+ 1200.0%999991MG ZS8520.4%+ 205.4%1051,3940.3%+ 51.7%9713492Kia Sportage8470.4%+ 25.3%931,5390.4%– 10.6%918293Hyundai i208350.4%+ 10.9%951,4690.4%+ 8.7%959694Suzuki Vitara8090.4%+ 31.8%1171,2710.3%+ 23.5%10112095Dacia Duster8030.4%– 38.2%981,3820.3%– 47.2%986396Fiat 5007990.4%+ 715.3%591,8930.5%+ 609.0%789097Citroen C5 X/Aircross7270.3%– 39.7%1341,1010.3%– 48.1%10910898BYD Seal7250.3%+ 1759.0%811,5890.4%+ 1685.4%8914199Porsche 9116950.3%– 14.0%681,6750.4%+ 0.5%8595100VW ID.Buzz6930.3%– 6.7%1021,2580.3%+ 11.0%103110101Mercedes Sprinter6690.3%– 6.8%971,2530.3%– 1.3%10491102Mazda CX-606490.3%+ 21.1%1111,1490.3%+ 47.3%106107103Kia EV36370.3%+ 21.6%991,2120.3%+ 33.2%105101104Mercedes A-Klasse 6340.3%– 49.6%721,5860.4%– 16.6%9052105Ford Explorer6030.3%+ 16.6%1339800.2%+ 20.7%11888106Mazda35750.3%+ 45.9%1121,0740.3%+ 61.7%110140107Leapmotor T035660.3%+ 238.9%1428930.2%+ 203.7%129145108Volvo XC905620.3%– 32.6%1229970.2%– 37.3%115106109Dacia Jogger5580.3%– 51.7%1299800.2%– 58.4%11779110Fiat Grande Panda5580.3%new691,5300.4%new93189111Ford Focus5570.3%– 68.5%761,4900.4%– 51.8%9457112Renault 55430.3%– 17.2%1239770.2%– 2.6%119113113Kia Picanto5400.3%– 38.7%1081,0570.3%– 40.2%112105114Audi Q75300.3%+ 26.8%1488080.2%– 21.9%133137115Audi Q85300.3%– 34.2%1001,1020.3%– 32.3%108104116Jeep Avenger5220.2%+ 7.2%1209760.2%– 0.1%120123117Porsche Macan5190.2%+ 13.1%961,1170.3%+ 14.2%107130118Nissan X-Trail5100.2%+ 39.7%1199680.2%+ 21.8%122152119Hyundai i104940.2%– 58.7%1011,0610.3%– 54.1%11165120Hyundai i304930.2%– 12.6%1031,0400.3%– 15.5%113116121Renault Austral4890.2%+ 6.8%1319030.2%– 11.6%12693122Citroen Jumpy4870.2%+ 13.3%1259160.2%+ 31.8%125149123Ford Transit Connect4850.2%+ 13.6%871,2700.3%+ 52.6%102136124Mercedes Citan4840.2%+ 6.1%1159710.2%– 7.1%121138125MG S54800.2%new2045860.1%new150197126VW Touareg4670.2%– 11.4%1248970.2%– 8.9%128131127Cupra Tavascan4620.2%– 48.5%851,2880.3%– 25.2%10072128Mercedes G-Klasse4510.2%– 11.4%1069840.2%– 25.5%116128129Skoda Scala4510.2%– 9.6%1368080.2%– 12.4%134121130Peugeot 50084500.2%+ 83.7%1109580.2%+ 94.7%123146131BMW X24400.2%– 17.8%1189010.2%– 21.1%127112132MG RX64220.2%+ 160.5%1447210.2%+ 167.0%138132133Hyundai Ioniq54210.2%– 22.0%1288450.2%– 19.2%131127134Mercedes B-Klasse4160.2%– 5.2%1377710.2%– 47.3%137102135Opel Zafira Life4100.2%+ 355.6%1735960.1%+ 202.5%149226136Mercedes CLE4080.2%– 41.5%1079270.2%– 32.7%12497137Peugeot 3084070.2%– 52.1%1268340.2%– 46.6%132117138Hyundai Bayon3840.2%+ 83.7%1417140.2%+ 35.5%139166139Land Rover Defender3590.2%+ 91.0%1307750.2%+ 55.6%136158140Mercedes Vito3450.2%– 23.8%1396900.2%– 27.4%142109141Renault Symbioz3450.2%+ 100.6%1436620.2%+ 72.8%145161142Volvo EX303410.2%– 27.3%1516150.2%– 38.7%147147143BMW iX3400.2%+ 57.4%1406710.2%+ 78.0%144151144Fiat 6003390.2%– 27.3%1098470.2%– 17.9%130122145Peugeot Expert3330.2%+ 311.1%1496090.2%+ 344.5%148187146Renault Captur3220.2%– 38.7%1466170.2%– 45.6%146114147Toyota bZ4X3210.2%– 49.7%1386760.2%– 44.8%143144148Ford Transit Courier3170.2%– 4.2%1326960.2%+ 3.9%141160149Nissan Juke3010.1%– 27.3%1525720.1%– 28.1%151129150Leapmotor B102970.1%new1675050.1%new156286151Renault Kangoo2950.1%+ 6.9%1605340.1%– 4.8%152156152Citroen C4/C4 X2880.1%– 11.9%1147750.2%– 6.5%135111153Ford Capri2770.1%+ 28.8%1654930.1%+ 76.7%158155154MG 32770.1%– 60.2%1277020.2%– 19.6%140135155Peugeot Boxer2680.1%+ 97.1%2073720.1%+ 51.2%175190156Renault 42550.1%new1505290.1%new154204157Kia Stonic2470.1%– 30.0%1555090.1%– 30.3%155165158Volvo S/V602460.1%– 57.9%1784170.1%– 55.0%170153159Toyota Proace2400.1%– 5.5%1764160.1%– 34.4%171159160Range Rover Evoque2350.1%+ 36.6%1545000.1%+ 28.2%157186161Mitsubishi Grandis2330.1%new1564910.1%new159345162Mazda22290.1%– 43.0%1724180.1%– 45.7%169150163Leapmotor C102280.1%+ 1100.0%1833820.1%+ 712.8%173203164Xpeng G62270.1%+ 194.8%1634460.1%+ 256.8%165210165Kia EV42250.1%new2272920.1%new192255166VW Crafter2170.1%– 13.9%1684200.1%– 8.5%168163167Mazda62160.1%+ 266.1%1594620.1%+ 281.8%164198168Nissan Micra2160.1%new2422670.1%new195 –169Mercedes S-Klasse/EQS2140.1%– 9.3%1534800.1%– 2.4%160182170Toyota C-HR2130.1%– 59.5%1664270.1%– 62.8%16794171Range Rover Sport2090.1%+ 8.3%1704010.1%+ 1.0%172183172Hyundai Santa Fe2080.1%+ 6.7%2113060.1%– 37.2%189175173Porsche Taycan2080.1%– 19.4%1574660.1%– 0.2%163177174Peugeot 4082000.1%– 55.1%1933320.1%– 55.0%183162175BMW Z41960.1%– 37.4%1863420.1%– 22.4%180169176Kia EV51930.1%new1474780.1%new161365177Fiat Tipo1880.1%+ 1153.3%1893260.1%+ 340.5%184291178Nissan Townstar1830.1%– 34.2%1803500.1%– 30.6%178174179Alfa Romeo Junior1810.1%– 54.1%1584380.1%– 38.5%166154180Kia PV51770.1%new1753580.1%new176323181BMW X71760.1%+ 32.3%1693750.1%– 9.0%174170182Mitsubishi ASX1760.1%– 35.3%1823330.1%– 31.1%182157183Mitsubishi Outlander1730.1%new1454690.1%new162185184Mercedes GLS1650.1%+ 12.2%1853150.1%– 6.8%185196185Polestar 41650.1%+ 68.4%1355300.1%+ 101.5%153173186Kia EV61600.1%– 50.8%1873050.1%– 53.2%190167187Mazda CX-801600.1%– 35.0%1962810.1%– 34.7%193171188Porsche Panamera1600.1%+ 6.0%1743460.1%+ 18.5%179192189Renault Trafic1550.1%+ 19.2%2162390.1%– 2.4%203215190Honda HR-V1450.1%+ 16.9%1982630.1%+ 0.8%196212191BMW X61440.1%– 4.0%1793120.1%– 18.8%186176192BMW 7er1410.1%– 23.8%2092420.1%– 30.7%201181193Honda CR-V1410.1%– 18.0%2062450.1%– 12.5%199206194Renault Rafale1390.1%– 14.7%2032460.1%– 27.9%198164195Smart #11370.1%– 32.2%1773080.1%– 44.7%188194196Smart #51360.1%+ 2166.7%1643540.1%+ 5800.0%177214197Renault Espace1300.1%– 14.5%1972490.1%– 10.4%197184198BYD Sealion 71250.1%+ 1036.4%1842760.1%+ 790.3%194195199Subaru Forester1160.1%– 8.7%2191940.0%– 17.4%214222200DS 71150.1%– 70.3%2171970.0%– 61.1%212191201Honda Jazz1130.1%– 13.7%2181940.0%– 14.9%213209202Dacia Spring1110.1%– 65.2%1922440.1%– 79.4%200142203Hyundai Staria1110.1%+ 177.5%2022200.1%+ 228.4%206231204Jeep Wrangler1110.1%– 39.3%2102120.1%– 24.8%207241205Mitsubishi Eclipse Cross1070.1%– 33.1%1623410.1%+ 36.4%181227206Jeep Compass1050.0%– 72.0%1712950.1%– 58.3%191168207Kia EV91020.0%– 40.7%2341600.0%– 52.9%222229208Polestar 21010.0%– 36.9%1902390.1%+ 6.7%202211209Xpeng G91010.0%+ 32.9%2052070.1%+ 76.9%209234210Alpine A290970.0%+ 1516.7%2441450.0%+ 178.8%227256211Renault Scenic970.0%– 36.2%2141850.0%– 37.3%216200212Hyundai Ioniq6960.0%– 4.0%2531340.0%– 42.2%233240213Range Rover Velar900.0%– 21.7%1992080.1%– 26.2%208218214Kia Sorento890.0%– 27.0%2131810.0%– 35.4%218199215Man TGE880.0%+ 4.8%2002040.1%+ 8.5%210219216Lamborghini Urus870.0%– 9.4%2351450.0%– 5.2%228251217Hyundai Ioniq9860.0%new1912230.1%new205273218MG S6860.0%new –860.0%new253 –219Volvo EX90850.0%+ 32.8%1882240.1%+ 34.9%204216220Range Rover 840.0%– 34.9%2241570.0%– 50.2%224208221Toyota Urban Cruiser840.0%new2361390.0%new230416222Smart #3830.0%+ 13.7%2201600.0%– 23.1%223233223Alfa Romeo Stelvio810.0%– 29.6%2151660.0%– 24.5%221213224Citroen Berlingo810.0%– 79.4%2611150.0%– 86.8%239178225Mazda MX-5810.0%– 10.0%2311440.0%– 1.4%229224226Fiat Panda800.0%– 73.4%2081830.0%– 67.1%217193227Volvo ES90800.0%new –800.0%new260 –228Lexus LBX770.0%– 27.4%2221530.0%– 27.5%226217229Subaru Crosstrek770.0%– 1.3%2211540.0%+ 10.8%225236230BMW X4760.0%– 56.8%2011890.0%– 61.6%215172231BYD Atto 2760.0%+ 484.6%1613100.1%+ 1247.8%187225232Iveco Daily760.0%– 7.3%2331350.0%– 0.7%232253233Opel Combo760.0%– 49.0%288930.0%– 63.4%248257234Suzuki S-Cross740.0%– 69.8%1941980.0%– 51.5%211188235BMW XM730.0%+ 217.4%2401260.0%+ 28.6%235262236Toyota RAV4730.0%– 75.9%2121710.0%– 71.4%219148237Alfa Romeo Tonale680.0%+ 9.7%2261350.0%+ 15.4%231252238Ford Mustang670.0%– 71.6%2371210.0%– 66.3%236220239Lexus NX670.0%– 47.7%2391210.0%– 56.3%237232240Renault Megane640.0%+ 113.3%2561010.0%+ 60.3%243275241Opel Movano620.0%+ 113.8%292760.0%+ 49.0%262290242Subaru Outback620.0%– 24.4%2521010.0%– 40.9%244243243Audi e-Tron GT600.0%– 30.2%2251290.0%– 32.8%234238244Alfa Romeo Giulia560.0%– 28.2%267860.0%– 50.0%252248245Nissan Primastar560.0%– 52.9%2481000.0%– 47.4%245207246Renault Master560.0%+ 7.7%249990.0%+ 10.0%246266247Fiat Ulysse540.0%n/a2301190.0%+ 11800.0%238258248Renault Arkana530.0%– 69.0%274800.0%– 86.3%259180249Kia Niro520.0%– 62.9%255900.0%– 75.1%251201250Ford Mustang Mach-E510.0%+ 2.0%250910.0%+ 19.7%249271251Lynk & Co 08510.0%new263840.0%new255327252Honda ZR-V500.0%– 20.6%247940.0%– 10.5%247247253Peugeot Rifter500.0%– 29.6%2411030.0%– 12.0%242269254Mercedes AMG GT490.0%– 31.9%264820.0%– 41.8%257246255Tesla Model S470.0%+ 261.5%294610.0%+ 134.6%274324256Audi A8460.0%– 35.2%1951670.0%– 32.4%220230257Toyota Land Cruiser440.0%– 35.3%2321070.0%– 57.5%240267258VW Arteon440.0%– 45.7% –440.0%– 88.1%285264259KGM Tivoli430.0%– 31.7%245910.0%– 42.8%250245260Genesis GV70400.0%+ 33.3%303490.0%– 19.7%280278261Mercedes SL400.0%– 23.1%273680.0%– 20.0%265268262Lexus RX390.0%+ 44.4%2281060.0%+ 96.3%241260263Ferrari Roma380.0%+ 35.7%279620.0%+ 37.8%269296264KGM Rexton380.0%+ 31.0%280620.0%– 13.9%271282265Honda Civic370.0%– 38.3%251770.0%– 26.0%261235266KGM Actyon360.0%+ 38.5%262690.0%+ 165.4%264292267Suzuki Swace350.0%+ 25.0%243860.0%+ 68.6%254249268Ineos Grenadier340.0%+ 36.0%272620.0%+ 34.8%270281269Lamborghini Coupe range340.0%+ 78.9%281580.0%+ 7.4%276297270Toyota Prius340.0%+ 240.0%311420.0%+ 31.3%288304271Honda Prelude320.0%new306400.0%new291 –272Land Rover Discovery Sport310.0%– 31.1%266620.0%– 53.4%272254273Mazda CX-5300.0%– 92.4%345310.0%– 95.6%298202274Polestar 3300.0%+ 500.0%270590.0%+ 436.4%275280275KGM Korando290.0%– 60.8%283490.0%– 76.6%281263276KGM Torres290.0%– 3.3%254670.0%– 30.2%266276277Ferrari 12Cilindri270.0%+ 107.7%259620.0%+ 113.8%268293278Volvo C40260.0%– 58.7%258620.0%– 58.4%273277279Mitsubishi Colt250.0%– 88.6%287420.0%– 96.2%287133280Renault Twingo250.0%+ 1150.0% –250.0%+ 150.0%302375281Ferrari Purosangue240.0%– 17.2%271520.0%– 14.8%277288282Maserati Grecale240.0%+ 84.6%278500.0%+ 13.6%279285283Lexus UX210.0%– 59.6%269500.0%– 38.3%278270284Genesis GV60200.0%+ 53.8%282410.0%+ 70.8%290305285MG 4200.0%– 96.3%284400.0%– 95.3%292139286Alpine A390190.0%new246660.0%new267436287Kia K4190.0%new238730.0%new263326288Lynk & Co 01180.0%– 5.3%297310.0%+ 34.8%297274289MG Cyberster180.0%– 14.3%229840.0%+ 20.0%256283290Bentley Continental170.0%– 58.5%275430.0%– 48.2%286289291BYD Atto 3170.0%– 37.0%265480.0%– 14.3%282237292Ferrari 296 GTB170.0%– 68.5%285360.0%– 62.5%294279293Nissan Ariya170.0%– 90.3%286350.0%– 89.5%296239294Tesla Model X170.0%+ 30.8%317230.0%– 11.5%304331295BYD Tang150.0%+ 275.0%296280.0%+ 100.0%300311296DS 4150.0%– 89.9%276410.0%– 84.4%289265297Bentley Bentayga130.0%– 18.8%289280.0%– 20.0%299313298BYD Dolphin130.0%– 69.8%295260.0%– 73.2%301242299Mazda CX-6130.0%new –130.0%new316 –300DS No 8120.0%new300220.0%new305355301Jeep Renegade120.0%– 78.9%260470.0%– 63.0%283259302Lexus RZ110.0%+ 175.0%277370.0%+ 362.5%293284303GWM Wey 05100.0%– 58.3%290240.0%– 90.8%303261304GWM Ora 0390.0%– 85.7% –90.0%– 93.0%325223305Togg T10X90.0%new257460.0%new284328306Alpine A11080.0%– 27.3%331100.0%– 74.4%323301307Ferrari SF90/Stradale80.0%– 46.7%312150.0%– 55.9%311302308Lynk & Co 0280.0%– 20.0%320130.0%+ 30.0%315350309Zeekr 7X80.0%new314150.0%new312401310Porsche Cayman70.0%– 86.8%299180.0%– 81.6%307272311Togg T10F70.0%new305160.0%new310358312GWM Wey 0360.0%– 68.4%298170.0%– 58.5%309295313Land Rover Discovery60.0%– 78.6%291200.0%– 74.0%306294314Lucid Air60.0%– 33.3%316120.0%– 57.1%319312315Toyota Supra60.0%– 57.1%322110.0%– 52.2%322338316Vinfast VF660.0%+ 200.0%268360.0%+ 414.3%295308317Cadillac Escalade50.0%– 37.5%33370.0%– 65.0%332337318Lexus ES50.0%– 44.4%307130.0%– 13.3%313315319Lotus Eletre50.0%– 50.0%308130.0%– 59.4%314320320Maserati GranTurismo50.0%+ 25.0%32490.0%+ 12.5%328339321Mazda MX-3050.0%– 83.3%34660.0%– 90.8%336287322Volvo S/V9050.0%– 96.6%223810.0%– 65.8%258244323Honda E:NY140.0%+ 300.0%31890.0%+ 800.0%326330324Iveco Stralis40.0%n/a32970.0%n/a333363325Lotus Emeya40.0%+ 100.0%309120.0%+ 140.0%318349326Rolls-Royce Spectre40.0%– 71.4%310120.0%– 45.5%320342327Suzuki Across40.0%– 55.6%293180.0%– 65.4%308307328Vinfast VF840.0%– 75.0%32780.0%– 79.5%330333329Zeekr X40.0%new35550.0%new341392330Audi A730.0%– 98.4%32370.0%– 97.9%331221331GWM Ora 0730.0%– 25.0%34140.0%– 55.6%343344332Man TGL30.0%+ 50.0%32180.0%+ 300.0%329377333Mercedes Actros30.0%n/a33650.0%+ 66.7%339367334Subaru Impreza30.0%– 72.7%313100.0%– 23.1%324332335Xpeng P730.0%– 66.7%33750.0%– 64.3%340316336Audi A420.0%– 99.4%33240.0%– 99.5%342205337BMW 8er20.0%– 97.1%302110.0%– 90.2%321250338DS 320.0%+ 100.0% –20.0%– 87.5%348335339Fiat Doblo20.0%– 50.0%32850.0%+ 25.0%338370340Genesis G8020.0%+ 0.0% –20.0%– 33.3%349348341Hyundai Nexo20.0%n/a34230.0%n/a346 –342Iveco Eurocargo20.0%+ 0.0% –20.0%– 33.3%358374343Lexus LM20.0%– 89.5%301120.0%– 72.1%317310344Man TGS20.0%n/a34430.0%+ 200.0%347384345Mercedes Arocs20.0%n/a32560.0%+ 200.0%337371346NIO ET520.0%– 75.0% –20.0%– 84.6%359318347DAF XF10.0%n/a –10.0%n/a361439348Fiat Scudo10.0%n/a –10.0%+ 0.0%362372349Lotus Emira10.0%– 91.7%34320.0%– 93.1%352322350Lucid Gravity10.0%new31960.0%new335368351Mercedes Atego10.0%– 50.0%33040.0%+ 33.3%344373352NIO EL610.0%– 83.3% –10.0%– 88.9%368347353NIO ES810.0%+ 0.0% –10.0%– 85.7%369361354NIO Firefly10.0%new34820.0%new353385355Peugeot 50810.0%– 96.0%35120.0%– 96.1%354317356Toyota Mirai10.0%– 50.0%35320.0%– 50.0%355354357Volvo FH10.0%n/a35420.0%+ 100.0%356394358VW Up!10.0%– 91.7% –10.0%– 95.0%370321
Source: KBA


More Stories
2026 Chevrolet Colorado Invoice Pricing: Why Every Trim Has the Same Engine and Different Personality
The Colorado simplifies one part of midsize truck shopping that trips people up on almost every other pickup in this...
Lamborghini Teases a Wilder Urus That Could Take the Super SUV Fight to Another Level
Lamborghini looks ready to turn up the heat on the Urus once again, and the teaser image alone is enough...
10 Reliable Used Sedans Under $15,000 in 2026
Finding a dependable used sedan for under $15,000 is still very possible in 2026, even with the average used vehicle...
2027 Hyundai Elantra Debuts With Sharper Styling More Space and a Much Smarter Cabin
Hyundai has never been shy about giving its small cars big personality, and the all-new 2027 Hyundai Elantra looks like...
Malta Full Year 2024: Hyundai i10 best-seller, BYD Atto 3 up to #3
The Hyundai i10 is the best-selling vehicle in Malta in 2024. With a lot of delay and thanks to our...
Polestar Exits the U.S. Market as Connected Car Rules Reshape the EV Landscape
Polestar’s run in the United States is coming to an unexpected and rather abrupt halt. The Swedish EV brand, spun...