
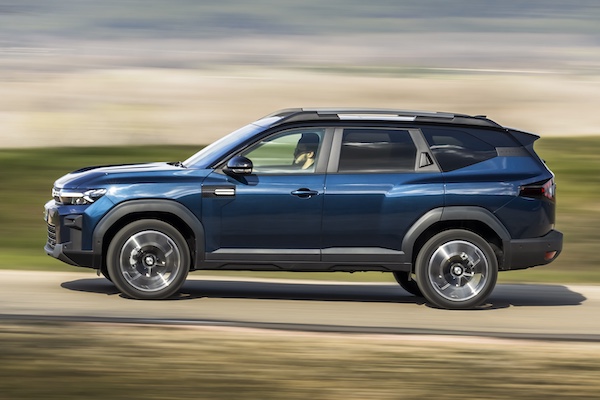
Romania November 2025: Dacia Bigster repeats at record #4
The Dacia Bigster breaks it volume and share records this month.
13,837 new cars found a buyer in Romania in November, a tremendous +35.2% year-on-year improvement. The year-to-date tally remains in negative however at -1.3% to 135,447. Local behemoth Dacia surges 60% (it was off -18.3% last year) to 32.7% share, well above the 28.8% it commands year-to-date Toyota (+27.8%) stays in 2nd place with 8.3% of the market above Renault (+63.4%) and Skoda (+28.1%). Hyundai (-6.1%) and Volkswagen (-18%) both struggle whereas Audi (+67.4%) and BMW (+45.2%) impress. Ford (+29.2%) and Mercedes (+18.9%) also score double-digit gains but trail the market. Further down, BYD breaks all its records at #13 with 198 sales and 1.4% share.
Model-wise, the Top 4 is 100% Dacia for the second month running. The Logan (+46%) leads the way with 11% share ahead of the Duster (+83%), Sandero (+47.9%) and the new Bigster repeating at an all-time high 4th place and smashing its volume and share records. The best of the rest is the Skoda Octavia (+55.2%) as usual while the Renault Clio (+314.6%) is up 4-fold year-on-year to #6. The Ford Puma (+172.8%) and Toyota Corolla (+65.8%) also outpace the market in the remainder of the Top 10. Below the Bigster, the next best-selling new launches are the BYD Seal U (#30) and Chery Tiggo 7 (#45).
Previous month: Romania October 2025: Dacia Bigster up to record 4th place
One year ago: Romania November 2024: Top 4 100% Dacia, Jogger hits record ranking
Full November 2025 Top 54 All brands and Top 291 All models below.
Romania November 2025 – brands:
PosBrandNov-25%/24Oct2025%/24PosFY241Dacia4,51932.7%+ 60.0%138,96028.8%– 2.5%112Toyota1,1498.3%+ 27.8%212,8309.5%+ 7.1%223Renault1,0217.4%+ 63.4%38,8446.5%+ 2.1%454Skoda9977.2%+ 28.1%410,1517.5%+ 7.3%335Hyundai7525.4%– 6.1%78,2306.1%– 14.0%646Volkswagen6754.9%– 18.0%58,6636.4%– 4.3%567Ford6644.8%+ 29.2%66,5124.8%+ 9.0%778Mercedes4353.1%+ 18.9%85,0813.8%+ 3.0%889BMW3922.8%+ 45.2%94,7393.5%+ 5.6%9910Audi3702.7%+ 67.4%102,8452.1%+ 8.2%131211MG3032.2%+ 30.0%112,8702.1%+ 58.1%121712Suzuki2561.9%– 11.1%143,6542.7%– 11.1%101013BYD1981.4%n/a194950.4%+ 49400.0%275814Mazda1901.4%+ 26.7%201,9891.5%– 21.4%161315SsangYong/KG Mobility1881.4%+ 3.9%172,2651.7%– 9.8%141416Kia1811.3%– 43.6%132,9512.2%– 24.9%111117Peugeot1631.2%– 0.6%162,2061.6%+ 6.7%151618Nissan1541.1%+ 294.9%157570.6%– 35.2%221919Cupra1331.0%+ 56.5%211,0690.8%+ 29.7%192320Opel1300.9%+ 85.7%227790.6%– 23.6%212121Tesla1210.9%+ 40.7%121,0260.8%– 56.3%201522Volvo1120.8%+ 23.1%181,3201.0%– 5.2%171823Chery 1070.8%new291830.1%new35 –24Citroen950.7%+ 265.4%241,1100.8%+ 45.7%182425Geely780.6%+ 680.0%235740.4%+ 2395.7%254126Porsche580.4%+ 65.7%324920.4%– 15.2%282727Honda560.4%– 1.8%256640.5%– 37.0%242028Jeep470.3%– 39.0%306740.5%– 21.4%232229Lexus430.3%+ 79.2%284070.3%+ 16.0%293030Land Rover380.3%+ 22.6%275150.4%– 12.7%262631Mitsubishi360.3%+ 260.0%263960.3%– 17.0%302932Seat350.3%+ 59.1%343310.2%– 47.3%322533Leapmotor260.2%+ 766.7%312090.2%+ 6866.7%344734Mini160.1%– 46.7%353110.2%+ 5.4%333135DS150.1%+ 150.0%451350.1%+ 104.5%373436Alfa Romeo130.1%+ 0.0%371820.1%+ 67.0%363237DFSK130.1%+ 550.0%431010.1%+ 573.3%394438Lynk & Co120.1%n/a38820.1%+ 1540.0%405139Subaru110.1%+ 175.0%361280.1%+ 156.0%383640Fiat80.1%– 80.0%333350.2%– 39.5%312841Bentley70.1%n/a44610.0%+ 110.3%414042BAIC40.0%+ 100.0%39530.0%+ 43.2%423743Ferrari30.0%– 50.0%42300.0%– 51.6%463544Forthing20.0%+ 100.0%46370.0%+ 94.7%444645SWM20.0%n/a –70.0%+ 133.3%525746Aston Martin10.0%n/a –190.0%+ 111.1%494947Chevrolet10.0%n/a –30.0%+ 200.0%536548Ineos10.0%+ 0.0% –250.0%+ 127.3%475049Jaecoo10.0%new –10.0%new70 –50Jetour10.0%n/a –20.0%– 33.3%585551Lamborghini10.0%+ 0.0%41500.0%+ 22.0%433852Omoda10.0%new –20.0%new59 –53Rolls-Royce10.0%– 50.0%40330.0%+ 32.0%454354Smart10.0%n/a –20.0%– 97.4%6033
Romania November 2025 – models:
PosModelNov-25%/24Oct2025%/24PosFY241Dacia Logan1,52711.0%+ 46.0%113,1668.6%– 5.2%112Dacia Duster1,3639.9%+ 83.0%311,8707.8%– 8.1%223Dacia Sandero7415.4%+ 47.9%27,2694.8%– 0.2%334Dacia Bigster5283.8%new42,7091.6%new8 –5Skoda Octavia4303.1%+ 55.2%64,2772.8%+ 14.4%446Renault Clio4273.1%+ 314.6%73,6912.4%+ 62.7%6117Toyota Corolla3782.7%+ 65.8%54,2082.8%+ 17.0%568Hyundai Tucson2842.1%– 18.6%123,2902.2%– 3.3%779Ford Puma2812.0%+ 172.8%81,9331.2%– 11.8%131210Toyota RAV42651.9%+ 1.5%92,7071.8%+ 2.3%9911Dacia Jogger2381.7%– 33.7%112,6341.8%– 23.7%10512Toyota Yaris Cross2111.5%+ 39.7%102,5461.7%+ 41.3%111513Ford Kuga2101.5%– 10.3%132,4521.7%+ 23.4%121314VW Tiguan1771.3%+ 11.3%211,6701.1%+ 27.9%152415MG ZS1541.1%+ 113.9%201,3820.9%+ 58.7%213916Renault Captur1531.1%+ 84.3%171,3730.9%+ 22.8%222817Hyundai Kona1511.1%+ 106.8%221,7481.2%+ 64.8%143118Skoda Scala1471.1%+ 56.4%321,3050.9%+ 6.4%252519Skoda Kodiaq1461.1%+ 1.4%281,2840.8%– 3.5%262320Toyota C-HR1441.0%+ 23.1%141,3680.9%– 22.0%231721Hyundai i301421.0%+ 9.2%441,2000.8%– 23.9%272122MG HS1260.9%+ 11.5%191,0120.7%+ 63.0%304923Dacia Spring1220.9%– 29.9%1421,3110.9%– 46.1%24824Renault 51170.8%n/a572180.1%+ 7166.7%10735025VW Golf1070.8%– 16.4%231,4411.0%– 14.1%191626Suzuki Vitara1050.8%+ 5.0%291,5191.0%– 12.6%161827Nissan Qashqai1000.7%+ 455.6%154470.3%– 32.9%685428Renault Mégane990.7%– 40.7%379290.6%– 47.8%331429Toyota Yaris980.7%+ 34.2%181,0840.7%+ 24.9%294130BYD Seal U970.7%new422460.1%new98 –31Kia Sportage960.7%– 55.6%261,4981.0%– 33.7%171032Mercedes GLE920.7%+ 41.5%279610.6%– 3.6%313333VW Polo910.7%– 17.3%257570.5%– 10.0%374034Suzuki SX4 S-Cross900.7%– 21.1%301,4961.0%+ 0.1%182235Peugeot 308880.6%+ 1157.1%1395090.3%+ 95.0%609336Skoda Superb800.6%– 8.0%317510.5%+ 26.6%385337BMW X3760.5%+ 245.5%475120.3%+ 38.8%587438Mercedes GLC750.5%– 3.8%369420.6%+ 9.4%323839VW Taigo750.5%– 63.8%331,3981.0%– 15.7%201940KG Mobility Korando740.5%– 30.2%401,1310.8%+ 9.9%283241Tesla Model Y740.5%+ 236.4%344520.3%– 42.4%664442BMW X5730.5%+ 135.5%395980.4%– 14.2%484843Audi Q5670.5%+ 346.7%245350.3%+ 136.7%5510244Skoda Fabia660.5%+ 57.1%917460.5%+ 12.5%404745Chery Tiggo 7650.5%new1021110.0%new152 –46Mazda3650.5%+ 22.6%606800.5%+ 7.1%455547VW Touareg650.5%+ 25.0%587150.5%+ 38.3%435848Renault Arkana640.5%– 21.0%507450.5%– 20.9%413449Skoda Kamiq620.4%+ 0.0%498840.6%– 8.9%343650Cupra Terramar600.4%n/a544450.3%+ 44400.0%7030551Audi A3590.4%+ 7.3%614790.3%+ 2.6%626752Mazda CX-30560.4%– 1.8%668010.6%+ 7.4%364553Suzuki Swift560.4%+ 30.2%834760.3%+ 11.5%636954Cupra Formentor550.4%– 25.7%515140.3%– 19.4%575255Audi Q5 Sportback520.4%+ 477.8%252930.0%– 22.5%16115156Hyundai i20520.4%– 38.1%487030.5%– 43.5%442657Renault Austral520.4%– 26.8%417460.5%– 35.0%392758Opel Mokka510.4%+ 1175.0%1682410.1%– 23.5%1017859Skoda Karoq510.4%– 23.9%438260.6%– 0.5%354260BYD Dolphin Surf490.4%new81930.0%new163 –61KG Mobility Torres490.4%+ 250.0%1002720.2%+ 1.5%919162Opel Corsa460.3%– 28.1%593080.2%– 37.3%846863Tesla Model 3460.3%– 28.1%165670.4%– 63.2%512064Ford Capri440.3%+ 4300.0%1141940.1%+ 19300.0%11634965VW Tayron440.3%new732620.2%new96 –66Ford Focus430.3%– 50.0%356460.4%– 36.3%463567Renault Megane E-Tech430.3%+ 152.9%2201920.1%– 28.9%1198868KG Mobility Tivoli420.3%– 14.3%825530.4%– 42.5%533769Audi A5410.3%+ 1950.0%763560.2%+ 917.1%7820270Audi Q3 Sportback410.3%+ 4000.0%772430.1%– 11.0%1008771Jeep Avenger400.3%– 27.3%785580.4%+ 47.2%527072BMW 3 Series390.3%+ 39.3%464570.3%– 31.9%645173BMW X6390.3%+ 14.7%704020.3%– 17.3%746674Ford Explorer390.3%+ 290.0%532720.2%+ 338.7%9018175Mercedes GLA390.3%+ 105.3%963640.2%+ 1.4%777776Nissan Juke390.3%+ 1850.0%871170.1%– 26.4%14812977Audi Q3380.3%+ 35.7%692710.2%+ 1.9%938978Hyundai i10380.3%+ 0.0%1103050.2%– 41.3%856579Porsche Cayenne370.3%+ 68.2%1132600.2%– 17.2%978080BMW X1360.3%– 10.0%755440.4%+ 10.8%546381Chery Tiggo 8350.3%new135600.0%new192 –82Mercedes CLA340.2%+ 3300.0%862160.1%+ 39.4%10912183Kia Xceed330.2%– 31.3%554960.3%– 6.2%616284Peugeot 208330.2%+ 106.3%634270.3%– 14.9%725985Renault Symbioz330.2%+ 106.3%804490.3%+ 920.5%6719086Geely Cityray310.2%new106710.0%new181 –87Mercedes C Class310.2%+ 158.3%1042620.2%+ 18.0%9510488Opel Frontera310.2%new1551300.1%new135 –89Peugeot 3008310.2%– 39.2%455780.4%+ 97.9%508490Audi A6300.2%– 9.1%1052030.1%+ 36.2%11113191Volvo EX30300.2%+ 36.4%921640.1%+ 13.9%12612392Citroen C3290.2%+ 625.0%934090.3%+ 69.7%737993Hyundai Inster290.2%new383530.2%new79 –94Volvo XC60290.2%– 19.4%624470.3%– 12.4%696495Mercedes G Class280.2%+ 64.7%1202720.2%+ 0.7%928696Citroen C5 Aircross270.2%+ 2600.0%231720.0%+ 44.0%17819997Mitsubishi ASX270.2%+ 800.0%1071720.1%+ 28.4%12513898BYD Saalion 7250.2%new99710.0%new180 –99Geely Coolray250.2%+ 150.0%942980.2%+ 1195.7%86235100Kia Ceed250.2%+ 4.2%686180.4%– 2.2%4756101VW Passat250.2%– 3.8%675160.4%+ 39.1%5673102Mazda CX-60240.2%+ 100.0%1152010.1%– 10.3%113103103Volvo XC40240.2%+ 50.0%843200.2%+ 36.2%8297104BMW 5 Series230.2%+ 53.3%1013370.2%+ 73.7%80109105Leapmotor T03230.2%+ 666.7%791930.1%+ 6333.3%117272106VW T-Cross230.2%– 66.7%647220.5%– 34.3%4229107Volvo XC90220.2%+ 37.5%712830.2%– 1.7%8783108Geely Starray210.2%new1181900.1%new120 –109Hyundai Bayon200.1%– 45.9%1032360.2%– 61.0%10257110Audi Q8190.1%– 47.2%743230.2%+ 28.7%8192111Mercedes V Class190.1%+ 46.2%972820.2%+ 23.1%8898112Toyota Camry190.1%+ 111.1%892810.2%+ 7.7%8990113Audi Q7180.1%+ 12.5%982170.1%+ 72.2%108139114BMW 2 Series 180.1%+ 12.5%1591250.1%– 0.8%140147115BYD Atto 2180.1%new133380.0%new218 –116Mercedes GLB180.1%– 33.3%1162680.2%+ 22.9%94101117MG 3180.1%– 53.8%723810.3%+ 240.2%76140118Honda CR-V170.1%+ 750.0%1521460.1%– 62.3%13176119Honda HR-V170.1%+ 70.0%851950.1%– 15.2%115105120Hyundai Santa Fe170.1%– 41.4%951980.1%+ 90.4%114149121Mazda6170.1%n/a197250.0%– 55.4%244194122Seat Leon170.1%+ 70.0%1171240.1%– 38.9%141107123Citroen C4160.1%+ 60.0%1093820.3%+ 23.6%7581124Cupra Leon160.1%+ 60.0%191830.0%– 44.7%168134125Ford Transit Custom160.1%– 62.8%655110.4%+ 221.4%59106126Mercedes A Class160.1%+ 220.0%902290.2%+ 21.2%106111127Mercedes E Class160.1%– 11.1%1482360.2%+ 5.4%103100128Honda Civic150.1%– 34.8%1851920.1%– 31.9%11885129KG Mobility Rexton150.1%+ 25.0%1262310.2%– 8.7%10494130Nissan X-Trail150.1%– 11.8%1671220.1%– 50.6%14395131BMW X7140.1%+ 366.7%1241130.1%– 34.7%151119132Lexus NX140.1%+ 133.3%1301450.1%+ 31.8%132154133Renault Rafale140.1%+ 40.0%1452300.2%+ 461.0%105197134VW ID.3140.1%+ 133.3%1221260.1%– 0.8%139141135BMW 7 Series130.1%+ 44.4%1281790.1%+ 15.5%124127136Mazda CX-80130.1%+ 160.0%1711230.1%+ 2360.0%142258137Porsche 911130.1%+ 160.0%1561280.1%+ 80.3%136178138VW ID.4130.1%+ 160.0%1121870.1%+ 54.5%122136139BMW i4120.1%+ 71.4%1461050.1%– 32.7%156124140Lexus RX120.1%+ 140.0%1441370.1%+ 0.0%133133141Mazda2120.1%– 7.7%1191190.1%– 50.0%14499142Mercedes EQA120.1%– 36.8%1491100.1%– 25.2%155132143Mercedes Vito120.1%– 33.3%131650.0%– 60.4%188126144Skoda Elroq120.1%new244480.0%new204 –145VW Caddy120.1%– 25.0%1501880.1%+ 28.8%121122146VW Caravelle120.1%n/a158730.0%n/a177 –147Kia Stonic110.1%– 31.3%1431110.1%– 46.1%153108148Range Rover 110.1%+ 10.0%1721470.1%– 16.9%130117149Alfa Romeo Junior100.1%+ 25.0%1411470.1%+ 1737.5%129275150Citroen Jumpy/Spacetourer100.1%+ 42.9%2051010.1%+ 573.3%158239151DS 4100.1%+ 233.3%263670.0%+ 219.0%187250152Ford Tourneo Courier100.1%– 41.2%1511270.1%– 30.6%137113153Range Rover Sport100.1%+ 0.0%881860.1%+ 10.7%123120154Renault 4100.1%new132330.0%new228 –155Toyota Aygo X100.1%– 23.1%1791180.1%– 68.5%14675156Toyota Proace100.1%– 9.1%174860.1%– 18.9%167157157BMW XM90.1%– 10.0%169930.1%+ 9.4%162162158BYD Seal90.1%n/a134470.0%+ 4600.0%205370159Citroen e-C390.1%new –520.0%new198397160Ford Tourneo Custom90.1%+ 12.5%1772080.1%+ 110.1%110156161Hyundai Staria90.1%new153600.0%new193 –162Land Rover Defender90.1%+ 50.0%187910.1%– 9.0%164159163Mercedes GLS90.1%– 25.0%1371330.1%– 8.3%134128164Mini90.1%– 55.0%1112020.1%+ 16.8%112114165BMW 1 Series80.1%– 20.0%1363190.2%+ 78.2%83110166DFSK E580.1%+ 700.0%206780.1%+ 3800.0%173314167Ford Mustang Mach-E80.1%+ 300.0%176510.0%– 35.4%200171168Hyundai Ioniq 580.1%+ 14.3%160870.1%– 42.4%166130169KG Mobility Actyon80.1%new129780.1%new174 –170Kia EV380.1%new170470.0%new206347171Lexus LBX80.1%+ 0.0%165690.0%+ 76.9%184210172Seat Ateca80.1%+ 0.0%173900.1%– 30.8%165146173BMW 4 Series70.1%+ 0.0%1234550.3%+ 269.9%65143174Mercedes Maybach GLS70.1%n/a238370.0%+ 60.9%220243175Mitsubishi Outlander70.1%n/a127810.1%n/a171 –176Seat Arona70.1%+ 133.3% –1020.1%– 28.2%157137177Chery Tiggo 460.0%new182110.0%new286 –178Lynk & Co 0860.0%new214110.0%new288 –179Mercedes S Class60.0%– 25.0%1211160.1%– 37.6%149112180Subaru Forester60.0%+ 500.0%162810.1%+ 523.1%172277181Volvo V6060.0%n/a175290.0%– 42.0%236201182VW ID.760.0%+ 500.0%249330.0%– 26.7%229207183VW Multivan60.0%– 40.0%189750.1%– 5.1%176168184BMW X450.0%– 16.7%230950.1%– 45.4%159118185DS 7 Crossback50.0%+ 66.7%232630.0%+ 53.7%190211186Fiat 60050.0%– 81.5%1921170.1%+ 62.5%147174187Jeep Wrangler50.0%– 28.6%267320.0%– 38.5%231192188Lexus ES50.0%+ 150.0%211240.0%+ 41.2%246260189Mercedes EQE50.0%– 64.3%237640.0%– 43.4%189150190Mercedes Sprinter50.0%+ 66.7%154500.0%– 35.1%201170191Peugeot 200850.0%– 94.1%525810.4%– 22.3%4946192Porsche Macan50.0%+ 0.0%218550.0%– 53.4%196152193Audi Q640.0%+ 100.0% –260.0%+ 225.0%240306194BMW iX40.0%+ 0.0%258350.0%– 14.6%223208195BMW iX140.0%– 20.0%147690.0%– 12.7%183167196BMW X240.0%– 60.0%1801600.1%+ 119.2%127169197Citroen C3 Aircross40.0%n/a183330.0%– 26.7%227209198DFSK Fengon 50040.0%new262160.0%new266 –199Honda Jazz40.0%+ 100.0%207320.0%+ 18.5%230236200MG440.0%+ 33.3%166470.0%– 70.8%207125201Mini Aceman40.0%+ 300.0%239400.0%+ 3900.0%217326202Peugeot 500840.0%+ 33.3%200610.0%+ 205.0%191247203Renault Kangoo40.0%– 63.6%1571150.1%+ 64.3%150166204Renault Scenic E-Tech40.0%– 20.0%108710.0%+ 47.9%182195205Subaru Crosstrek40.0%new –40.0%new345 –206Suzuki Across40.0%+ 300.0% –190.0%– 20.8%256245207Toyota bZ4X40.0%– 33.3%247500.0%+ 13.6%202203208VW T-Roc40.0%– 87.1%564300.3%– 35.7%7150209Bentley Continental GT30.0%n/a228360.0%+ 260.0%221279210BMW ix230.0%+ 200.0%204140.0%+ 0.0%280276211Fiat Panda30.0%n/a163510.0%+ 363.6%199283212Honda ZR-V30.0%– 85.0%178940.1%– 24.8%160142213Land Rover Discovery30.0%+ 200.0%210160.0%+ 60.0%267291214Leapmotor C1030.0%new196160.0%new269369215Lexus UX30.0%+ 200.0%212230.0%– 39.5%247213216Lynk & Co 0130.0%+ 200.0%188490.0%+ 716.7%203301217Lynk & Co 0230.0%new213220.0%new251 –218Mazda MX-530.0%n/a269170.0%– 54.1%264215219Mercedes EQB30.0%– 66.7%215420.0%– 28.8%212184220Mini Countryman30.0%– 66.7%199690.0%– 40.0%185153221Range Rover Evoque30.0%+ 50.0%219410.0%– 44.6%214175222Seat Ibiza30.0%+ 200.0%243160.0%– 68.6%270198223Skoda Enyaq30.0%– 40.0%245310.0%– 70.2%234158224Toyota Land Cruiser 150/20030.0%– 62.5%1402440.2%+ 100.0%99144225Alfa Romeo Stelvio20.0%+ 0.0% –150.0%– 46.4%273228226Bentley Bentayga20.0%n/a227170.0%+ 21.4%263270227Bentley Continental Flying Spur20.0%n/a –80.0%+ 60.0%307322228BMW 2 Series Tourer20.0%– 71.4%255570.0%– 23.0%194165229BMW Z420.0%n/a181130.0%+ 44.4%283298230Cupra Tavascan20.0%+ 100.0%261210.0%+ 950.0%253337231Ford Transit20.0%n/a164260.0%– 23.5%241224232Hyundai Ioniq 620.0%– 33.3%236440.0%– 35.3%210182233Jeep Compass20.0%– 84.6%208750.1%– 80.1%17572234Kia Niro20.0%– 71.4%209530.0%– 3.6%197193235Kia Picanto20.0%+ 100.0%195200.0%– 45.9%255219236Kia Sorento20.0%– 66.7%268680.0%+ 83.8%186217237Mercedes CLE20.0%– 90.0%198830.1%+ 2.5%169163238Mercedes EQS20.0%+ 0.0%270300.0%– 25.0%235205239Mercedes SL20.0%n/a –150.0%– 42.3%277242240Mitsubishi Colt20.0%n/a1381110.1%+ 35.4%154173241Opel Grandland X20.0%n/a217420.0%– 10.6%213204242Porsche Taycan20.0%+ 100.0% –100.0%– 41.2%294261243Range Rover Velar20.0%+ 0.0%242180.0%– 33.3%262237244Toyota Prius20.0%+ 100.0% –190.0%– 13.6%257254245Toyota Proace City Verso20.0%– 33.3%201270.0%– 55.7%239185246Toyota Supra20.0%n/a20.0%– 66.7%370316247Alfa Romeo Tonale10.0%– 50.0% –110.0%– 82.3%285187248Aro10.0%n/a –10.0%+ 0.0%371391249Aston Martin DBX10.0%n/a –40.0%– 42.9%336317250Audi A410.0%– 94.7%251340.0%– 93.7%22660251Baic BJ3010.0%new190150.0%new274 –252Baic BJ40 PRO10.0%new –10.0%new372 –253Baic BJ6010.0%new253140.0%new278 –254BAIC X7510.0%– 50.0% –180.0%– 18.2%259246255BMW i510.0%n/a229220.0%– 24.1%250226256Chery Tiggo 910.0%new –10.0%new373 –257Chevrolet10.0%n/a10.0%n/a374 –258DFSK Fengon 60010.0%+ 0.0% –70.0%+ 600.0%312348259Ferrari F1210.0%new26440.0%new339 –260Ferrari Purosangue10.0%– 66.7% –60.0%– 68.4%314256261Ferrari Roma10.0%n/a23360.0%– 53.8%315278262Ford Bronco10.0%– 66.7%265200.0%– 4.8%254231263Ford Mustang10.0%– 66.7%193440.0%+ 25.7%209216264Forthing 410.0%+ 0.0%266250.0%+ 56.3%242269265Forthing 510.0%n/a –60.0%+ 100.0%316343266Geely EX510.0%new194150.0%new275 –267Ineos Grenadier10.0%+ 0.0% –250.0%+ 127.3%243292268Jaecoo 7 PHEV10.0%new –10.0%new385 –269Jetour Dashing10.0%new –10.0%new387 –270Kia EV410.0%new –10.0%new390 –271Kia EV610.0%+ 0.0% –90.0%– 65.4%300241272Lamborghini Urus10.0%n/a186420.0%+ 121.1%211259273Lexus LM 10.0%+ 0.0% –40.0%+ 300.0%342402274Mercedes AMG GT10.0%– 66.7%1611190.1%+ 197.5%145212275Mercedes T-Class10.0%+ 0.0%273180.0%– 10.0%261253276MG S510.0%new21650.0%new330 –277Omoda 910.0%new –20.0%new366 –278Peugeot 400810.0%new –10.0%new402 –279Peugeot 40810.0%– 50.0% –350.0%– 69.0%225155280Porsche Panamera10.0%+ 0.0% –280.0%+ 33.3%238252281Renault Kadjar10.0%n/a10.0%+ 0.0%404379282Rolls-Royce Cullinan10.0%n/a221170.0%+ 112.5%265310283Smart #110.0%new –10.0%new408 –284Subaru Outback10.0%– 50.0%222160.0%+ 6.7%271268285Suzuki Jimny10.0%n/a24690.0%n/a304 –286SWM G01 PRO10.0%new –10.0%new412 –287SWM G03F10.0%new –30.0%new355 –288Tesla Model X10.0%n/a –50.0%– 68.8%333263289Toyota Highlander10.0%– 94.1% –720.1%– 76.2%17982290Volvo EC4010.0%new248130.0%new284 –291VW California10.0%n/a27930.0%+ 50.0%356364
Source: DRPCIV


More Stories
2026 Nissan Frontier PRO-4X Gets Patriotic Stars and Stripes Badge for America’s 250th Birthday
Nissan is adding a little red, white, and blue attitude to the 2026 Frontier, but in a more subtle way...
Driving a Manual Transmission May Be Good for Your Brain, and Enthusiasts Finally Have Science on Their Side
Manual transmission fans have always had plenty of emotional reasons to defend the clutch pedal. The feel of a perfectly...
The Most Common Accidents Associated with Truck Accidents
Truck accidents are usually cruel, with a higher risk of deaths than collisions between two passenger cars. One reason is...
2026 Mercedes-Benz GLE Pricing: What Real Buyers Are Actually Paying Across All Seven Trims
Luxury SUV shopping plays by different rules than mainstream brands, and the GLE makes that clear in an unexpected way:...
Aston Martin Brings Its Fiercest S Models to the 2026 Goodwood Festival of Speed
Aston Martin is heading back to the Goodwood Festival of Speed with the kind of lineup that feels tailor-made for...
Porsche 911 GT4 R Brings the Iconic 911 Platform to Global GT4 Racing for 2027
Porsche is giving its customer motorsport ladder a major shakeup with the introduction of the new 911 GT4 R, marking...