
Spain October 2025: Peugeot 2008, Dacia Duster impress in market up 15.9%
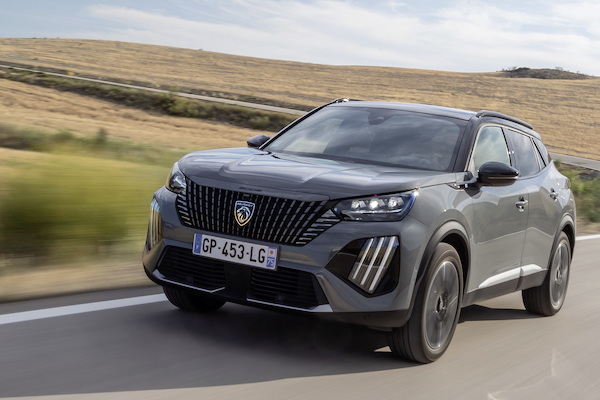
Peugeot 2008 sales are up by a whopping 164.5% year-on-year.
It’s another fantastic month for the Spanish new car market, up 15.9% year-on-year in October to 96,785 units. Contrary to most main European markets, we are almost at the pre-pandemic levels of October 2019 (97,986), which was the best month in a decade. The year-to-date tally is up 14.8% to 951,516. A sign of a healthy market, private sales lead the charge at +23.9% to 51,359 units and 53.1% share vs. 49.6% a year ago, company sales are up 10.2% to 39,860 and short term rental sales drop -5.2% to 5,566. Year-to-date, private sales rise 20.2% to 440,081, company sals are up 12.1% to 335,679 and rental sales grow 8.1% to 175,756.
The main headline this month is rechargeable cars (BEV+PHEV) hitting a record 22.4% share thanks to sales up 119% YoY to 21,687, with YTD volumes doubling YoY to 180,429 and 19% share vs. 11% a year ago. Looking at sales by region, Comunidad Valencia (+38.1%) continues to benefit from replacement cars in the wake of the storm, with Castilla la Mancha (+54.7%),an Cantabria (+54.1%) and Andalucia (+21.6%) also very dynamic. Madrid is up 16.2% to 38.6% share.
As for the brands ranking, Toyota (-17.4%) remains in the lead despite an atrocious YoY evolution, distancing Renault (+18.3%) up to 7.3% share. The Top 4 is unchanged on last month with Volkswagen (+12.4%) and Dacia (+32.5%) in tow. Dacia advances to #5 year-to-date, passing Hyundai (-7.9%). Peugeot (+37%) lodges the biggest YoY gain in the Top 10, with BMW (+22.2%) also beating the market at #10. BYD (+251.2%) breaks its monthly volume record for 2nd month in a row and climbs to a best-ever #14, also reached last August. Newcomer Ebro, assembling and selling rebadged Chery cars, steps into the Top 20 for the second time at #20. Meanwhile Chery-owned Jaecoo (+211.2%) and Omoda (+50.4%) shine below. Tesla is off -30.6%.
Model-wise, the Dacia Sandero (+9.5%) is well ahead of the competition with 3.6% share vs. 3.4% year-to-date. The Peugeot 2008 (+165.5%) literally takes up and climbs 18 spots on last month to #2. It now ranks #10 year-to-date vs. #12 last year. The Renault Clio (+52.2%) surges ahead in an excellent month for French vehicles. The Seat Ibiza (+15.3%) and Toyota C-HR (+13.2%) exchange spots vs. last month to #4 and #5 respectively, and although they trail the market slightly they still post solid gains. The Nissan Qashqai (+3.1%) is shy YoY but improve 9 ranks on September to #6. Outstanding scores also for the Dacia Duster (+67.6%) and VW T-Roc (+53.1%). The BYD Dolphin Surf (#42) is the best-selling recent launch.
Previous month: Spain September 2025: Toyota and Dacia Sandero dominate in market up 16.4%
One year ago: Spain October 2024: Toyota (+23.7%), VW (+39.7%), Renault (+38.4%) highlight positive market
Full October 2025 Top 64 All brands and Top 325 All models below.
Spain October 2025 – brands:
PosBrandOct-25%/24Sep2025%/24PosFY241Toyota7,3657.6%– 17.4%181,0478.5%+ 3.4%112Renault7,0807.3%+ 18.3%267,7547.1%+ 34.6%253Volkswagen6,9377.2%+ 12.4%363,0686.6%+ 15.2%324Dacia6,3256.5%+ 32.5%454,9845.8%+ 24.5%575Hyundai5,1575.3%– 7.9%653,9665.7%+ 1.4%646Seat4,9925.2%+ 7.5%555,4985.8%+ 5.1%437Peugeot4,8795.0%+ 37.0%1148,0035.0%+ 8.9%888Mercedes4,8375.0%+ 15.0%843,0104.5%+ 10.5%999Kia4,6614.8%+ 2.0%752,9565.6%+ 8.6%7610BMW4,2694.4%+ 22.2%1237,8364.0%+ 5.3%111011Skoda4,0614.2%+ 10.3%1035,5503.7%+ 21.2%121312MG3,7253.8%+ 37.5%938,9894.1%+ 58.5%101513Audi3,6283.7%+ 1.6%1432,6183.4%+ 0.3%131114BYD2,8062.9%+ 251.2%1519,4232.0%+ 497.8%192815Nissan2,7632.9%– 0.4%1629,5543.1%+ 12.4%141416Cupra2,5652.7%+ 30.1%2021,8402.3%+ 19.1%181817Ford2,4062.5%+ 22.8%1825,4002.7%+ 20.9%161718Citroen2,2222.3%+ 22.0%1729,2733.1%– 14.4%151219Opel1,7831.8%+ 32.5%1922,1262.3%+ 0.0%171620Ebro1,6511.7%new228,6830.9%new265821Omoda1,4331.5%+ 50.4%2310,8231.1%+ 83.5%232622Volvo1,3381.4%+ 3.0%2411,7421.2%– 16.6%221923Mazda1,3301.4%+ 1.7%2115,5141.6%+ 13.1%202024Jaecoo9741.0%+ 211.2%257,8100.8%+ 1635.6%283825Jeep9551.0%+ 20.3%278,7910.9%+ 0.4%242326Lexus8740.9%– 0.3%267,9350.8%+ 5.7%272427Mini8420.9%+ 29.3%287,6710.8%+ 24.9%292528Fiat7290.8%– 3.3%308,7480.9%– 28.9%252229Honda4530.5%+ 4.1%313,9400.4%+ 25.6%323330Suzuki3960.4%– 30.9%294,5840.5%– 17.9%312731Tesla3930.4%– 30.6%1312,6881.3%+ 7.6%212132Alfa Romeo3830.4%+ 74.9%322,7740.3%+ 16.0%353533Leapmotor3720.4%+ 7340.0%332,1260.2%+ 42420.0%374634KGM/SsangYong3660.4%+ 37.1%353,3760.4%– 17.4%332935Mitsubishi2810.3%+ 5.2%375,3980.6%+ 28.9%303036Porsche2600.3%– 41.4%342,9210.3%– 15.2%343237Lynk & Co2060.2%+ 123.9%381,4800.2%+ 30.7%393738Land Rover1900.2%– 8.2%362,6750.3%+ 6.9%363439DS1740.2%– 37.9%391,5780.2%– 54.8%383140Evo1320.1%+ 53.5%411,0390.1%+ 139.4%404141Subaru1020.1%– 37.4%431,0360.1%– 8.9%413642SWM680.1%+ 51.1%466580.1%+ 294.0%434543Smart630.1%– 25.9%454930.1%– 41.9%473944Xpeng540.1%+ 285.7%425080.1%+ 1932.0%455045Lancia490.1%+ 276.9%514980.1%+ 3457.1%465446Polestar480.0%– 5.9%406590.1%+ 30.2%424047Alpine440.0%+ 528.6%493340.0%+ 610.6%485148Bestune360.0%new442330.0%new49 –49Livan280.0%+ 180.0%502100.0%+ 2000.0%515950DFSK220.0%– 21.4%475100.1%+ 139.4%444351Maserati220.0%+ 0.0%532130.0%– 17.8%504452Dongfeng180.0%#DIV/0!481960.0%+ 19500.0%525653Ferrari90.0%+ 28.6%58890.0%+ 32.8%544854Bentley80.0%+ 60.0%54710.0%+ 57.8%565255BAIC50.0%#DIV/0!56210.0%+ 950.0%617356Ineos30.0%– 50.0%571270.0%+ 126.8%534957Aston Martin30.0%– 25.0%55700.0%+ 40.0%575358Voyah30.0%n/a64140.0%+ 27.3%656159Yudo20.0%– 33.3% –190.0%– 66.7%635560Lamborghini10.0%– 87.5%60600.0%+ 36.4%585761DR Motor10.0%– 66.7%52190.0%+ 137.5%626462McLaren10.0%– 50.0% –100.0%+ 66.7%666763Rolls Royce10.0%n/a6730.0%+ 0.0%747164KTM10.0%n/a –10.0%n/a80 –
Spain October 2025 – models:
PosModelOct-25%/24Sep2025%/24PosFY241Dacia Sandero3,4843.6%+ 9.5%132,2503.4%+ 18.5%112Peugeot 20082,2592.3%+ 164.5%2016,2711.7%+ 11.5%10123Renault Clio2,1052.2%+ 52.2%320,1802.1%+ 28.0%374Seat Ibiza1,8131.9%+ 15.3%519,1822.0%+ 7.4%435Toyota C-HR1,7711.8%+ 13.2%416,1461.7%+ 14.3%1286Nissan Qashqai1,7221.8%+ 3.1%1516,4221.7%+ 11.1%9117Toyota Corolla1,7081.8%– 22.6%618,2991.9%– 2.9%528Renault Captur1,6961.8%+ 12.6%916,1901.7%+ 26.0%11139VW T-Roc1,6761.7%+ 53.1%1015,1561.6%+ 20.3%141510Dacia Duster1,6021.7%+ 67.6%2412,6101.3%+ 22.4%191811Hyundai Tucson1,5391.6%– 15.8%1217,0221.8%– 3.5%7412Hyundai Kona1,5061.6%+ 24.6%1611,9111.3%+ 14.3%222113VW Tiguan1,4991.5%+ 59.3%2210,5401.1%+ 17.7%253314Toyota Yaris Cross1,4901.5%– 25.4%1115,8681.7%+ 7.0%13915MG ZS1,4751.5%– 19.4%820,7262.2%+ 23.1%2516Peugeot 2081,3691.4%+ 3.3%1716,9521.8%+ 54.6%81917Seat Arona1,3481.4%+ 11.8%1317,6721.9%+ 4.6%6618Seat Leon1,3411.4%+ 23.3%2313,3521.4%+ 35.6%172219Kia Sportage1,2651.3%– 3.1%3113,2511.4%– 12.6%181020MG HS/EHS1,2241.3%+ 325.0%218,9350.9%+ 142.1%377221Toyota Yaris1,2211.3%– 12.2%713,4631.4%+ 0.8%161422Renault Austral1,2071.2%– 20.5%279,3251.0%– 3.9%312723Mercedes GLC1,1881.2%+ 6.5%1810,8121.1%+ 29.4%243224Opel Corsa1,1111.1%+ 34.3%2614,5241.5%+ 15.1%151625VW Taigo1,1001.1%+ 4.7%3612,5501.3%+ 79.3%203626Ford Kuga1,0721.1%+ 40.5%399,0661.0%+ 35.9%355327BMW X11,0681.1%+ 15.2%519,9211.0%+ 5.9%282428Skoda Fabia1,0541.1%– 3.6%308,9880.9%+ 47.4%364529Kia Niro1,0251.1%+ 40.6%379,2391.0%+ 10.2%333530Kia Stonic9961.0%+ 14.2%1911,8271.2%+ 31.2%233131Skoda Kamiq9891.0%+ 18.3%299,3021.0%+ 16.2%323432MG 39321.0%+ 167.0%478,1830.9%+ 380.8%409133Cupra Formentor9291.0%+ 23.7%528,0050.8%– 16.0%423034Cupra Leon9190.9%+ 89.5%657,1570.8%+ 7.4%494235VW T-Cross9090.9%– 26.6%549,7241.0%– 9.6%292036Toyota RAV48870.9%– 13.9%1410,3951.1%– 4.4%262337BYD Seal U8830.9%+ 143.3%418,3100.9%+ 794.5%3910938Hyundai i208780.9%– 13.5%4310,2121.1%+ 1.9%272539Audi Q38760.9%– 13.4%556,3300.7%– 35.7%532840Mercedes GLA8600.9%+ 35.2%337,4960.8%– 1.5%464041Jeep Avenger8590.9%+ 30.0%466,7420.7%+ 32.0%516142BYD Dolphin Surf8460.9%new602,7960.3%new95 –43Mini Lineup8420.9%+ 29.3%357,6710.8%+ 24.9%444944Omoda 58390.9%– 7.6%448,0930.9%+ 39.3%415045Ford Puma8380.9%+ 54.3%349,1621.0%+ 19.8%343746BMW X37770.8%+ 209.6%454,3200.5%+ 44.5%737647Peugeot 30087620.8%+ 79.3%597,0160.7%– 7.5%504148Audi A37560.8%+ 18.5%487,6080.8%+ 23.1%455449Jaecoo 77500.8%+ 139.6%327,4580.8%+ 1557.3%4714350Volvo XC407450.8%+ 11.7%505,7350.6%– 11.5%573951Ebro S7007390.8%new385,3310.6%new6130652Citroen C3 Aircross7270.8%+ 500.8%533,6710.4%– 42.0%796053Nissan Juke6970.7%– 5.8%408,8550.9%+ 10.3%383854Citroen C46830.7%– 26.3%2812,3811.3%+ 21.8%212655Mercedes A Class6730.7%+ 17.2%775,6430.6%+ 0.6%595556Cupra Terramar6050.6%+ 62.2%674,7870.5%+ 997.9%6816157Dacia Bigster5980.6%new693,1160.3%new88 –58Kia EV35820.6%+ 429.1%564,7930.5%+ 4257.3%6715959Mazda CX-305660.6%+ 49.3%425,8420.6%+ 24.3%566460Omoda 95630.6%new727,3290.8%new48 –61VW Golf5570.6%– 44.3%586,4150.7%– 1.3%524862Citroen C3 5560.6%+ 49.9%579,6871.0%– 23.9%301763Skoda Karoq5210.5%– 27.2%626,2930.7%+ 7.3%545164BMW X24960.5%– 9.2%715,3110.6%+ 58.1%627365Audi Q54930.5%+ 5.8%494,1440.4%+ 21.6%747166Seat Ateca4900.5%– 33.3%645,2620.6%– 21.0%644367Skoda Octavia4890.5%+ 6.8%733,6990.4%– 7.2%786968Ebro S8004790.5%new1082,1680.2%new105 –69Renault Rafale4550.5%+ 102.2%903,6420.4%+ 269.0%8012070Dacia Jogger4390.5%– 29.9%705,2890.6%– 14.3%635271Renault Symbioz4390.5%+ 268.9%665,9700.6%+ 825.6%5513572Renault Arkana4350.4%– 47.3%615,5140.6%– 15.4%604673Renault 54340.4%+ 270.9%923,7030.4%+ 2748.5%7720674Ebro S4004330.4%new861,1840.1%new137 –75BMW 1-Series4130.4%+ 80.3%783,9900.4%– 19.2%756376Skoda Kodiaq4050.4%+ 16.0%992,9030.3%+ 37.4%909377Kia Xceed3890.4%– 42.6%855,0410.5%– 19.6%654778Audi A13850.4%– 2.3%1024,7490.5%+ 16.5%707079Opel Frontera3740.4%new882,1730.2%new104 –80Fiat 6003720.4%+ 192.9%1434,7770.5%+ 736.6%6914081Mercedes CLA3670.4%+ 17.6%982,4760.3%– 2.8%1008982BYD Atto 23530.4%new681,8700.2%new116 –83Mazda33450.4%+ 27.8%813,3820.4%+ 33.5%858684Alfa Romeo Junior3430.4%+ 586.0%941,9440.2%+ 2890.8%11221285Audi Q23380.3%– 37.2%833,5280.4%– 25.6%846786Tesla Model Y3380.3%+ 42.0%254,9240.5%+ 18.1%666587Lexus LBX3370.3%– 4.3%752,8750.3%+ 15.5%918788VW Polo3340.3%– 32.8%633,5930.4%– 40.7%835789Ford Focus3260.3%– 33.6%825,7100.6%+ 5.2%585690Audi A53230.3%+ 438.3%1042,4130.3%+ 412.3%10116691Nissan X-Trail3130.3%– 4.0%843,8010.4%+ 21.7%768192Volvo XC603050.3%+ 7.4%962,8630.3%– 7.6%927893Hyundai Bayon2950.3%– 20.1%873,6050.4%– 13.7%816894Mercedes C Class2880.3%+ 41.9%1282,5780.3%– 3.3%998895Fiat Grande Panda2830.3%new918970.1%new162 –96BMW 2-Series2790.3%+ 28.6%1061,8930.2%– 14.2%1159797Hyundai i102730.3%– 58.3%1154,5460.5%+ 3.0%726698Skoda Elroq2670.3%new1001,3760.1%new134 –99Lexus NX2660.3%– 15.6%932,8360.3%+ 0.9%9382100Skoda Scala2620.3%+ 52.3%1132,2050.2%– 7.9%10394101Mercedes CLE2560.3%+ 113.3%1411,4260.1%+ 28.9%131130102VW Tayron2490.3%new1211,0830.1%new147 –103Hyundai Inster2310.2%new971,9240.2%new114275104BYD Atto 32300.2%+ 51.3%892,0320.2%+ 127.3%108136105Jaecoo 52240.2%new1253520.0%new209 –106Peugeot 50082230.2%– 29.0%1182,7350.3%– 13.8%9680107BYD Seal2210.2%+ 76.8%761,7890.2%+ 147.8%117144108Mercedes GLE2170.2%– 3.1%1091,9950.2%+ 11.8%110103109BMW ix12060.2%+ 19.8%1161,6560.2%+ 21.9%121112110VW ID.42050.2%+ 469.4%1598640.1%+ 81.1%165186111Peugeot 3082030.2%– 56.7%1073,3760.4%– 40.9%8658112Dacia Spring2020.2%+ 1736.4%1301,7200.2%+ 249.6%119168113Mercedes E Class2010.2%+ 58.3%1541,3810.1%+ 24.3%133129114Opel Mokka2000.2%+ 11.7%803,6010.4%+ 8.5%8277115Renault Espace1960.2%+ 27.3%1052,0470.2%+ 24.0%107107116VW ID.31940.2%+ 266.0%1347970.1%+ 83.2%168188117Lexus UX1820.2%+ 46.8%1201,4270.1%– 3.8%130114118Mercedes GLB1740.2%– 19.1%1121,6250.2%– 15.8%123101119Leapmotor C101670.2%+ 4075.0%1199220.1%+ 22950.0%159283120Suzuki Vitara1660.2%– 26.9%1031,9560.2%+ 10.9%11199121BMW 3-Series1600.2%– 25.2%1221,9320.2%– 32.6%11383122Citroen C5 Aircross1600.2%– 38.0%1521,7380.2%– 42.0%11879123BYD Sealion 71570.2%new1331,0090.1%new152301124Hyundai i301540.2%– 60.3%1102,8280.3%– 47.4%9459125DS 7 Crossback1470.2%– 8.1%1641,1030.1%– 51.9%14596126Mercedes EQA1470.2%+ 4.3%1471,6510.2%+ 37.5%122118127BMW 4-Series1450.1%+ 11.5%1361,4390.2%– 19.9%128104128Mazda CX-601430.1%+ 45.9%951,4960.2%+ 67.0%126131129Volvo EX301420.1%+ 18.3%1611,1520.1%– 44.1%13998130Toyota Aygo X1400.1%– 47.6%793,1780.3%– 13.2%8775131Audi Q41380.1%+ 100.0%1319400.1%+ 40.5%156157132Hyundai Ioniq51370.1%+ 315.2%1387090.1%+ 123.0%177204133Kia Picanto1370.1%– 57.8%742,6090.3%– 2.8%9785134BMW X41340.1%– 40.2%1111,6730.2%– 7.4%120100135Leapmotor T031330.1%+ 13200.0%1291,1320.1%+ 113100.0%143232136Kia Ceed1290.1%– 69.1%1174,6020.5%– 11.1%7162137BMW ix21280.1%+ 6.7%1261,2100.1%+ 57.8%136145138Audi A61240.1%+ 72.2%1747370.1%+ 42.3%175175139Mazda61240.1%n/a1812210.0%+ 590.6%237299140Mercedes V Class1230.1%– 25.9%1652,0820.2%+ 23.4%106105141Mitsubishi ASX1220.1%+ 0.0%1451,1510.1%– 40.8%140102142Suzuki Swift1210.1%– 18.8%1241,2970.1%+ 36.7%135133143BMW X51200.1%– 18.9%1371,1790.1%– 9.9%138122144Audi Q81180.1%+ 3.5%1401,1390.1%+ 49.1%142146145Mitsubishi Colt1120.1%+ 124.0%1833,0740.3%+ 167.1%89126146Honda Jazz1110.1%+ 48.0%1357570.1%+ 118.8%173191147KGM Rexton1090.1%+ 275.9%1975040.1%+ 74.4%192209148BMW 5-Series1040.1%+ 35.1%1639610.1%+ 39.9%153150149Honda Civic970.1%– 13.4%1279600.1%+ 21.1%154148150Mercedes EQE920.1%+ 8.2%1727810.1%+ 18.3%170151151Toyota bZ4X920.1%+ 268.0%1012,5850.3%+ 685.7%98211152KGM Korando/C300900.1%+ 11.1%2029130.1%– 9.5%161132153Lynk & Co 08900.1%new1712050.0%new241 –154Citroen C4 X890.1%– 6.3%1511,5670.2%– 4.7%124111155Hyundai Santa Fe870.1%+ 17.6%1686900.1%+ 9.2%178162156KGM Tivoli/Grand850.1%– 38.4%1441,5650.2%– 35.0%12590157Mazda2850.1%– 30.9%1231,3990.1%– 9.4%132106158Honda ZR-V820.1%+ 70.8%1696180.1%+ 12.6%183174159Suzuki S-Cross820.1%+ 18.8%1391,0430.1%– 6.2%150128160Porsche Cayenne810.1%– 32.5%1581,0200.1%– 1.6%151138161VW Passat810.1%+ 12.5%1427640.1%+ 22.0%172165162VW Touran810.1%– 31.9%1481,0820.1%+ 53.0%148147163Honda HR-V800.1%– 29.2%1329370.1%– 3.1%157139164Lynk & Co 01760.1%– 17.4%1791,0700.1%– 5.5%149134165BYD Dolphin740.1%– 53.5%1851,4280.2%+ 109.1%129141166Porsche 911740.1%+ 48.0%1706100.1%+ 0.5%186171167Leapmotor B10720.1%newn/a920.0%new277 –168Ford Explorer710.1%– 26.8%1605450.1%+ 56.2%189181169Honda CR-V710.1%– 17.4%2386090.1%+ 40.3%187187170Mercedes B Class710.1%+ 0.0%2108960.1%– 9.8%163142171Porsche Macan710.1%– 67.0%1668110.1%– 34.4%167127172Range Rover710.1%– 7.8%1739460.1%+ 2.7%155202173Volvo XC90700.1%– 51.4%1501,1170.1%– 7.7%144124174Opel Grandland660.1%– 16.5%1677940.1%– 48.3%169119175Peugeot 408620.1%– 41.5%1921,4840.2%+ 12.1%127123176Renault 4620.1%new2271930.0%new246 –177Cupra Tavascan600.1%– 65.5%1891,1480.1%+ 102.5%141169178Land Rover Defender600.1%+ 42.9%2038790.1%+ 58.7%164164179EVO5560.1%+ 75.0%2015290.1%+ 220.6%191222180KGM Torres560.1%+ 194.7%2193050.0%– 20.2%216201181Tesla Model 3550.1%– 82.5%27,7220.8%+ 2.9%4329182Kia Sorento540.1%+ 58.8%1629200.1%– 9.4%160137183Subaru Crosstrek530.1%– 30.3%2084370.0%– 3.7%198180184Ford Capri520.1%new1144640.0%new196245185BMW X6500.1%– 49.0%1566460.1%– 8.6%181153186Fiat Panda490.1%– 69.8%1492,0030.2%– 14.4%10984187Hyundai Staria490.1%+ 250.0%2143750.0%+ 234.8%206235188Lancia Ypsilon490.1%+ 276.9%2324980.1%+ 3457.1%193282189MG 4470.0%– 77.6%1767520.1%– 66.3%17495190Mitsubishi Outlander470.0%n/a1913310.0%n/a215 –191Mercedes G Class460.0%– 11.5%2222510.0%+ 16.7%231221192Mercedes T Class460.0%– 11.5%2177770.1%+ 56.0%171182193BMW i4440.0%+ 0.0%2244950.1%– 10.8%194173194MG S5440.0%new1902250.0%new236 –195Jeep Renegade420.0%– 10.6%1946570.1%– 63.9%180110196Mercedes EQB420.0%– 38.2%2165660.1%+ 23.6%188177197Lynk & Co 02400.0%new1872050.0%new240 –198Mazda MX-5400.0%+ 8.1%2043550.0%– 1.4%208197199Skoda Enyaq400.0%+ 73.9%1883700.0%– 29.4%207170200Xpeng G6400.0%+ 471.4%1534060.0%+ 3283.3%201286201Lexus RX390.0%+ 34.5%1802750.0%+ 0.4%224214202Lexus ES380.0%+ 2.7%1863760.0%+ 12.6%205205203Alpine A290370.0%+ 3600.0%2292920.0%+ 29100.0%220367204Audi Q7370.0%– 47.1%1935300.1%+ 58.7%190194205BMW X7370.0%+ 37.0%2063020.0%+ 14.0%218215206Kia EV4370.0%new1461290.0%new265 –207Audi Q6360.0%+ 80.0%2213320.0%+ 257.0%214248208BYD Seal 6360.0%new1571460.0%new258 –209Cupra Born360.0%– 77.8%1966160.1%– 14.9%184149210Jeep Compass360.0%– 35.7%1751,0950.1%– 30.9%146116211Kia EV6360.0%– 37.9%2433840.0%– 41.7%204160212SWM G03F350.0%+ 218.2%2512600.0%+ 642.9%228278213Renault Scenic340.0%– 17.1%2287110.1%+ 156.7%176216214Skoda Superb340.0%– 5.6%2114140.0%+ 16.6%199196215VW Touareg340.0%– 15.0%2232390.0%– 27.4%232203216BMW XM320.0%+ 146.2%2092060.0%+ 71.7%239240217Opel Astra320.0%– 81.6%1959330.1%– 48.8%158108218Nissan Ariya310.0%+ 3.3%1774080.0%+ 127.9%200226219Omoda E5310.0%– 31.1%1556270.1%+ 620.7%182231220Volvo EX40310.0%+ 210.0%2152660.0%+ 72.7%225n/a221EVO Cuatro290.0%newn/a650.0%new286 –222Range Rover Evoque290.0%– 45.3%2204040.0%– 22.9%202176223Smart #3290.0%– 32.6%2371960.0%– 37.0%245207224Toyota Corolla Cross290.0%– 23.7%1994770.1%– 46.1%195152225Polestar 4280.0%+ 27.3%2072790.0%+ 267.1%222259226Mazda CX-80270.0%– 42.6%1983950.0%+ 348.9%203234227Suzuki Swace270.0%– 62.5%2182610.0%– 59.1%227172228Toyota Land Cruiser270.0%– 92.2%1826110.1%– 33.8%185113229Volvo V60270.0%+ 125.0%2423040.0%+ 42.1%217218230KGM Torres EVX260.0%new256890.0%new278388231Subaru Forester260.0%– 53.6%2332930.0%– 14.8%219198232SWM G05260.0%+ 225.0%2441820.0%+ 810.0%250302233BMW 7-Series250.0%+ 66.7%2682020.0%– 17.6%242219234Porsche Panamera240.0%– 25.0%2262870.0%+ 54.3%221230235Smart #1240.0%– 40.0%2502360.0%– 48.4%234183236Alfa Romeo Stelvio220.0%– 72.8%1843320.0%– 56.0%213156237Maserati Grecale220.0%+ 22.2%2391890.0%– 7.4%247229238EVO3210.0%– 22.2%2541850.0%+ 50.4%249244239Ford Mustang210.0%– 43.2%2632380.0%+ 0.0%233220240Livan X3 Pro210.0%+ 110.0%2491650.0%+ 1550.0%256311241BMW IX 200.0%+ 100.0%2611710.0%+ 9.6%253239242Bestune T77190.0%new2001670.0%new255 –243Mercedes GLS190.0%+ 533.3%2401400.0%+ 47.4%262255244Subaru Legacy190.0%+ 0.0%2302530.0%– 7.0%230217245Dongfeng Box180.0%new2121960.0%new244284246Fiat 500180.0%– 92.6%2536870.1%– 91.9%17944247Range Rover Velar180.0%– 5.3%2052590.0%– 16.5%229210248BMW i5170.0%+ 183.3%2691410.0%+ 21.6%260242249EVO7170.0%+ 0.0%2621080.0%+ 28.6%270257250Jeep Wrangler170.0%– 29.2%2312610.0%+ 44.2%226225251Renault Megane170.0%– 81.9%2412770.0%– 83.5%223115252Alfa Romeo Tonale160.0%– 79.2%2454370.0%– 70.9%197121253DS 4160.0%– 84.2%2473420.0%– 53.0%211158254Mercedes S Class160.0%+ 6.7%2651750.0%– 15.5%252228255Polestar 2160.0%– 40.7%1783410.0%– 14.1%212179256Ford Mustang Mach-E150.0%– 31.8%2341410.0%– 73.8%261178257DFSK E5120.0%+ 71.4%2251810.0%+ 1031.3%251292258Honda E:NY1120.0%+ 1100.0%294590.0%+ 78.8%292298259Land Rover Discovery Sport120.0%– 25.0%2351870.0%– 1.1%248224260Xpeng G9120.0%+ 200.0%273820.0%+ 1071.4%280337261Bestune T90110.0%new259510.0%new298 –262Ford Bronco110.0%+ 57.1%255740.0%– 26.0%282260263Kia EV9110.0%– 63.3%2741000.0%– 35.1%273236264Smart #5100.0%new271580.0%new293 –265Cupra Raval90.0%n/a –190.0%+ 1800.0%334392266VW ID.590.0%+ 28.6%272560.0%– 42.3%295263267VW ID.790.0%+ 28.6%2582010.0%+ 111.6%243256268DFSK 60080.0%+ 700.0%280550.0%+ 587.5%296334269Hyundai Ioniq980.0%new322750.0%new281 –270Lexus LM80.0%– 52.9%275550.0%– 22.5%297246271Volvo EC4080.0%+ 166.7%289450.0%+ 650.0%302195272Alpine A11070.0%+ 16.7%279420.0%– 8.7%306279273Citroen C5 X70.0%– 86.0%2462300.0%– 32.9%235200274Cupra Ateca70.0%– 74.1%2931080.0%– 74.0%269189275Fiat Tipo70.0%– 96.1%2833440.0%– 21.3%210185276Livan X6 Pro70.0%new257450.0%new300 –277SWM G0170.0%– 70.8%2782110.0%+ 137.1%238247278Volvo EX9070.0%– 36.4%2971050.0%+ 854.5%272300279Bentley Continental60.0%+ 500.0%267440.0%+ 131.6%303304280Bestune B7060.0%new291150.0%new341 –281BYD Tang60.0%n/a303440.0%+ 1000.0%304348282EVO660.0%new270920.0%new276315283Mercedes EQS60.0%– 60.0%2851640.0%+ 92.9%257254284Porsche Taycan60.0%– 66.7%2771340.0%– 14.6%264238285BAIC X5550.0%new266210.0%new328 –286DS No 450.0%new –70.0%new358 –287BMW 8-Series40.0%– 20.0%292430.0%– 28.3%305269288DS 340.0%– 77.8%281920.0%– 79.6%275190289Lexus RZ40.0%+ 33.3%264870.0%+ 163.6%279295290Mercedes AMG GT40.0%– 33.3%310570.0%+ 32.6%294285291Polestar 340.0%+ 100.0%276390.0%+ 18.2%310290292Subaru Solterra40.0%+ 100.0%287450.0%+ 12.5%301289293EVO430.0%– 70.0%213600.0%– 3.2%291271294Ferrari 296 GTS30.0%+ 0.0%306280.0%+ 64.7%320319295Ineos Grenadier30.0%– 50.0%2841270.0%+ 126.8%266277296MG Cyberster30.0%+ 200.0% –290.0%+ 2800.0%319329297Porsche Boxster30.0%– 25.0%286270.0%– 78.7%322250298Volvo V9030.0%– 57.1%298350.0%– 38.6%313265299Voyah Free30.0%n/a331140.0%+ 40.0%345331300Alfa Romeo Giulia20.0%– 81.8%260610.0%– 14.1%289272301Aston Martin Vantage20.0%n/a301190.0%+ 171.4%333347302Bentley Bentayga20.0%– 33.3%316170.0%– 15.0%337318303DS No 820.0%new248260.0%new323 –304Ferrari Purosangue20.0%n/a320150.0%+ 50.0%342333305Ferrari Roma20.0%+ 0.0%321190.0%+ 26.7%335325306Xpeng P720.0%– 33.3%290200.0%+ 233.3%331350307Yudo K320.0%– 33.3% –190.0%– 66.7%336281308Aston Martin DBX10.0%– 50.0%300250.0%+ 66.7%324317309Audi A410.0%– 99.1%314730.0%– 94.3%283125310Audi A710.0%– 88.9%315330.0%– 45.9%314276311Audi A810.0%– 66.7%302400.0%– 2.4%307288312Audi e-Tron GT10.0%+ 0.0% –200.0%+ 33.3%329316313DFSK ix510.0%+ 0.0%305330.0%– 21.4%315294314DFSK Seres 310.0%+ 0.0%319630.0%+ 687.5%288339315DR 4.010.0%– 66.7%236220.0%+ 340.0%327352316Ferrari 12Cilindri10.0%new –80.0%new354 –317Ferrari SF9010.0%n/a –120.0%+ 140.0%346354318Jeep Grand Cherokee10.0%– 83.3%308360.0%– 43.8%311274319KTM X-Bow10.0%n/a10.0%n/a400 –320Lamborghini Urus10.0%– 75.0%295460.0%+ 119.0%299309321McLaren Coupe10.0%n/a –60.0%+ 500.0%364371322Mercedes SL10.0%– 75.0%324310.0%+ 0.0%317297323Peugeot 50810.0%– 98.6% –1680.0%– 77.4%254155324Porsche Cayman10.0%– 80.0%326320.0%– 66.0%316264325Rolls-Royce Cullinan10.0%n/a10.0%+ 0.0%401379
Source: ANFAC


More Stories
FixGo Expands to San Diego County with 20 New Tire-Installation Partners
LOS ANGELES, CA — July 6, 2026 — FixGo, an online tire retailer that pairs web-based purchasing with local installation,...
Ford Recalls 565,691 Bronco and Bronco Raptor SUVs Over Engine Bay Fire Risk
Ford is recalling 565,691 Bronco and Bronco Raptor SUVs in the United States because of a potential fire risk tied...
2027 Toyota Crown Gets Updated Hybrid Power and a Subtle Styling Refresh
Toyota is giving the 2027 Crown a light but meaningful update, keeping its unusual sedan-meets-crossover formula while adding a new...
Why a VIN Search Should Be Your First Step Before Buying a Used Car
Buying a used vehicle involves more than comparing prices and inspecting the exterior. A car may look well-maintained while still...
Test Drive: The Renault Twingo E-Tech
After the Renault Clio VI, we stay with the French manufacturer to now test drive the new Twingo E-Tech. The...
Our Review of the Goodwood Festival of Speed 2026
As we do most years, we attended this year’s Goodwood Festival of Speed 2026 on Sunday, 12 July. The weather...