
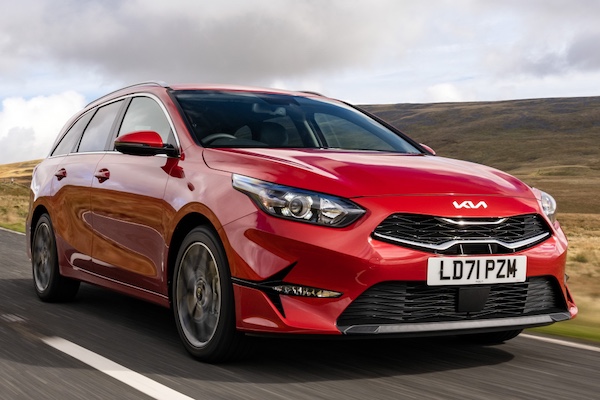
Slovakia March 2025: Skoda Karoq (+51%), Kia Ceed (+47.7%) impress in negative market
The Station Wagon variant accounts for 77% of Kia Ceed sales in March.
After falling -16.8% in January and -19.4% in February, the Slovak new car market significantly slows down its fall in March at -2.4% to 7,567 registrations. Keep in mind March 2024 was already down -12.4% on the year prior. Brand leaders Skoda (+10.8%) and Kia (+12.6%) defy the negative market with double-digit gains, the former reaching 21% share and the latter 10.3%, both above their YTD levels. Kia overtakes Toyota to reach the 2nd spot over Q1. Volkswagen (-2.7%) matches the market but Toyota (-27.8%), Hyundai (-27.8%) and Nissan (-15.3%) all collapse. Audi (+144.7%), Peugeot (+59%) and Citroen (+29.4%) all shine below.
Over in the models charts, the Skoda Octavia (-4.9%) stays in the first spot above the locally produced Kia Ceed (+47.7%), reproducing the YTD top 2 The Nissan Qashqai (-30.4%) is back up 14 spots on last month to #3 but in stark decline year-on-year. Skoda also places the Karoq (+51%) and Fabia (-38.3%) inside the Top 5. The Skoda Kodiaq (+167.6%) is up spectacularly at #7 with the Skoda Kamiq (+16.4%) and Hyundai Tucson (+14.2%) also excelling in the remainder of the Top 10. The Skoda Elroq is the best-selling newcomer at #33 and we welcome the Renault Symbioz (#120) and Dacia Bigster (#150) in the charts.
Previous month: Slovakia February 2025: Skoda places 6 models in Top 8 in freefalling market
One year ago: Slovakia March 2024: Nissan and Qashqai defy market down -12.4%
Full March 2025 Top 38 All brands and Top 254 All models below.
Slovakia March 2025 – brands:
PosBrandMar-25%/24Feb2025%/24PosFY241Skoda1,58721.0%+ 10.8%14,09420.1%– 19.9%112Kia78010.3%+ 12.6%42,0209.9%– 11.0%233Volkswagen6728.9%– 2.7%31,8909.3%– 0.6%444Toyota5997.9%– 27.8%21,9549.6%– 23.3%325Hyundai5717.5%– 27.8%51,4847.3%– 37.1%556Nissan3274.3%– 15.3%165062.5%– 19.9%12147Dacia3044.0%– 8.2%67833.8%– 31.1%668Mercedes2933.9%– 3.3%127163.5%– 16.1%879Peugeot2753.6%+ 59.0%97563.7%+ 22.3%7810Citroen2553.4%+ 29.4%76693.3%+ 49.0%91211BMW2152.8%+ 1.9%106593.2%+ 2.6%101012Audi2082.7%+ 144.7%145032.5%+ 78.4%131513Suzuki1632.2%– 39.6%154192.1%– 45.9%161114Renault1542.0%– 33.9%134722.3%– 22.9%14915Opel1431.9%+ 52.1%114632.3%+ 74.1%151616Ford1271.7%– 41.5%85212.6%+ 19.8%111317MG1161.5%+ 96.6%173461.7%+ 85.0%171718Ssangyong1011.3%+ 8.6%182731.3%+ 1.9%181819Jeep891.2%+ 169.7%252351.2%+ 201.3%192820Cupra721.0%+ 148.3%261290.6%+ 4.9%262721Honda700.9%+ 37.3%231690.8%+ 7.0%242322Volvo670.9%+ 55.8%202071.0%+ 2.0%212223Seat670.9%– 15.2%192021.0%– 24.9%222024Mazda610.8%– 46.0%221710.8%– 45.7%231925Lexus570.8%– 36.0%212181.1%– 19.9%202126Land Rover490.6%+ 44.1%241430.7%+ 20.2%252527Porsche330.4%– 5.7%30750.4%– 12.8%282928Subaru300.4%– 36.2%28570.3%– 48.2%292629Fiat240.3%– 25.0%27780.4%– 31.0%272430Mitsubishi140.2%– 68.9%32360.2%– 46.3%313031Alfa Romeo130.2%+ 44.4%29440.2%+ 33.3%303232Mini130.2%+ 30.0%33280.1%– 30.0%323133DS50.1%– 44.4%31250.1%+ 38.9%333334DongFeng40.1%new35100.0%new343535Jaguar40.1%+ 33.3%3770.0%– 46.2%363436MAN30.0%n/a –30.0%+ 200.0%383837Voyah10.0%new3480.0%new354038Ineos10.0%+ 0.0%3640.0%– 60.0%3736
Slovakia March 2025 – models:
PosModelMar-25%/24Feb2025%/24PosFY241Skoda Octavia4075.4%– 4.9%11,0295.0%– 28.3%112Kia Ceed3504.6%+ 47.7%29104.5%+ 29.3%243Nissan Qashqai2273.0%– 30.4%173671.8%– 23.9%12184Skoda Karoq2253.0%+ 51.0%35862.9%+ 0.9%475Skoda Fabia2243.0%– 38.3%55952.9%– 45.4%326Kia Sportage1962.6%– 0.5%74992.4%– 26.5%557Skoda Kodiaq1822.4%+ 167.6%64872.4%+ 27.8%6108Hyundai i301662.2%– 55.1%94772.3%– 56.7%739Skoda Kamiq1632.2%+ 16.4%183771.9%– 38.5%11610Hyundai Tucson1532.0%+ 14.2%203441.7%– 22.2%151211Skoda Scala1512.0%+ 16.2%44512.2%– 15.9%8812Dacia Duster1471.9%– 27.9%103931.9%– 33.9%9913Citroen C31421.9%+ 22.4%113611.8%+ 43.8%132214VW T-Cross1331.8%+ 5.6%212611.3%– 5.4%211315Hyundai i201311.7%– 10.9%153151.5%– 10.5%171616Toyota Corolla1301.7%– 11.0%133881.9%– 25.2%101117Skoda Superb1291.7%+ 19.4%83491.7%– 6.7%141418Peugeot 2081061.4%+ 120.8%422331.1%+ 49.4%253019Toyota Yaris1041.4%+ 19.5%232921.4%+ 74.9%182420VW Golf951.3%– 34.5%123421.7%+ 8.6%161721VW Tiguan911.2%– 24.8%162841.4%– 17.9%201522Nissan X-Trail871.1%+ 163.6%1001160.6%+ 28.9%496523MG ZS811.1%+ 76.1%242381.2%+ 114.4%232624Jeep Avenger811.1%+ 1250.0%482031.0%+ 1253.3%289025Toyota Proace741.0%+ 8.8%192491.2%+ 74.1%223226Ford Transit/Tourneo Custom741.0%+ 131.3%282101.0%+ 311.8%266827Toyota C-HR731.0%– 12.0%352351.2%– 33.4%241928VW Taigo731.0%– 7.6%332041.0%– 21.2%272729Toyota RAV4700.9%– 29.3%142871.4%– 19.4%192030Suzuki SX4 S-Cross690.9%– 40.0%261860.9%– 50.7%302131Dacia Sandero690.9%– 12.7%301840.9%– 34.5%312332Dacia Jogger680.9%+ 70.0%311660.8%– 21.3%323333Skoda Elroq660.9%new56980.5%new56 –34Suzuki Vitara650.9%– 45.4%361450.7%– 50.2%382935Peugeot 3008640.8%+ 48.8%271981.0%+ 153.8%294536SsangYong Korando590.8%+ 7.3%391580.8%+ 18.8%343737Mercedes GLC590.8%+ 20.4%581390.7%+ 14.9%414738Kia Stonic570.8%– 27.8%461360.7%– 46.7%422839Kia Proceed 530.7%+ 15.2%731240.6%– 20.0%455540Citroen C4520.7%– 14.8%411490.7%+ 16.4%373941Toyota Yaris Cross510.7%– 58.2%371570.8%– 57.6%352542Renault Captur510.7%– 19.0%401420.7%+ 23.5%404443Audi Q8500.7%+ 525.0%55970.5%+ 79.6%578744Toyota Aygo X460.6%+ 58.6%511200.6%+ 39.5%474945Citroen Berlingo460.6%n/a571030.5%+ 5050.0%519146Kia Xceed450.6%– 31.8%531260.6%– 52.5%443147Opel Corsa440.6%+ 91.3%221420.7%+ 82.1%395148Mercedes G Class430.6%+ 72.0%62950.5%+ 35.7%598549Hyundai Kona420.6%– 30.0%441200.6%– 30.6%463450VW Touareg410.5%+ 32.3%96900.4%– 15.9%605651Audi Q3410.5%+ 41.4%66950.5%+ 58.3%586052VW Multivan390.5%+ 77.3%251660.8%+ 176.7%337153VW Touran390.5%+ 178.6%501290.6%+ 230.8%434654Opel Grandland X370.5%+ 825.0%381180.6%+ 1080.0%4814755VW Caddy340.4%+ 9.7%65750.4%– 3.8%706156Toyota Corolla Cross340.4%+ 13.3%341550.8%– 31.7%364157Honda CR-V340.4%+ 88.9%67780.4%+ 18.2%678058Mercedes GLE320.4%– 27.3%74820.4%– 46.8%654859BMW X1320.4%+ 100.0%84820.4%+ 67.3%648660Audi Q7320.4%+ 3100.0%155620.3%+ 376.9%7810261Peugeot 2008310.4%+ 106.7%491010.5%– 9.0%523562BMW 5 Series310.4%+ 138.5%70750.4%+ 63.0%697863BMW X5280.4%– 22.2%69760.4%– 10.6%686664Kia Sorento280.4%+ 7.7%47980.5%+ 30.7%545865Suzuki Swift270.4%+ 68.8%78720.4%+ 56.5%719566VW Tayron270.4%new116390.2%new111 –67VW Passat260.3%+ 73.3%68990.5%+ 209.4%538868Skoda Enyaq250.3%+ 0.0%148380.2%– 20.8%11613569Hyundai i10250.3%+ 31.6%63690.3%+ 15.0%747970SsangYong Torres250.3%+ 78.6%89560.3%+ 30.2%8811671Seat Leon250.3%+ 108.3%60870.4%+ 29.9%616372MG HS250.3%+ 212.5%81610.3%– 1.6%826773Audi A3240.3%+ 200.0%77520.3%+ 33.3%9011074VW T-Roc230.3%– 36.1%97670.3%– 56.8%754275Peugeot 308230.3%– 17.9%88700.3%– 47.4%735476Seat Arona230.3%– 14.8%111470.2%– 43.4%957077Mercedes V Class230.3%+ 187.5%82600.3%+ 36.4%866278Lexus NX220.3%– 43.6%59980.5%– 12.5%555279Volvo XC60220.3%+ 100.0%64650.3%+ 10.2%767780Renault Rafale220.3%new85620.3%new8016681BMW X3210.3%– 4.5%52810.4%+ 14.1%669382Ford Kuga200.3%– 54.5%541080.5%– 10.7%503683Mercedes GLS200.3%– 45.9%80620.3%– 48.8%796984Peugeot 508200.3%– 9.1%142460.2%– 38.7%975985Honda HR-V200.3%+ 11.1%72510.3%+ 8.5%9110586Cupra Formentor200.3%+ 53.8%109450.2%– 29.7%988987Hyundai Santa Fe200.3%+ 233.3%101490.2%– 9.3%9310388Volvo XC40190.3%+ 46.2%112430.2%+ 2.4%1039889Cupra Born190.3%+ 533.3% –190.1%+ 533.3%16128890Renault Austral180.2%– 58.1%113410.2%– 56.4%1067591Seat Ateca 180.2%– 30.8%71610.3%– 11.6%837392BMW 3 Series180.2%+ 50.0%61610.3%+ 110.3%8111493Audi A6180.2%+ 100.0%90400.2%+ 73.9%10711994VW ID.7180.2%+ 500.0%93440.2%+ 131.6%10214295Opel Vivaro180.2%+ 1700.0%162300.1%+ 900.0%13222196Kia EV6170.2%+ 6.3%123330.2%– 8.3%12412197Porsche Cayenne170.2%+ 21.4%159310.2%– 6.1%12913898Cupra Leon170.2%+ 88.9%174260.1%– 42.2%13713199Peugeot Traveller170.2%n/a94410.2%n/a105185100Hyundai Bayon160.2%– 60.0%98600.3%– 49.2%8550101Mercedes E Class160.2%– 23.8%157350.2%– 5.4%118117102Land Rover Defender160.2%+ 77.8%108440.2%+ 25.7%100100103Subaru Forester160.2%+ 128.6%124280.1%+ 75.0%136195104Renault Clio150.2%– 55.9%29850.4%+ 0.0%6253105Renault Arkana150.2%– 50.0%121380.2%– 53.1%115101106Mazda CX-30150.2%– 40.0%103470.2%– 27.7%9476107Skoda Enyaq Coupe150.2%– 28.6%32840.4%+ 58.5%63128108Volvo XC90150.2%+ 275.0%106610.3%+ 24.5%8483109Opel Combo150.2%+ 1400.0%128380.2%+ 1166.7%114168110Cupra Terramar150.2%new83380.2%new113231111Range Rover Sport140.2%– 6.7%117370.2%– 9.8%117136112Mercedes GLA140.2%+ 0.0%129350.2%– 2.8%119111113Mazda CX-80140.2%new92420.2%new104222114Opel Astra130.2%– 38.1%99450.2%– 6.3%9999115Mazda CX-60130.2%– 27.8%154220.1%– 69.4%15182116BMW 4 Series130.2%+ 30.0%91500.2%– 3.8%9297117Mercedes C Class130.2%+ 62.5%135260.1%+ 23.8%141170118Audi Q5130.2%+ 85.7%75620.3%+ 93.8%7792119VW ID.3130.2%+ 550.0%126240.1%+ 26.3%145167120Renault Symbioz130.2%new –130.1%new186 –121Subaru Outback120.2%– 62.5%132250.1%– 67.9%14474122BMW X7120.2%– 42.9%114340.2%– 59.5%12181123Mercedes Citan120.2%+ 0.0%202180.1%– 40.0%163154124Dacia Spring120.2%+ 50.0%118320.2%– 36.0%125172125Ssangyong Rexton120.2%+ 71.4%86390.2%+ 21.9%110122126Audi A5120.2%+ 300.0%105380.2%+ 280.0%112171127Kia EV3120.2%new133330.2%new123284128Lexus ES110.1%+ 10.0%158260.1%– 23.5%138139129Fiat Doblo110.1%n/a107400.2%n/a108234130Opel Mokka100.1%– 9.1%127460.2%+ 43.8%96108131Mercedes GLB100.1%+ 11.1%137350.2%– 2.8%120115132Kia Picanto100.1%+ 66.7%160230.1%+ 15.0%150140133BMW IX100.1%+ 233.3%228160.1%+ 60.0%166198134Peugeot Partner100.1%n/a79530.3%n/a89107135Fiat 600100.1%n/a152210.1%n/a153175136Hyundai Inster100.1%new180150.1%new173 –137Ford Focus Combi90.1%– 55.0%141210.1%– 43.2%154127138Mazda390.1%– 35.7%131260.1%– 13.3%140134139BMW X690.1%– 25.0%138250.1%– 43.2%142141140Mini 90.1%+ 200.0%170220.1%– 8.3%152163141Lexus LBX90.1%new110340.2%new122156142Lexus RX80.1%– 68.0%156320.2%– 56.2%12684143Nissan Juke80.1%– 61.9%165150.1%– 62.5%176137144BMW X280.1%+ 14.3%198170.1%+ 88.9%164165145VW ID.480.1%+ 60.0%115240.1%+ 33.3%146132146Toyota Land Cruiser80.1%+ 166.7%104400.2%+ 81.8%109109147Honda Jazz80.1%+ 700.0%175160.1%+ 77.8%167219148Citroen Spacetourer80.1%n/a144280.1%n/a135155149VW ID.580.1%new231120.1%+ 20.0%193190150Dacia Bigster80.1%new –80.0%new212 –151Ford Puma70.1%– 90.3%43700.3%– 45.3%7257152Renault Trafic70.1%– 80.0%183290.1%– 80.5%13438153BMW 7 Series70.1%– 50.0%184200.1%– 28.6%156153154Citroen C5 Aircross70.1%– 46.2%146230.1%– 47.7%148130155Mitsubishi ASX70.1%– 41.7%164150.1%– 16.7%175174156Lexus UX70.1%– 36.4%145260.1%– 38.1%139149157Mercedes S Class70.1%– 36.4%205130.1%– 51.9%185148158Mercedes A Class70.1%– 30.0%161190.1%– 9.5%160146159Kia Niro70.1%+ 0.0%130250.1%– 37.5%143113160Porsche 91170.1%+ 0.0%166140.1%– 30.0%182196161Toyota BZ4X70.1%+ 75.0%186160.1%+ 23.1%172210162Alfa Romeo Junior70.1%new87300.1%new130280163MG 370.1%new122300.1%new131179164Audi A170.1%n/a179120.1%n/a187202165Opel Crossland X60.1%– 81.8%76440.2%– 52.2%10140166Mercedes CLA60.1%– 50.0%147200.1%– 20.0%157159167Renault Megane60.1%– 40.0%143300.1%+ 0.0%133120168Range Rover60.1%+ 50.0%171170.1%– 15.0%165161169Mercedes EQA60.1%+ 50.0% –110.1%+ 0.0%197218170Mercedes Vito60.1%+ 200.0%192120.1%+ 100.0%190177171Mazda CX-550.1%– 86.5%163160.1%– 83.5%16872172Jeep Compass50.1%– 79.2%22990.0%– 83.0%204133173Ssangyong Tivoli50.1%– 70.6%134200.1%– 66.7%158104174Ford Courier50.1%– 66.7%102310.2%+ 82.4%12894175Honda ZR-V50.1%– 50.0%223190.1%– 29.6%159123176Kia EV950.1%– 50.0%187130.1%– 56.7%184178177DS7 Crossback50.1%– 28.6%120230.1%+ 64.3%149194178Porsche Macan50.1%– 28.6%185160.1%– 33.3%171160179Ford Mustang Mach-E50.1%– 16.7%21190.0%– 10.0%203233180Mitsubishi Space Star50.1%+ 0.0%151160.1%+ 0.0%170182181Audi Q250.1%+ 66.7%206110.1%+ 120.0%195183182Range Rover Evoque50.1%+ 150.0%167120.1%+ 71.4%191204183Land Rover Discovery Sport50.1%+ 400.0%188120.1%+ 200.0%189224184Peugeot 500840.1%– 76.5%153140.1%– 78.1%181118185BMW 2 Series40.1%– 76.5%204100.0%– 66.7%200151186Hyundai Staria40.1%– 50.0%23470.0%– 76.7%217203187Mercedes AMG GT40.1%– 50.0%24350.0%– 72.2%229208188BMW i440.1%– 42.9%119230.1%+ 27.8%147176189Renault Kangoo40.1%– 42.9%95210.1%– 36.4%155129190BMW X440.1%– 20.0%176120.1%– 36.8%188152191Mercedes CLE40.1%– 20.0%20980.0%– 27.3%208191192Mazda240.1%+ 0.0%140160.1%+ 6.7%169180193Mercedes EQB40.1%+ 0.0%178100.0%+ 25.0%201213194Nissan Townstar40.1%+ 0.0% –70.0%– 46.2%219211195Porsche Panamera40.1%+ 33.3%201110.1%+ 175.0%198243196BMW 1 Series40.1%n/a197180.1%+ 125.0%162184197Volvo EX9040.1%new21380.0%new210 –198Mercedes EQE30.0%– 75.0% –30.0%– 87.5%254169199VW Polo30.0%– 70.0%200110.1%– 54.2%199150200Volvo EX3030.0%– 70.0%20390.0%– 64.0%207162201BMW 2 Series Active/Gran Tourer30.0%– 57.1%136310.2%+ 47.6%127173202Mini Countryman30.0%– 57.1%24050.0%– 54.5%230200203Honda Civic30.0%– 25.0%23750.0%– 44.4%227193204Land Rover Discovery30.0%+ 50.0%17790.0%+ 0.0%205186205BMW iX330.0%+ 50.0%19470.0%– 12.5%215227206Jaguar F-Pace30.0%+ 50.0%23950.0%– 37.5%228229207Dongfeng Box S3130.0%new20790.0%new202315208Alfa Romeo Stelvio30.0%n/a23070.0%– 53.3%213201209Mercedes Sprinter30.0%n/a21070.0%– 22.2%218232210MAN TGE30.0%n/a –30.0%+ 200.0%253283211Fiat 50020.0%– 91.3%173110.1%– 86.1%19664212Ford Transit/Tourneo Connect20.0%– 80.0%45590.3%+ 110.7%87106213Ford Focus20.0%– 60.0%23840.0%– 42.9%235225214Subaru Crosstrek20.0%– 60.0%22240.0%– 33.3%239144215Hyundai Ioniq 520.0%– 50.0%172130.1%– 18.8%183187216Hyundai Ioniq 6 20.0%– 33.3%139150.1%+ 36.4%174216217Jeep Renegade20.0%– 33.3%23360.0%– 25.0%222235218BMW iX120.0%+ 0.0%19370.0%– 41.7%214215219Audi A820.0%+ 0.0% –20.0%+ 0.0%263246220Suzuki Across20.0%+ 100.0%149150.1%+ 150.0%177248221Volvo V9020.0%+ 100.0% –60.0%– 33.3%225266222Audi Q620.0%new125140.1%new178247223Renault Espace20.0%n/a22790.0%n/a206209224Alfa Romeo Giulia20.0%n/a –40.0%+ 300.0%232259225MG Cyberster20.0%new –30.0%new249316226Toyota Proace City Verso10.0%– 99.2% –10.0%– 99.4%28643227VW Arteon10.0%– 93.3%19070.0%– 85.7%220126228Mazda610.0%– 93.3%24220.0%– 94.1%257158229Alfa Romeo Tonale10.0%– 88.9%21830.0%– 82.4%242206230Fiat 500X10.0%– 85.7%23630.0%– 81.3%245189231MG 410.0%– 75.0%224140.1%+ 55.6%180188232Audi e-tron10.0%– 75.0% –10.0%– 88.9%279251233Mitsubishi Colt10.0%– 66.7% –30.0%– 40.0%250239234BMW XM10.0%– 50.0% –60.0%– 25.0%221212235Volvo V6010.0%– 50.0%23250.0%– 50.0%231242236Toyota Supra10.0%– 50.0% –10.0%– 75.0%287269237Ford Explorer10.0%+ 0.0%19170.0%– 12.5%216214238Ford Mustang10.0%+ 0.0%18150.0%+ 66.7%226197239Ineos Grenadier10.0%+ 0.0%21440.0%– 60.0%236238240Audi A710.0%+ 0.0%22130.0%+ 0.0%243260241Jeep Wrangler10.0%n/a225140.1%+ 600.0%179263242Voyah Free10.0%new16880.0%new211305243BMW i510.0%n/a –30.0%+ 50.0%244261244Ford Capri10.0%new24130.0%new246329245Volvo S9010.0%n/a –30.0%+ 50.0%252275246Renault Megane E-Tech10.0%new –20.0%new259207247Cupra Tavascan10.0%new –10.0%new280279248DFSK T5 EVO10.0%n/a –10.0%+ 0.0%281307249Jaguar F-Type10.0%n/a –10.0%– 50.0%282290250Mercedes CLS10.0%n/a –10.0%n/a283309251Mini Aceman10.0%new –10.0%new284300252Nissan Ariya10.0%n/a –10.0%– 75.0%285271253Seat Ibiza10.0%n/a –10.0%n/a288 –254Mitsubishi Outlander10.0%n/a –10.0%n/a289 –
Source: ZAP


More Stories
Ford F-150 Overland Capacity: What Actually Matters When You’re Packing for the Backcountry!
Overland Builds Live and Die by How Well You Use Your Roof Ask ten F-150 owners what “overland ready” means...
How Much Does It Cost to Rent an Exotic Car in Houston?
Exotic rentals in Houston run anywhere from $800 to $2,500 per day, and the spread comes down to what’s in...
In-Car Cameras Are Now Required in Europe as Driver Monitoring Debate Heads Toward the U.S.
New vehicles sold in the European Union are now required to include advanced driver-distraction warning technology, and for many models...
2026 Cadillac CT5 Pricing: The Last Luxury Sedan From a Legacy American Automaker
Edmunds said it plainly in their 2026 review: the CT5 is the last luxury sedan from a legacy American automaker,...
What Is BMW SmartView?
Your phone already does most of the heavy lifting when it comes to media, navigation, and apps. BMW SmartView is...
2026 Mazda CX-70 Invoice Pricing: Three Powertrains, a $3,000 Rebate, and 0.9% Financing
If you are shopping for a 2026 Mazda CX-70 and want to know what dealers are actually paying, what a...