Indonesia October 2024: Toyota Kijang Innova leads, BYD M6 cracks Top 10
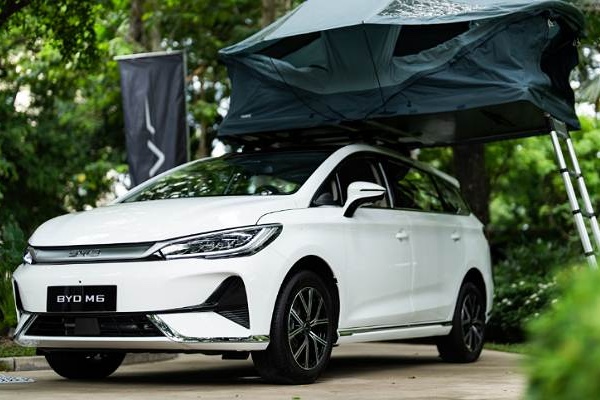
The BYD M6 is inside the Indonesian Top 10 in October.
Indonesian wholesales slow down their fall in October at -3.8% year-on-year to 77,191 units, leading to a year-to-date tally off -15% to 710,406. As for retail sales, they are down -7.6% to 73,443 for the month and – 11.5% year-to-date to 730,637.
In the wholesales brands charts, Toyota (-1.5%) and Daihatsu (stable) continue to dominate with 35% and 18.3% share respectively. Honda (-27.7%) is in complete freefall year-on-year but still manages 11.2% share which is above its YTD level of 11%. Suzuki (-8.3%) and Mitsubishi (-7.6%) also drop faster than the market to round out the Top 4. Chinese newcomer BYD is up two spots on September to return to its record ranking of #6, also hit last August. Mitsubishi Fuso (+11.9%) and Wuling (+1.4%) defy the negative market with Chery (+95.3%), BMW (+8.8%) and MG (+305.4%) shining below.
Retail-wise, Toyota (-11.4%), Daihatsu (-10.5%) and Honda (-16.3%) all underperform but still account for 62.6% of the market combined vs. 64.2% year-to-date. Mitsubishi (-1.9%) resists at #4, BYD is up four spots on last month to #6 and both Mitsubishi Fuso (+13.6%) and Wuling (+5.2%) stand out. Chery shoots up 120.8% and Mercedes is up 23.3% at #13.
Looking at the models ranking, the Toyota Kijang Innova (-20.6%) and Avanza (+6.3%) hold onto the top two spots but the Daihatsu Gran Max Pikap (+128.7%) surges ahead to #3 and 7% share vs. 5.7% so far this year. The Honda Brio (-28.2%) and Daihatsu Sigra (-19.4%) both crater while the Toyota Calya (-1.7%) contains its fall. Excellent month for the Toyota Rush (+16.2%) repeating at #7 ahead of a falling Suzuki Carry Pikap (-22.9%). The BYD M6 is up 13 ranks on September to break into the Top 10 for the first time at #9.
Previous month: Indonesia September 2024: Toyota Kijang Innova and Avanza top sinking market
One year ago: Indonesia October 2023: Toyota Kijang Innova #1 again, Honda Brio now #1 YTD
Full October 2024 Top 33 All brands (retail and wholesales) and Top 165 All models (wholesales) below.
Indonesia October 2024 – brands (wholesales):
PosBrandOct-24%/23Sep2024%/23PosFY231Toyota27,03035.0%– 1.5%1235,40133.1%– 14.0%112Daihatsu14,09618.3%– 0.0%2139,94519.7%– 13.4%223Honda8,63311.2%– 27.7%377,95311.0%– 35.0%334Suzuki5,4917.1%– 8.3%554,4827.7%– 18.1%545Mitsubishi5,4867.1%– 7.6%459,6938.4%– 6.8%456BYD2,4883.2%new811,0241.6%new11 –7Mitsubishi Fuso2,4143.1%+ 11.9%622,4943.2%– 15.0%678Hino2,3203.0%– 5.3%718,9942.7%– 17.6%899Wuling2,2032.9%+ 1.4%916,1172.3%– 3.2%101010Isuzu2,1062.7%– 16.8%1022,1823.1%– 16.8%7811Hyundai1,7112.2%– 43.6%1118,8752.7%– 36.1%9612Chery6990.9%+ 95.3%126,8891.0%+ 91.2%121413BMW 5060.7%+ 8.8%133,5910.5%– 0.5%151314Mazda3000.4%– 23.1%143,7350.5%– 18.5%131215Mercedes2920.4%– 30.6%163,1250.4%– 28.5%161116MG2270.3%+ 305.4%153,6110.5%+ 264.4%142017UD Trucks1830.2%+ 15.8%191,6620.2%+ 5.5%181618Lexus1810.2%– 17.0%202,2290.3%+ 12.5%171519Tank1530.2%new175660.1%new26 –20Nissan1250.2%+ 33.0%181,0100.1%– 30.3%201721Citroen1160.2%n/a221,0780.2%n/a19 –22Ford720.1%n/a276770.1%n/a24n/a23FAW610.1%+ 69.4%286760.1%+ 25.4%252324BAIC600.1%new262000.0%new30 –25Dongfeng (DFSK)530.1%– 39.8%237320.1%– 34.7%231926Kia 520.1%+ 13.0%241,0100.1%– 15.5%211827Mini490.1%– 46.2%257790.1%+ 8.6%222128Subaru400.1%– 4.8%294810.1%– 4.2%282429Scania320.0%+ 14.3%303300.0%– 47.4%292230Volkswagen90.0%– 10.0%32740.0%– 67.3%322631Volvo20.0%n/a31980.0%n/a31 –32Audi10.0%– 83.3%33230.0%– 48.9%3630
Indonesia October 2024 – retail sales:
PosBrandOct-24%/23Sep2024%/23PosFY231Toyota24,82033.8%– 11.4%1242,42833.2%– 8.7%112Daihatsu13,10117.8%– 10.5%2142,94919.6%– 13.0%223Honda8,04811.0%– 16.3%383,56211.4%– 21.6%334Mitsubishi5,7337.8%– 1.9%461,1158.4%– 10.7%455Suzuki5,3307.3%– 20.8%556,2727.7%– 16.8%546BYD 2,5973.5%new108,8211.2%new11 –7Isuzu2,4483.3%– 10.9%723,3513.2%– 11.0%688Mitsubishi Fuso2,3923.3%+ 13.6%622,4153.1%– 18.8%779Hino2,1282.9%– 17.1%818,2062.5%– 19.1%10910Wuling2,0722.8%+ 5.2%919,7852.7%– 2.9%81011Hyundai1,4512.0%– 48.5%1118,8922.6%– 36.2%9612Chery7311.0%+ 120.8%126,7000.9%+ 96.0%121413Mercedes4070.6%+ 23.3%163,2860.4%– 23.6%151114BMW 3330.5%– 17.4%143,2700.4%– 3.6%161315Mazda3010.4%– 19.7%153,7270.5%– 10.3%131216MG2920.4%+ 461.5%133,7000.5%+ 292.8%142017UD Trucks2180.3%+ 29.8%181,5730.2%+ 2.9%181618Lexus1990.3%+ 0.5%172,3990.3%+ 32.7%171519Nissan1420.2%+ 39.2%191,0610.1%– 34.3%201720Tank 1300.2%new204790.1%new27 –21Citroen1150.2%n/a227000.1%n/a23 –22Ford650.1%n/a286870.1%n/a24 –23BAIC640.1%new261500.0%new30 –24Dongfeng (DFSK)630.1%– 17.1%259250.1%– 29.9%211825FAW610.1%+ 69.4%296760.1%+ 25.4%252326Kia 550.1%– 48.6%231,1300.2%– 17.9%191927Mini480.1%– 56.4%217800.1%+ 12.7%222128Subaru480.1%+ 0.0%245500.1%+ 32.9%262429Scania320.0%+ 14.3%303300.0%– 47.4%292230Volkswagen110.0%– 8.3%34880.0%– 62.1%322631Seres50.0%new32870.0%new333032Volvo20.0%n/a31980.0%n/a31 –33Audi10.0%– 80.0%35220.0%– 56.9%3729
Indonesia October 2024 – models (wholesales)
PosModelOct-24%/23Sep2024%/23PosFY231Toyota Kijang Innova5,6937.4%– 20.6%152,3977.4%+ 3.6%112Toyota Avanza5,6117.3%+ 6.3%243,3806.1%– 14.1%323Daihatsu Gran Max Pikap5,4287.0%+ 128.7%440,5215.7%+ 4.0%564Honda Brio4,3845.7%– 28.2%342,2355.9%– 19.9%445Daihatsu Sigra4,0925.3%– 19.4%548,4786.8%– 6.7%236Toyota Calya3,7564.9%– 1.7%632,5784.6%– 14.8%657Toyota Rush2,7113.5%+ 16.2%727,1723.8%– 10.9%798Suzuki Carry Pikap2,4083.1%– 22.9%924,4993.4%– 30.5%979BYD M61,8662.4%new223,0540.4%new40 –10Honda HR-V1,8412.4%– 14.7%1813,0501.8%– 42.9%131011Toyota Agya1,6402.1%– 26.8%1616,3552.3%– 14.8%101312Daihatsu Ayla1,6162.1%+ 6.3%1214,3972.0%– 29.8%121213Toyota Hilux1,5762.0%+ 17.3%1312,6231.8%– 30.6%141614Daihatsu Terios1,3571.8%– 45.9%1415,0052.1%– 21.6%111115Mitsubishi Xpander1,3281.7%– 53.5%826,7153.8%– 20.2%8816Honda WR-V1,2951.7%– 12.0%219,5841.3%– 47.3%211517Toyota Fortuner1,1121.4%+ 74.6%1010,8171.5%– 9.6%172118Toyota Veloz1,0801.4%– 22.1%1511,7721.7%– 31.8%151419Toyota Raize1,0601.4%– 11.1%1710,5061.5%– 28.9%181820Mitsubishi L-300 Pikap1,0101.3%– 0.5%209,8851.4%– 19.4%192321Suzuki XL71,0091.3%– 25.1%238,7191.2%– 26.6%242022Honda BR-V9441.2%– 5.3%199,0351.3%– 46.7%221723Mitsubishi L200 Triton8901.2%– 21.2%266,2440.9%– 18.4%262824Isuzu Traga PHR8711.1%+ 0.5%278,1881.2%– 12.2%252625Toyota Alphard8691.1%+ 433.1%374,3220.6%+ 33.4%323926Wuling Air8311.1%+ 7.1%322,9800.4%– 22.8%433427Mitsubishi Pajero Sport8251.1%– 12.0%1111,3421.6%– 0.4%162428Toyota Hiace8231.1%+ 70.4%314,5320.6%+ 35.6%313729Hyundai Stargazer6520.8%– 55.5%249,7181.4%– 27.0%201930Toyota Yaris Cross6260.8%– 3.2%344,1430.6%– 38.0%343031Mitsubishi Xforce6000.8%new255,1510.7%new294732Daihatsu Gran Max Minibus5300.7%– 24.1%396,1210.9%– 39.2%272533Daihatsu Xenia5170.7%– 64.4%298,8461.2%– 33.0%232234Wuling Alvez4820.6%– 4.9%422,0090.3%– 57.1%493235Suzuki Ertiga4240.5%– 17.2%405,1610.7%– 33.4%282736Suzuki Alpha3590.5%new383,3730.5%new39 –37Suzuki Jimny3370.4%+ 987.1%411,9770.3%+ 180.4%506438BYD Seal3330.4%new334,0640.6%new35 –39Wuling Confero S3080.4%– 37.1%451,9650.3%– 55.1%513340Hyundai Santa Fe3060.4%+ 887.1%1197370.1%– 7.2%686241Chery Tiggo 83040.4%new516030.1%new73 –42Daihatsu Rocky3010.4%– 16.2%433,5020.5%– 22.9%373543Suzuki Baleno2780.4%– 4.8%353,4340.5%+ 42.4%384444Hyundai Creta2590.3%– 59.8%364,7360.7%– 30.2%302945Daihatsu Luxio2540.3%+ 130.9%472,2940.3%– 17.9%474246Suzuki Grand Vitara2540.3%+ 185.4%461,9480.3%+ 48.7%525247Hyundai Palisade2530.3%+ 110.8%591,6260.2%– 34.7%534548Wuling Formo2430.3%+ 96.0%667580.1%– 51.6%664849Chery Omoda E52350.3%new493,9260.6%new36 –50Suzuki APV Minibus2260.3%– 16.0%442,6330.4%– 7.3%454051Suzuki S-Presso1960.3%– 26.3%502,3710.3%– 20.5%463852Toyota Voxy1950.3%– 33.9%621,6060.2%– 29.1%544653Wuling Binguo1820.2%new534,2360.6%new335654Hyundai Kona1810.2%+ 2485.7%557850.1%+ 11114.3%6517855Honda CR-V1580.2%– 68.1%482,9920.4%– 15.6%423656BYD Atto 31510.2%new282,9080.4%new44 –57MG 41460.2%+ 3550.0%582,1610.3%+ 2567.9%4813958BYD Dolphin1380.2%new609980.1%new61 –59Lexus LM1190.2%– 3.3%691,2840.2%+ 302.5%557460Nissan Serena1170.2%+ 207.9%575740.1%+ 63.1%748461Toyota Land Cruiser 3001120.1%– 22.2%651,2660.2%+ 101.9%566162Tank 5001050.1%new883780.1%new87 –63Mazda3980.1%+ 71.9%756370.1%+ 35.5%717064Mazda CX-3890.1%+ 17.1%561,0660.2%– 35.7%605065BMW 3 Series850.1%+ 23.2%787540.1%+ 45.6%676866BMW X3840.1%+ 50.0%843910.1%– 8.6%868267Chery Omoda 5810.1%– 67.2%701,2380.2%– 51.2%574368Citroen C3 Aircross SUV750.1%new716820.1%new70 –69BMW X5740.1%– 7.5%794740.1%– 13.2%787170Wuling Cloud660.1%new303,0090.4%new41 –71BMW 5 Series610.1%+ 258.8%683190.0%+ 3.6%929072Wuling Almaz590.1%– 69.3%639230.1%– 30.5%624973Mercedes E-Class580.1%+ 61.1%742500.0%– 43.9%988074Chery Tiggo 5X580.1%new548120.1%new64 –75BAIC BJ40 Plus550.1%new891350.0%new117 –76Toyota Vellfire520.1%n/a924080.1%+ 67.2%8210477MG ZS510.1%+ 264.3%528160.1%+ 159.0%638778BMW X1500.1%– 25.4%824890.1%+ 95.6%769379Tank 300480.1%new611880.0%new107 –80Mazda CX-5450.1%– 76.8%731,2090.2%– 11.2%585181Citroen C3410.1%new943960.1%new83 –82Ford Everest400.1%n/a833960.1%n/a84 –83BMW 2 Series380.0%– 32.1%1042300.0%+ 3.1%10010084Hyundai Ioniq 5350.0%– 95.1%671,1270.2%– 80.7%593185Lexus RX340.0%– 35.8%1066890.1%– 31.2%696086Dongfeng Mini Truck330.0%+ 6.5%725480.1%– 19.1%756687Wuling Cortez320.0%– 61.4%1142220.0%– 68.4%1026388Ford Ranger320.0%n/a1012810.0%n/a96 –89Toyota Corolla290.0%– 44.2%1051790.0%– 63.2%1097790BMW 4 Series270.0%+ 0.0%861260.0%– 64.3%1188991Mini Cooper240.0%– 55.6%773920.1%– 9.5%857592Mazda CX-30220.0%+ 214.3%913240.0%+ 16.5%919693Toyota bZ4X220.0%+ 633.3%103950.0%– 80.0%1328394BMW IX1220.0%new1161140.0%new125 –95Kia Seltos210.0%+ 320.0%87740.0%– 29.5%13912796Kia Sonet200.0%+ 53.8%964550.1%– 24.9%796797Mini Countryman180.0%– 45.5%1093150.0%+ 27.5%939998Toyota Corolla Cross160.0%– 77.8%99960.0%– 91.4%1315999Mercedes GLA150.0%+ 275.0%1022080.0%– 6.7%104105100BMW i5150.0%new123820.0%new136 –101Mercedes GLE140.0%– 84.4%1172670.0%– 9.5%9791102Toyota Yaris140.0%– 72.0%853610.1%– 73.5%8955103Subaru BRZ140.0%+ 0.0%118870.0%– 40.4%134116104MG Cyberster130.0%new –130.0%new179 –105Dongfeng Glory 560120.0%– 73.3%100600.0%– 41.2%151138106Mazda CX-60120.0%– 57.1%981910.0%+ 91.0%106131107Chery Tiggo 7 Pro120.0%– 47.8%1281060.0%– 73.4%12786108Hyundai Staria120.0%+ 20.0%163890.0%– 24.6%133121109MG VS HEV120.0%new953010.0%new94 –110Mercedes GLC110.0%– 76.6%972320.0%– 22.9%9988111Mercedes C-Class110.0%– 65.6%904150.1%– 38.2%8165112Lexus LBX110.0%new142300.0%new167 –113Toyota GR 86100.0%– 61.5%161550.0%– 47.1%154132114Mercedes CLA100.0%– 52.4%133500.0%– 29.6%156142115Lexus NX100.0%+ 0.0%136640.0%– 61.0%149103116Honda Civic90.0%– 89.7%816190.1%– 35.9%7258117BMW IX90.0%– 76.9%1201230.0%– 71.4%12169118BMW Z490.0%+ 50.0% –700.0%– 22.2%143140119Kia Carnival90.0%n/a1081550.0%+ 23.0%115124120Chery GT80.0%– 86.7%1411560.0%+ 160.0%114118121Toyota Camry80.0%– 46.7%762940.0%– 61.8%9579122Mazda280.0%– 20.0%115830.0%– 52.6%135109123Mercedes Sprinter80.0%– 11.1%150520.0%+ 420.0%155155124Dongfeng Gelora80.0%+ 0.0%1261240.0%– 46.1%12095125Mercedes GLS80.0%+ 60.0%122660.0%– 38.9%145134126Subaru Crosstrek80.0%+ 300.0%1321640.0%+ 6.5%111117127Mazda CX-880.0%+ 300.0%1211130.0%– 42.9%126102128Subaru Forester80.0%n/a1121210.0%+ 236.1%123157129Subaru WRX70.0%– 65.0%164590.0%– 51.6%152129130BMW X670.0%+ 0.0%160570.0%+ 78.1%153161131Nissan Terra70.0%+ 40.0%147760.0%– 34.5%138130132Mazda MX-570.0%+ 133.3%145350.0%– 40.7%164146133Mini Aceman70.0%new –70.0%new185 –134Lexus LX60.0%– 33.3%1111430.0%+ 55.4%116126135VW Tiguan60.0%+ 20.0%137630.0%– 65.9%150110136Mercedes S-Class60.0%+ 50.0%129720.0%– 55.8%142115137BMW X760.0%+ 200.0%127790.0%– 20.2%137133138BMW i460.0%+ 200.0%139290.0%– 37.0%169150139BMW X460.0%n/a149230.0%– 61.7%172148140Toyota Vios50.0%– 87.8%1511150.0%– 72.4%12476141MG 5 GT50.0%– 84.4%1072210.0%– 47.1%10381142Mercedes A-Class50.0%– 54.5%1101600.0%– 7.5%112106143Mercedes EQE50.0%– 28.6%156270.0%– 15.6%170153144BAIC X-5550.0%new93650.0%new146 –145Hyundai Ioniq 640.0%– 94.6%124430.0%– 81.9%161101146BMW 7 Series40.0%– 50.0%1311250.0%+ 26.3%119122147BMW i730.0%– 89.3%1441010.0%+ 12.2%128125148Mercedes EQB30.0%– 66.7% –30.0%– 88.5%201162149Subaru Outback30.0%– 50.0%140500.0%+ 56.3%157158150VW T-Cross30.0%– 40.0% –110.0%– 69.4%181154151Mazda630.0%+ 0.0%138300.0%– 75.4%168128152Mercedes V-Class30.0%+ 50.0%134390.0%– 9.3%163151153Mercedes CLE30.0%new157210.0%new175 –154Honda Accord20.0%– 87.5%1131740.0%– 57.1%11085155Mazda CX-920.0%– 80.0%148440.0%– 69.4%160119156Chery Tiggo 8 Pro10.0%– 96.4% –480.0%– 89.9%15873157Kia Carens10.0%– 95.2%1252260.0%– 24.7%10194158Nissan Livina10.0%– 92.9%1351570.0%– 70.0%11372159Lexus ES10.0%– 88.9% –240.0%– 85.8%171111160Daihatsu Sirion10.0%n/a801790.0%– 62.7%10878161Kia EV910.0%new –970.0%new130156162Mitsubishi L100 EV10.0%new168470.0%new159 –163Volvo XC9010.0%n/a170220.0%n/a174 –164Volvo C4010.0%n/a –190.0%n/a176 –165Audi RS410.0%new –10.0%new211 –
Source: GAIKINDO


