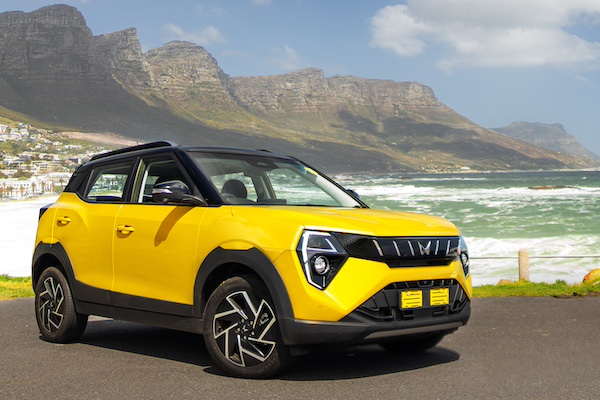
South Africa October 2024: Market up 5.5%, Mahindra XUV3X0 lands
The Mahindra XUV3X0 lands directly at #25 in South Africa.
47,924 new vehicles hit South African roads in October, a robust +5.5% year-on-year increase. The year-to-date tally is now off -4.7% to 425,806. Within this total, passenger cars soar 14.5% to 34,228, its highest since October 2019. Local association NAAMSA said “positive indicators of further potential growth include an easing in annual consumer inflation for a fourth consecutive month to 3.8% in September, the lowest level since March 2021, when the rate was 3.2%. In addition, petrol prices were at the lowest point in nearly three years, creating some breathing space for households.” Exports are freefalling however at -42.6% year-on-year in October to 23,342 and -23.1% YTD to 253,535.
Toyota (-4.4%) and the Volkswagen Group (-3.9%) remains the two most popular OEMs but go against the positive market with small declines. In contrast the next nine manufacturers all beat the market. Mahindra (+71.8%) is the most dynamic above Chery (+40.6%), Suzuki (+34.1%), GWM (+29.3%), Ford (+27.9%), Isuzu (+21.8%), Hyundai (+10.4%), Renault (+8%) and Kia (+6.4%).
The Toyota Hilux (-15.6%) holds onto the models top spot despite a hefty year-on-year loss to 5.8% share. In fact the entire Top 5 is unchanged on last month: the VW Polo Vivo (+0.7%) ranks #2 ahead of the Ford Ranger (+19.6%), Toyota Corolla Cross (+0.2%) and Isuzu D-Max (+23.4%). The VW Polo (+15.4%) is up three spots on September to #6 while the Toyota Starlet (-0.4%) rallies back up 13 ranks to #7, a ranking it also holds year-to-date. The Hyundai Grand i10 (+91.2%) and Suzuki Fronx (+167.2%) also post stellar scores, the latter breaking into the Top 10 for the first time. After the Hyundai Exter last month, we have another newcomer in the charts: the Mahindra XUV3X0 landing directly at #25.
Previous month: South Africa September 2024: Negative sales, Hyundai Exter lands
One year ago: South Africa October 2023: Volkswagen Group (+34.5%) impresses in negative market
Full October 2024 Top 39 All manufacturers and Top 50 models below.
South Africa October 2024 – manufacturers:
PosManufacturerOct-24%/23Sep2024%/23PosFY231Toyota11,89124.8%– 4.4%1105,13524.7%– 12.0%112Volkswagen Group6,34013.2%– 3.9%255,33313.0%– 2.4%223Suzuki6,00612.5%+ 34.1%349,05611.5%+ 17.6%334Ford2,9656.2%+ 27.9%427,0886.4%+ 7.0%455Hyundai2,9136.1%+ 10.4%524,9935.9%– 6.9%546Isuzu2,2514.7%+ 21.8%619,8654.7%+ 0.7%777Chery1,8313.8%+ 40.6%716,5033.9%+ 23.0%8118GWM (incl. Haval)1,7963.7%+ 29.3%915,3943.6%– 8.7%999Renault1,7343.6%+ 8.0%1013,2123.1%– 26.8%10810Kia1,5083.1%+ 6.4%1111,6202.7%– 27.9%111011Mahindra1,4213.0%+ 71.8%1210,4462.5%+ 4.9%121312Nissan1,3042.7%– 40.1%820,1534.7%– 17.7%6613BMW Group1,0072.1%– 14.6%1310,4042.4%– 9.4%131214Omoda and Jaecoo6051.3%new162,0010.5%new22 –15Mercedes4741.0%– 29.1%155,3091.2%– 23.5%141416FAW Trucks4180.9%– 0.5%174,1251.0%+ 22.9%161717Daimler Trucks4150.9%– 31.4%183,5250.8%– 21.7%171518Stellantis4020.8%– 48.3%144,8571.1%+ 25.2%151619Scania2470.5%– 14.2%192,6250.6%– 3.8%182220Mazda2390.5%– 5.9%202,5550.6%– 18.2%191821BAIC2270.5%new301,6680.4%new26 –22Honda2170.5%– 9.2%222,4130.6%– 14.7%201923Volvo Group2110.4%– 26.5%241,8570.4%– 20.3%242324UD Trucks2050.4%+ 16.5%211,9440.5%– 5.1%232425JAC1930.4%+ 46.2%261,5120.4%+ 58.3%282826Mitsubishi1920.4%– 13.1%251,7690.4%– 34.2%252127Man1920.4%– 7.7%271,6010.4%– 19.3%272528Powerstar1070.2%+ 75.4%298460.2%+ 19.0%313029Porsche1040.2%+ 11.8%311,0460.2%– 11.1%302630Jaguar Land Rover820.2%– 58.6%232,2310.5%– 19.9%212031Sinotruk810.2%+ 440.0%355260.1%+ 651.4%353632Tata700.1%– 6.7%345910.1%– 10.7%343133Subaru650.1%+ 4.8%364790.1%– 14.9%363234Iveco640.1%– 61.4%326480.2%– 25.4%332935Proton540.1%– 58.1%338120.2%+ 82.9%323336Volvo Cars470.1%– 50.0%281,3120.3%+ 20.1%292737Ferrari (Scuderia)250.1%+ 212.5% –580.0%+ 23.4%393738VECV South Africa150.0%– 28.6%371210.0%– 53.6%383539Babcock60.0%– 79.3%381600.0%– 49.5%3734
South Africa October 2024 – models:
PosModelOct-24%/23Sep2024%/23PosFY231Toyota Hilux2,7935.8%– 15.6%127,0486.4%– 14.5%112VW Polo Vivo2,2974.8%+ 0.7%220,9684.9%+ 7.3%333Ford Ranger2,2174.6%+ 19.6%321,3815.0%+ 4.6%224Toyota Corolla Cross2,1044.4%+ 0.2%417,6804.2%– 6.4%445Isuzu D-Max1,8073.8%+ 23.4%516,1233.8%– 0.9%556VW Polo1,4253.0%+ 15.4%910,3712.4%+ 2.6%10107Toyota Starlet1,3582.8%– 0.4%2011,6322.7%– 14.0%788Hyundai Grand i101,3482.8%+ 91.2%611,5152.7%+ 34.0%8119Suzuki Swift1,1792.5%– 5.5%2112,6063.0%– 9.2%6710Suzuki Fronx1,1092.3%+ 167.2%115,7631.4%n/a20n/a11Chery Tiggo 4 Pro1,0792.3%+ 26.1%810,3782.4%+ 27.0%91312Renault Kwid9341.9%+ 41.3%154,2241.0%– 21.4%252013Toyota Fortuner9051.9%+ 43.9%78,4512.0%– 4.6%121214GWM Haval Jolion8861.8%+ 65.9%137,0771.7%– 6.1%141415Nissan Magnite8541.8%+ 19.4%108,4662.0%+ 21.4%111516Suzuki Ertiga8461.8%+ 69.9%175,9881.4%n/a19n/a17Toyota Starlet Cross8051.7%new183,2890.8%new34 –18Kia Sonet7871.6%+ 43.6%195,5451.3%+ 5.5%211919Mahindra Scorpio Pik Up7091.5%+ 25.5%147,2471.7%+ 3.8%131620Toyota Vitz6761.4%– 13.2%126,0471.4%+ 108.2%182821Suzuki Baleno6721.4%+ 37.1%166,2591.5%+ 20.6%172122Toyota Urban Cruiser6291.3%+ 15.6%255,0951.2%+ 9.7%222423Toyota Hiace6121.3%– 60.4%266,3611.5%– 56.3%15624Toyota Corolla Quest6031.3%+ 24.8%27n/an/an/an/a2225Mahindra XUV3X05921.2%new –5920.1%newn/a –26Hyundai Exter5441.1%new229970.2%newn/a –27Suzuki Ciaz5271.1%n/a28n/an/an/an/an/a28Chery Tiggo 7 Pro5251.1%+ 110.0%243,8520.9%n/a28n/a29Toyota Rumion4460.9%+ 30.0%403,4890.8%+ 2.4%30n/a30VW T-Cross4370.9%– 31.8%294,1821.0%– 32.9%261831Nissan Navara4180.9%+ 18.1%234,8761.1%+ 26.4%233032Suzuki DZire4120.9%n/a30n/an/an/an/an/a33GWM Haval H63740.8%– 20.8%313,5550.8%– 18.8%292534GWM P-Series3580.7%+ 27.4%343,2100.8%– 18.7%n/an/a35VW Polo Sedan3570.7%– 43.2%383,4370.8%n/a31n/a36Omoda C53560.7%new35n/an/anewn/an/a37Renault Triber3430.7%+ 26.6%433,3220.8%– 23.5%322338Renault Kiger3400.7%– 37.6%334,3251.0%– 34.3%241739Hyundai i203280.7%– 48.3%394,0250.9%– 2.0%272640VW Amarok2980.6%– 15.3%363,3050.8%n/a33n/a41Ford Territory2970.6%new49n/an/anewn/an/a42Ford Everest2910.6%+ 16.4%n/a2,3760.6%n/an/an/a43Suzuki S-Presso2770.6%– 48.3%373,2150.8%– 25.5%352944VW Tiguan2580.5%+ 31.0%44n/an/an/an/an/a45Kia Pegas2550.5%n/a45n/an/an/an/an/a46Audi Q32500.5%n/an/an/an/an/a66n/a47Suzuki Jimny2390.5%n/a423,0660.7%n/an/an/a48Hyundai Venue2270.5%– 27.0%32n/an/an/an/a2749Suzuki Celerio2100.4%– 23.9%n/an/an/an/an/an/a50Kia Seltos2000.4%n/an/an/an/an/an/an/a
Source: NAAMSA


