New Zealand October 2024: Toyota RAV4 repeats at #1 with 10.8% share, 81% rentals
The Toyota RAV4 is the best-selling vehicle in New Zealand in October.
New vehicle sales in New Zealand drop -2.7% year-on-year in October to 12,572, leading to a year-to-date volume off -14.7% to 106,384. Passenger cars sink -39.4% to 1,508 units whereas SUVs climb 6% to 7,986 and light commercials gain 7.9% to 2,353. Toyota (-9.1%) recedes faster than the market but still manages a high 25.6% share vs. 22.3% so far this year. Ford (+7.4%), Mitsubishi (+31.3%), Kia (+15.4%) and Mazda (+25%) all defy the negative market with sturdy year-on-year lifts. Honda (+17.3%) is up four spots on September to #9 with Nissan (+4.7%) also overperforming in the remainder of the Top 10. MG (-47.1%) collapses while Subaru (+71.7%), Skoda (+48.5%) and Mercedes (+27.8%) impress.
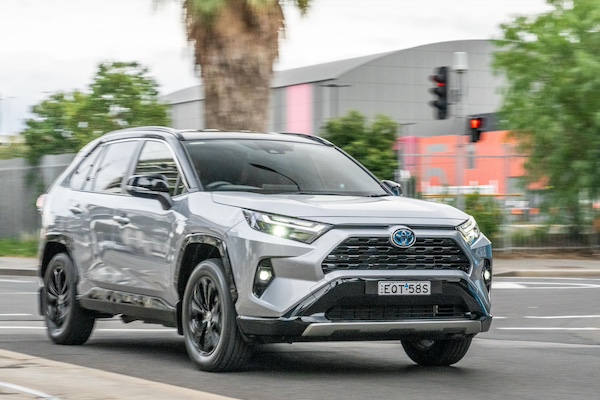
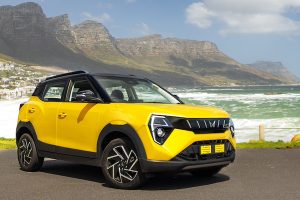
Model-wise, the Toyota RAV4 (+22.8%) repeats at #1 and lodges a second consecutive month above 10% share at 10.8%. However keep in mind no less than 81% of the RAV4’s October volume went to rental car companies. The Ford Ranger (-7.8%) and Toyota Hilux (-4%) follow while the Kia Seltos (+126.7%) surges ahead to rank #4 for the third time in the past four months. The Mitsubishi ASX stays at #5 with a 61% rental sales ratio, distancing the Mitsubishi Outlander (-18.9%) and Kia Sportage (+73.8%). The Suzuki Swift (+1.5%) is the best-selling passenger car at #12.
Previous month: New Zealand September 2024: Rentals push Toyota up to 25.5% share
One year ago: New Zealand October 2023: Rentals push Toyota up to highest share in 4 years, MG 4 up to #7
Full October 2024 Top 69 All brands and Top 20 models below.
New Zealand October 2024 – brands:
PosBrandOct-24%/23Sep2024%/23PosFY231Toyota3,22125.6%– 9.1%123,77322.3%– 11.6%112Ford 1,49711.9%+ 7.4%214,39013.5%+ 6.5%223Mitsubishi1,42511.3%+ 31.3%311,96811.2%+ 5.7%334Kia1,29810.3%+ 15.4%47,7617.3%– 15.7%445Mazda4903.9%+ 25.0%83,2743.1%– 10.1%8106Suzuki4013.2%– 2.4%64,5194.2%– 24.6%567Nissan3803.0%+ 4.7%53,9193.7%+ 2.4%698Hyundai3632.9%– 30.2%73,5103.3%– 46.1%759Honda3182.5%+ 17.3%132,5022.4%– 13.7%121310MG3132.5%– 47.1%92,5252.4%– 45.3%11711Volkswagen3032.4%– 2.9%102,8222.7%– 17.1%91112Mercedes2942.3%+ 27.8%122,0241.9%– 4.9%141413GWM2281.8%+ 14.6%112,5652.4%+ 341.5%102514Isuzu1811.4%+ 14.6%152,2532.1%+ 5.2%131515Subaru1581.3%+ 71.7%161,5681.5%– 11.7%151616Skoda1471.2%+ 48.5%171,0080.9%– 30.6%191817Lexus1231.0%+ 16.0%221,0651.0%– 1.4%172118BMW1120.9%– 13.8%141,2501.2%– 16.5%161919Audi1030.8%+ 25.6%209470.9%– 20.2%202020BYD1030.8%– 71.3%237190.7%– 72.8%231221Mini1010.8%– 7.3%217150.7%– 11.8%242722Iveco940.7%+ 70.9%313810.4%– 20.0%313123Hino670.5%+ 4.7%295070.5%– 23.3%282824Fiat640.5%+ 3.2%325290.5%+ 27.8%272925Scania620.5%+ 0.0%275620.5%+ 0.9%263026Jaecoo610.5%new421590.1%new46 –27Tesla570.5%– 60.4%181,0161.0%– 73.1%18828Omoda500.4%new343500.3%new34 –29LDV450.4%– 27.4%246300.6%– 34.0%252430Peugeot450.4%– 53.6%304970.5%– 43.5%292631Volvo420.3%+ 27.3%353560.3%– 32.7%333232Cupra350.3%– 60.2%253050.3%– 21.6%373733Land Rover320.3%– 60.0%199120.9%– 16.9%212334Fuso320.3%– 70.9%267680.7%– 27.8%222235Polestar290.2%– 53.2%361460.1%– 63.5%483336KGM/SSangyong270.2%+ 440.0%383700.3%– 11.9%323537Mahindra210.2%+ 5.0%483460.3%+ 21.4%354238Volvo Trucks210.2%– 25.0%333380.3%+ 22.9%364139Porsche200.2%– 71.8%284350.4%– 0.7%303640Foton200.2%+ 53.8%411530.1%– 3.8%474941Kenworth180.1%– 21.7%402350.2%+ 39.1%394642DAF170.1%+ 41.7%432370.2%+ 14.5%384443Renault160.1%– 30.4%442220.2%– 26.5%413944Chevrolet150.1%– 46.4%392270.2%+ 12.4%404545Jeep150.1%– 69.4%471960.2%– 46.9%433446UD Trucks120.1%– 55.6%451730.2%– 37.1%454047Ram110.1%– 15.4%462060.2%– 12.3%424348Jaguar100.1%+ 25.0%371850.2%+ 19.4%444849Opel80.1%– 81.4%49660.1%– 77.1%493850Lamborghini80.1%+ 700.0%58360.0%+ 56.5%566351Ineos70.1%+ 40.0%53530.0%– 8.6%535252Yutong70.1%n/a64180.0%n/a66 –53McLaren40.0%n/a65130.0%+ 160.0%687354Alfa Romeo30.0%+ 200.0%56620.1%+ 14.8%505155Ferrari30.0%+ 200.0%55330.0%– 15.4%586056Yamaha30.0%– 25.0% –180.0%– 21.7%656257JAC30.0%new –100.0%new69 –58Citroen20.0%– 85.7%57470.0%– 70.6%554759Maserati20.0%– 33.3%59300.0%– 44.4%605360Can-Am20.0%– 66.7%52230.0%– 36.1%635961CRRC10.0%n/a –540.1%+ 28.6%525862MAN10.0%– 85.7%50480.0%– 63.4%545063Sinotruk10.0%+ 0.0%54350.0%+ 118.8%576564Bentley10.0%+ 0.0% –230.0%– 48.9%625565International10.0%– 75.0%62200.0%– 4.8%646466Rolls-Royce10.0%+ 0.0% –80.0%– 33.3%706767Zhongtong10.0%n/a6670.0%n/a73 –68FAW10.0%new –10.0%new87 –69Chrysler10.0%n/a –10.0%n/a90 –
New Zealand October 2024 – models:
PosModelOct-24%/23Sep2024%/23PosFY231Toyota RAV41,35410.8%+ 22.8%17,6637.2%+ 11.1%222Ford Ranger 7325.8%– 7.8%29,4598.9%+ 9.6%113Toyota Hilux6525.2%– 4.0%36,3205.9%– 16.1%334Kia Seltos5444.3%+ 126.7%62,9182.7%+ 79.1%7225Mitsubishi ASX5374.3%n/a53,1933.0%n/a5n/a6Mitsubishi Outlander4293.4%– 18.9%72,9542.8%– 6.1%647Kia Sportage2992.4%+ 73.8%151,5651.5%n/a12n/a8Ford Everest2882.3%+ 44.0%111,7801.7%+ 16.3%9199Mitsubishi Triton2512.0%+ 153.5%93,7943.6%+ 27.1%41010Mazda CX-52492.0%+ 44.8%161,4151.3%+ 1.5%162311Toyota Corolla Cross2151.7%– 41.6%n/a1,1811.1%n/a211712Suzuki Swift2041.6%+ 1.5%132,3312.2%– 30.5%8613Mercedes Sprinter2021.6%+ 60.3%n/a7540.7%+ 19.1%n/an/a14Mitsubishi Eclipse Cross1991.6%– 36.0%81,5721.5%– 47.5%11715Toyota Prado1891.5%n/an/an/an/an/an/an/a16Ford Puma1831.5%n/an/an/an/an/an/an/a17Toyota Yaris Cross1801.4%– 49.9%41,4211.3%– 15.8%151118Toyota Corolla1761.4%– 2.2%101,3041.2%– 21.8%171219Kia Stonic1701.4%n/an/a1,4571.4%+ 1.7%142120Nissan Navara1471.2%+ 162.5%181,7031.6%+ 54.3%10n/an/aToyota Hiace1301.0%– 18.8%n/a1,5401.4%– 4.8%1318n/aMG ZS1231.0%– 35.9%n/a1,2761.2%– 54.7%189n/aFord Transit880.7%n/a191,2671.2%n/a19n/an/aIsuzu D-Max850.7%+ 51.8%n/a1,1491.1%+ 18.7%22n/an/aToyota Highlander530.4%n/a201,1831.1%n/a20n/a
Source: MIA

