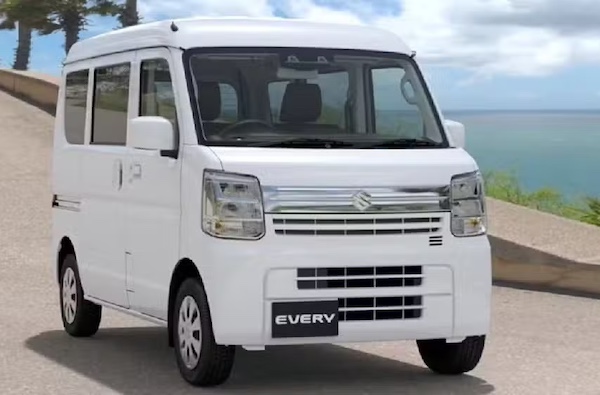
Pakistan October 2024: Suzuki Bolan up to #2, Suzuki Every launches
The Suzuki Every makes its first appearance in the Pakistani charts.
Local association PAMA has Pakistani sales of locally made new light vehicles back up 112.1% year-on-year in October to 13,108. The year-to-date tally is now up 50.2% to 105,065. Note Changan and Kia do not report sales figures to PAMA but are estimated to be quite successful here. Suzuki is up 91.7% to 55.7% share vs. 50.3% year-to-date, and is followed by Toyota (+141.8%), Honda (+229.8%) and Sazgar Haval (+296.4%). The Suzuki Alto (+80.1%) holds onto the models top spot with 35.7% share, while the Suzuki Bolan (+630.1%) surges to 2nd place with 8% share vs. #8 and 4.1% year-to-date. The Suzuki Every makes its first appearance in the charts at #12 with 2% share.
Previous month: Pakistan September 2024: Market up 23.9%
One year ago: Pakistan October 2023: Suzuki Alto breaks share record at 42.1%, Hyundai Santa Fe lands
Full October 2024 Top 9 All brands and Top 25 All models below.
Pakistan October 2024 – brands:
PosBrandOct-24%/23Sep2024%/23PosFY231Suzuki7,30255.7%+ 91.7%152,86950.3%+ 66.5%112Toyota2,53219.3%+ 141.8%222,26421.2%+ 21.3%223Honda1,51411.6%+ 229.8%313,19112.6%+ 50.8%334Sazgar Haval9997.6%+ 296.4%47,6557.3%+ 251.3%555Hyundai5984.6%+ 8.3%58,0307.6%+ 3.6%446JAC1251.0%+ 111.9%68140.8%+ 127.4%677Dewan Kia270.2%new7880.1%new8 –8Isuzu80.1%n/a81140.1%+ 29.5%799BAIC30.0%+ 200.0%9400.0%– 71.2%98
Pakistan October 2024 – models:
PosModelOct-24%/23Sep2024%/23PosFY231Suzuki Alto4,68535.7%+ 80.1%135,20133.5%+ 105.5%112Suzuki Bolan1,0448.0%+ 630.1%64,2854.1%+ 59.0%8123Sazgar Haval H69997.6%+ 296.4%37,6557.3%+ 251.3%3154Toyota Corolla (est)9667.4%+ 122.1%28,1947.8%+ 38.9%225Honda Civic (est)8086.2%+ 274.1%56,8346.5%+ 95.9%446Toyota Yaris (est)7775.9%+ 115.2%46,5976.3%+ 34.5%537Honda City (est)6104.7%+ 274.2%85,1534.9%+ 93.2%7118Suzuki Ravi4123.1%+ 83.1%92,6832.6%+ 13.3%10139Toyota Corolla Cross (est)3582.7%new102,8902.8%new9 –10Suzuki Cultus3432.6%+ 4.6%192,5992.5%– 12.0%11811Suzuki Swift3302.5%+ 4.8%75,3365.1%+ 41.2%6512Suzuki Every2622.0%new –2620.2%new22 –13Hyundai Porter2451.9%+ 62.3%132,2222.1%+ 75.1%151614Toyota Hilux (est)2371.8%+ 71.7%112,5262.4%– 39.3%13615Suzuki WagonR2261.7%+ 14.7%152,5032.4%– 11.4%141016Toyota Fortuner (est)1941.5%+ 71.7%142,0572.0%– 39.3%16917JAC X2001251.0%+ 111.9%218140.8%+ 127.4%202018Hyundai Tucson1110.8%– 18.4%122,5772.5%– 33.6%12719Hyundai Elantra1050.8%+ 101.9%171,0361.0%– 13.7%191720Honda BR-V & HR-V960.7%+ 20.0%161,2041.1%– 53.5%181421Hyundai Santa Fe940.7%– 46.3%181,5451.5%+ 782.9%172122Hyundai Sonata430.3%+ 13.2%206500.6%– 47.1%211823Dewan Kia Shehzore270.2%new22880.1%new24 –24Isuzu D-Max80.1%n/a231140.1%+ 29.5%232325BAIC BJ40L30.0%+ 200.0%24400.0%– 71.2%2522
Source: PAMA

