
Czechia August 2024: Skoda Karoq best-seller for the 2nd time ever
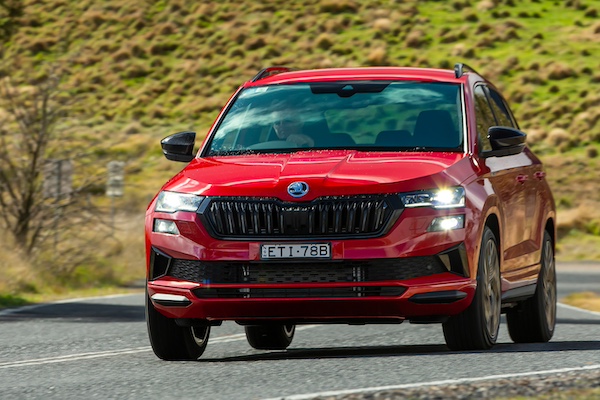
The Skoda Karoq is #1 at home in August.
17,084 new cars hit Czech roads in August, off -8.7% year-on-year. Positive YTD tally however at +2.3% and 153,757 units. Local powerhouse Skoda (-1.6%) falls slower than its home market to achieve a 33.8% share, slightly up from its YTD level of 33.3%. Toyota (-6.7%) also resists somewhat to 9.5% share, one percentage point above YTD. For Hyundai (-33.4%) and Volkswagen (-43.4%) the fall is drastic. Kia (-8.3%) almost matches the market at #5 ahead of a surging Dacia (+25.3%). Opel (+96.3%), Peugeot (+17.4%) and Ford (+14.6%) also shine in the remainder of the Top 10.
The Skoda Karoq (+84.5%) takes the lead of the Czech models ranking in August with a splendid 7.3% share vs. 4.4% year-to-date. This is the Karoq’s second ever win at home after May 2022. A freefalling Skoda Octavia (-37.7%) follows but easily holds onto the year-to-date charts with 9% share. The Skoda Kodiaq (+52.5%) stays at #3 with a splendid year-on-year evolution, with the Scala (-0.6%) stable and Fabia (-17.4%) weak making it five Skodas in the Top 5. The Hyundai i30 (-22.9%) is the best of the rest as it is also year-to-date. Excellent scores by the Opel Crossland (+1078.3%), Toyota Proace City (+136.4%) and Ford Kuga (+124.7%).
Previous month: Czechia July 2024: 7 Skodas in Top 7 for the first time this year
One year ago: Czechia August 2023: Skoda Octavia leads, VW Golf up to record 2nd place
Full August 2024 Top 55 All brands and Top 293 All models below.
Czechia August 2024 – brands:
PosBrandAug-24%/23Jul2024%/23PosFY231Skoda5,77733.8%– 1.6%151,17833.3%– 2.7%112Toyota1,6309.5%– 6.7%213,1278.5%+ 14.3%343Hyundai1,2997.6%– 33.4%414,0889.2%– 0.4%224Volkswagen1,0656.2%– 43.4%310,1696.6%– 21.7%435Kia9335.5%– 8.3%56,9134.5%– 12.2%556Dacia6784.0%+ 25.3%85,9523.9%+ 14.4%677Mercedes5963.5%– 10.8%65,3003.4%– 10.1%768Ford5413.2%+ 14.6%73,9052.5%– 3.5%899Peugeot4462.6%+ 17.4%113,5222.3%+ 16.9%111010Opel4242.5%+ 96.3%142,5131.6%+ 30.3%151711BMW4002.3%– 28.2%103,7672.4%– 6.9%9812Renault3492.0%+ 15.9%183,1902.1%+ 12.9%121213Volvo3091.8%+ 34.3%93,5372.3%+ 89.8%101414Audi2971.7%+ 18.8%132,3051.5%– 17.5%161115MG2401.4%– 20.3%122,6581.7%+ 70.3%131816SsangYong2301.3%– 11.2%212,5411.7%+ 17.4%141317Lexus2021.2%+ 43.3%191,6141.0%+ 71.9%202318Cupra1921.1%+ 39.1%161,5101.0%+ 18.2%212119Suzuki1881.1%– 12.6%172,2611.5%+ 11.8%171520Tesla1550.9%– 3.1%152,1131.4%+ 104.4%182221Citroen 1480.9%– 2.6%202,0601.3%+ 46.4%192022Honda1080.6%+ 61.2%238960.6%+ 102.7%242823Nissan1050.6%– 13.2%307970.5%+ 78.3%252624Fiat930.5%+ 20.8%265000.3%+ 23.5%292925Land Rover880.5%+ 44.3%246120.4%+ 4.8%272526Subaru810.5%– 12.0%286220.4%+ 8.7%262427Mazda640.4%– 67.3%251,2680.8%– 15.0%231928Seat630.4%– 73.1%221,3210.9%– 36.4%221629Mitsubishi540.3%+ 58.8%275910.4%+ 148.3%283230Porsche510.3%– 31.1%294320.3%– 13.3%302731Jeep300.2%– 41.2%312980.2%+ 4.2%313032Mini260.2%– 27.8%322480.2%– 14.5%323133Dodge160.1%+ 6.7%351310.1%+ 79.5%343634Joyear160.1%new48390.0%new40 –35Forthing110.1%+ 120.0%37620.0%+ 287.5%384736Lamborghini110.1%+ 120.0%40580.0%+ 18.4%394037Ferrari100.1%– 28.6%34850.1%– 15.0%363538Ineos80.0%+ 60.0%47310.0%+ 138.5%434339DFSK70.0%+ 75.0% –180.0%– 47.1%464240Alfa Romeo60.0%– 25.0%331460.1%+ 11.5%333441DS60.0%– 78.6%361140.1%– 33.7%353342Chevrolet60.0%– 14.3% –320.0%– 25.6%423843SWM60.0%n/a46160.0%+ 1500.0%486544Jaguar40.0%– 66.7%38700.0%– 6.7%373745Alpine40.0%+ 33.3%43220.0%+ 37.5%445046Dongfeng30.0%new39180.0%new47 –47Maserati20.0%– 33.3%42220.0%– 37.1%454148Aston Martin20.0%+ 100.0%45120.0%– 29.4%504649Chrysler20.0%n/a –90.0%+ 80.0%535250KTM20.0%+ 100.0% –40.0%+ 100.0%585551Bentley10.0%– 80.0%41320.0%+ 6.7%413952Nio10.0%new –100.0%new515753Lotus10.0%– 66.7%5070.0%– 65.0%544954McLaren10.0%n/a5160.0%+ 0.0%565355Lada10.0%n/a –10.0%– 95.7%6548 –Others950.6%– 2.1% –7120.5%– 22.2% – –
Czechia August 2024 – models:
PosModelAug-24%/23Jul2024%/23PosFY231Skoda Karoq1,2427.3%+ 84.5%26,7954.4%+ 11.4%352Skoda Octavia1,0526.2%– 37.7%113,8709.0%– 9.5%113Skoda Kodiaq9155.4%+ 52.5%36,9044.5%+ 16.6%264Skoda Scala8304.9%– 0.6%76,4434.2%+ 2.0%435Skoda Fabia6603.9%– 17.4%45,8193.8%– 18.8%726Hyundai i306043.5%– 22.9%86,1664.0%+ 12.4%577Skoda Superb5233.1%+ 48.6%54,7873.1%+ 8.4%898Kia Ceed5113.0%+ 28.1%102,9201.9%– 3.4%12119Skoda Kamiq4692.7%– 40.9%65,9513.9%– 7.3%6410Toyota Corolla4482.6%+ 24.4%113,1732.1%+ 31.5%111211Dacia Duster3602.1%+ 31.9%123,1742.1%+ 51.1%101312Hyundai Tucson3251.9%– 39.4%93,9312.6%– 11.8%9813Toyota Proace City2861.7%+ 136.4%151,5621.0%+ 73.9%183614Opel Crossland X2711.6%+ 1078.3%241,1560.8%+ 99.0%265615VW Golf2401.4%– 71.4%132,0961.4%– 40.3%141016Toyota RAV42211.3%+ 15.1%192,3141.5%+ 128.2%132317Toyota Yaris Cross2131.2%– 29.7%201,7731.2%– 10.0%161418Ford Kuga2091.2%+ 124.7%231,1530.7%+ 33.1%283419Kia Sportage1961.1%+ 3.7%161,5121.0%– 2.5%192020Dacia Sandero1620.9%+ 13.3%211,3480.9%– 7.2%211721VW Tiguan1610.9%– 33.5%171,6861.1%– 10.8%171522Cupra Formentor1590.9%+ 50.0%181,2310.8%+ 29.0%233123MG ZS1560.9%– 30.4%142,0021.3%+ 65.9%152124Dacia Jogger1560.9%+ 30.0%261,3770.9%– 12.1%201925SsangYong Korando1490.9%– 32.0%441,3110.9%– 15.4%221826Toyota Yaris1410.8%– 40.0%321,0930.7%– 39.7%291627Tesla Model Y1290.8%+ 40.2%221,1560.8%+ 141.3%276028Peugeot 20081280.7%+ 23.1%251,2100.8%+ 55.1%243229Renault Clio 1250.7%+ 76.1%468850.6%+ 8.7%354230VW Caddy1210.7%– 1.6%339740.6%– 2.7%322431Hyundai i201210.7%+ 13.1%431,1750.8%+ 23.6%253732Mercedes GLC940.6%+ 9.3%287640.5%+ 39.9%436233Ford Puma910.5%– 21.6%278780.6%+ 14.0%373534Peugeot 5008890.5%+ 178.1%1582840.2%– 21.1%989135Volvo EX30880.5%new364690.3%new68 –36Suzuki S-Cross870.5%– 10.3%499330.6%– 0.9%332837Ford Transit/Tourneo Custom860.5%+ 26.5%304620.3%– 28.9%704838Skoda Enyaq840.5%– 24.3%885560.4%– 26.4%572639Hyundai Bayon800.5%– 38.5%741,0470.7%+ 27.1%302940Kia Xceed780.5%+ 9.9%455250.3%– 14.4%605541Ford Focus740.4%+ 17.5%396370.4%+ 12.0%515942Toyota C-HR730.4%– 52.9%477980.5%– 17.0%412743Citroen Berlingo690.4%+ 666.7%543820.2%+ 430.6%8419844Hyundai Kona680.4%– 49.3%348600.6%– 16.7%393045VW Touran650.4%– 61.3%375250.3%– 55.4%612246VW Passat650.4%+ 30.0%417090.5%+ 0.1%464547Audi Q8640.4%+ 28.0%553840.2%– 31.1%835248Nissan Qashqai630.4%– 28.4%994530.3%+ 78.3%739449Mercedes E Class630.4%+ 687.5%664410.3%+ 290.3%7514250BMW X5610.4%– 36.5%357520.5%+ 8.5%444351Peugeot 308610.4%– 28.2%516610.4%+ 16.0%505852Mercedes V Class600.4%– 23.1%425620.4%– 28.0%564153Peugeot 208570.3%– 27.8%846610.4%+ 12.6%495754Toyota Camry570.3%+ 58.3%1603360.2%+ 48.7%8910555VW Transporter560.3%– 42.3%707970.5%– 3.2%423956Volvo XC90560.3%+ 0.0%381,0160.7%+ 74.3%314957Volvo XC60560.3%+ 5.7%578250.5%+ 63.4%405358Volvo XC40550.3%– 12.7%484750.3%+ 3.7%666459Lexus NX530.3%+ 10.4%755060.3%+ 62.2%629560Kia Stonic520.3%– 33.3%406730.4%– 4.0%483861BMW 5 Series520.3%+ 85.7%763300.2%– 6.8%918962BMW X1510.3%– 33.8%604580.3%– 1.7%717063Lexus RX500.3%+ 19.0%714970.3%+ 63.5%638164Toyota Aygo X480.3%– 21.3%316360.4%– 0.3%525065VW Polo480.3%– 5.9%864870.3%+ 17.6%656866Toyota Proace470.3%– 69.5%618700.6%– 6.7%382567Opel Combo460.3%+ 253.8%1782090.1%+ 40.3%12116768Hyundai i10450.3%– 63.4%1135330.3%+ 6.8%596669Mercedes GLE450.3%– 49.4%505530.4%– 36.6%583370Suzuki Vitara450.3%– 25.0%626830.4%+ 1.8%474671VW T-Roc450.3%+ 4.7%1004050.3%– 3.6%797272Renault Captur430.3%– 52.2%798840.6%+ 31.9%364473Peugeot Rifter430.3%+ 437.5%912460.2%+ 35.9%10714874VW Multivan420.2%– 28.8%525940.4%+ 33.8%556775BMW 3 Series420.2%– 10.6%1453200.2%– 21.2%938076Audi A6420.2%+ 20.0%643350.2%+ 7.4%908377Fiat 500420.2%+ 50.0%852320.2%+ 41.5%11414178Audi Q5410.2%+ 86.4%812180.1%– 14.5%11611079Citroen C4410.2%+ 215.4%564920.3%+ 64.0%649780Opel Mokka400.2%+ 29.0%674210.3%+ 1.4%778481Honda CR-V400.2%+ 100.0%784530.3%+ 106.8%7210282Renault Trafic400.2%+ 400.0%1052620.2%+ 133.9%10416383VW T-Cross390.2%+ 14.7%294640.3%– 12.8%696584Renault Austral390.2%+ 39.3%1592910.2%+ 49.2%9711185SsangYong Tivoli390.2%n/a966150.4%+ 294.2%5312786Lexus LBX390.2%new941420.1%new149 –87Toyota Proace Verso390.2%new121640.0%new196 –88Kia Proceed370.2%– 27.5%826130.4%+ 39.6%547389Audi Q7370.2%– 2.6%632160.1%– 56.4%1177190Peugeot 3008360.2%+ 12.5%872390.2%– 27.1%1119991VW Taigo350.2%– 14.6%773300.2%– 43.1%926192BMW X7350.2%– 12.5%1103960.3%+ 35.6%809093BMW X3340.2%– 17.1%1222020.1%– 41.3%1248894Hyundai Santa Fe330.2%– 54.8%174850.1%– 83.3%1796395Mercedes Vito330.2%– 17.5%533110.2%– 21.1%958696VW ID.4330.2%+ 200.0%129770.1%– 42.1%18715797Mercedes GLS320.2%– 25.6%723590.2%– 14.5%867698Opel Astra 320.2%– 23.8%654320.3%+ 52.1%7610099VW Touareg320.2%– 13.5%733500.2%+ 4.2%8787100Suzuki Swift320.2%+ 6.7%1112660.2%+ 43.0%103120101Lexus RZ320.2%n/a237520.0%+ 5100.0%209319102Mercedes EQA310.2%+ 520.0%144830.1%+ 84.4%181208103Porsche Cayenne300.2%+ 25.0%1311530.1%+ 37.8%144139104Renault Kangoo300.2%+ 114.3%1612390.2%+ 143.9%112168105MG 4300.2%n/a831660.1%+ 3220.0%141227106Audi Q3290.2%– 21.6%1172730.2%– 34.7%10174107Mercedes GLA290.2%+ 3.6%1282530.2%+ 14.0%105109108Honda HR-V290.2%+ 107.1%1271880.1%+ 248.1%128183109Land Rover Defender290.2%+ 141.7%801670.1%– 3.5%140122110Mercedes GLB280.2%– 17.6%683820.2%+ 59.2%85101111Subaru Outback280.2%+ 0.0%1093040.2%+ 64.3%96107112Fiat Panda280.2%+ 300.0%1921140.1%+ 123.5%162207113Audi A5270.2%+ 200.0%1061740.1%+ 128.9%137188114MG 3260.2%new259290.0%new245 –115Mercedes CLA250.1%– 53.7%1322520.2%– 29.8%10685116MG HS240.1%– 64.7%593940.3%+ 27.1%8196117Tesla Model 3240.1%– 60.7%589110.6%+ 595.4%34117118Toyota Highlander240.1%+ 140.0%1152080.1%+ 170.1%123177119Seat Arona230.1%– 28.1%973200.2%– 55.4%9447120Mercedes G Class230.1%+ 15.0%921750.1%– 13.8%136119121Mitsubishi ASX230.1%+ 76.9%932660.2%+ 454.2%102185122Mercedes CLE230.1%new1241330.1%new154333123Mitsubishi Space Star220.1%+ 57.1%1192080.1%+ 27.6%122140124Audi A4220.1%+ 69.2%1122780.2%+ 107.5%99147125Ford Tourneo Courier220.1%new1481490.1%new148354126Suzuki Ignis210.1%– 22.2%693360.2%+ 103.6%88129127SsangYong Rexton210.1%+ 0.0%1732110.1%– 23.3%120108128SsangYong Torres210.1%+ 23.5%1163890.3%+ 1752.4%82154129VW ID.7210.1%new1551090.1%new165372130Mazda CX-30200.1%– 48.7%1621990.1%– 31.6%12598131Kia Sorento200.1%– 39.4%901770.1%– 0.6%133121132Peugeot 408200.1%– 37.5%1031830.1%+ 19.6%131126133Honda ZR-V200.1%+ 42.9%1351150.1%+ 505.3%161215134Volvo V60190.1%+ 90.0%1072200.1%+ 193.3%115189135Subaru Forester190.1%+ 533.3%1911100.1%+ 39.2%163182136Mercedes C Class180.1%– 28.0%1181850.1%– 44.9%13093137Lexus ES180.1%+ 63.6%1341960.1%+ 94.1%127158138Opel Zafira Life180.1%+ 1700.0%225250.0%+ 316.7%251314139Ford Transit170.1%– 45.2%1401710.1%– 17.4%138123140Renault Megane170.1%– 41.4%2382410.2%– 48.5%10979141BMW X6170.1%– 41.4%951870.1%– 3.1%129125142Audi A3170.1%– 15.0%1372380.2%– 13.5%113104143Honda Civic170.1%+ 41.7%1461080.1%+ 9.1%166160144Mini Countryman170.1%+ 70.0%1511310.1%+ 13.9%155169145Hyundai Ioniq 5170.1%+ 88.9%1521160.1%+ 31.8%160181146Toyota Prius170.1%+ 325.0%147610.0%+ 916.7%199286147Subaru Crosstrek170.1%new182580.0%new202341148Volvo S60160.1%+ 0.0%1021770.1%+ 311.6%135172149Seat Leon150.1%– 88.5%984450.3%+ 39.1%7475150Seat Ateca150.1%– 68.8%894160.3%– 40.6%7851151Nissan X-Trail150.1%– 34.8%1691600.1%+ 128.6%142162152Kia Niro150.1%– 21.1%1301180.1%– 38.5%159130153Range Rover Sport150.1%+ 15.4%1641400.1%+ 2.2%150144154BMW ix1150.1%+ 200.0%136940.1%+ 104.3%173195155Nissan Juke150.1%+ 650.0%2061190.1%+ 250.0%158230156Renault Espace150.1%new1991030.1%new170246157Mercedes A Class140.1%– 33.3%1201780.1%– 23.3%132113158Cupra Leon140.1%– 30.0%1012390.2%– 2.8%110114159Mercedes EQE140.1%+ 0.0%138640.0%– 1.5%195187160BMW i4140.1%+ 27.3%165820.1%+ 20.6%183178161VW ID. Buzz140.1%+ 133.3%226510.0%– 33.8%211194162Renault Scenic140.1%new236360.0%new232 –163BMW 4 Series130.1%– 76.8%1761520.1%– 35.0%145116164VW ID.3130.1%– 50.0%133760.0%– 55.6%188132165BMW X2130.1%+ 62.5%195730.0%+ 160.7%191257166Toyota bZ4X130.1%+ 85.7%179740.0%+ 111.4%190209167Ford Tourneo Connect120.1%– 65.7%1492150.1%+ 11.4%118118168Volvo V90120.1%– 52.0%1262760.2%+ 128.1%100131169Ford Explorer120.1%+ 500.0%197380.0%– 7.3%230231170Peugeot Traveller120.1%+ 500.0%208240.0%+ 140.0%255265171Opel Corsa110.1%– 84.7%1041990.1%– 35.4%12682172Kia Picanto110.1%– 42.1%1431670.1%+ 12.8%139145173Citroen C5 Aircross110.1%– 26.7%1531590.1%+ 71.0%143166174Nissan Townstar110.1%+ 120.0%230520.0%– 24.6%210199175Cupra Ateca110.1%+ 1000.0% –220.0%– 18.5%262256176Mazda CX-60100.1%– 73.0%1751770.1%– 28.0%134103177Subaru BRZ100.1%– 65.5%188870.1%– 32.6%177151178BMW 2 Series100.1%– 61.5%1771490.1%+ 8.8%147150179Range Rover 100.1%– 33.3%1391090.1%+ 17.2%164164180Range Rover Velar100.1%+ 100.0%246460.0%+ 21.1%215212181Fiat 600100.1%new125630.0%new197 –182Renault Rafale100.1%new219230.0%new259 –183Mazda CX-590.1%– 80.0%1084720.3%+ 9.5%6777184VW Arteon90.1%– 73.5%1232430.2%– 50.7%10869185Mercedes S Class90.1%– 66.7%189950.1%– 62.3%172106186Mini 90.1%– 55.0%171750.0%– 35.9%189161187Ford Mustang Mach-E90.1%+ 125.0%154880.1%+ 120.0%175210188Audi A790.1%+ 125.0%184610.0%+ 1.7%198191189Renault Arkana80.0%– 86.0%1572110.1%– 45.9%11978190Seat Tarraco80.0%– 52.9%2001040.1%– 18.1%169143191Mercedes Citan80.0%– 38.5%1501070.1%– 46.8%167133192Cupra Born80.0%– 27.3%289100.0%– 75.6%290202193Kia EV680.0%– 20.0%202650.0%– 35.6%194176194Ineos Grenadier80.0%+ 60.0%268310.0%+ 138.5%240242195Land Rover Discovery Sport80.0%+ 100.0%245450.0%+ 9.8%219224196Jeep Avenger80.0%+ 166.7%172820.1%+ 1266.7%184218197Renault Symbioz80.0%new –80.0%new301 –198Subaru XV70.0%– 76.7%260440.0%– 70.5%222128199Mazda270.0%– 46.2%210860.1%– 34.4%178156200Mercedes EQS70.0%– 41.7%212300.0%– 56.5%242180201BMW 2 Series Active Tourer70.0%– 36.4%239680.0%– 49.6%193152202Citroen C3 Aircross70.0%– 22.2%1851390.1%– 14.2%151136203Range Rover Evoque70.0%+ 75.0%194480.0%+ 20.0%213225204Jeep Wrangler70.0%+ 250.0%181590.0%+ 247.1%201270205BMW iX270.0%new256180.0%new268 –206Citroen C360.0%– 92.5%1427440.5%+ 39.3%4554207Mazda660.0%– 75.0%1701290.1%– 5.8%156149208Mercedes Sprinter60.0%– 73.9%183830.1%– 22.4%182170209Porsche 91160.0%– 68.4%2011000.1%– 24.8%171153210BMW 7 Series60.0%– 14.3%2031200.1%+ 6.2%157159211Land Rover Discovery60.0%+ 0.0%232450.0%+ 15.4%218226212Mercedes B Class60.0%+ 50.0%228470.0%– 21.7%214196213Porsche Taycan60.0%+ 500.0%250260.0%– 16.1%248238214Mitsubishi Colt60.0%new167850.1%new180353215Alfa Romeo Stelvio60.0%new166720.0%+ 71.4%192213216Fiat Tipo50.0%– 86.5% –440.0%– 70.5%220134217Mazda350.0%– 85.3%1631500.1%– 28.2%146124218Citroen C4 X50.0%– 16.7%1801050.1%+ 36.4%168179219Mercedes AMG GT50.0%+ 0.0%221400.0%– 2.4%227220220Lamborghini Huracan50.0%+ 66.7%291230.0%+ 21.1%257264221Mazda MX-550.0%+ 150.0%243360.0%+ 50.0%231254222DFSK Glory 58050.0%+ 400.0% –70.0%– 46.2%303294223Jeep Grand Cherokee50.0%n/a25880.0%#DIV/0!298366224Opel GrandLand X40.0%– 87.5%211570.0%– 63.7%204146225Porsche Panamera40.0%– 42.9%168340.0%+ 0.0%235228226Lexus LC40.0%– 33.3%196530.0%+ 47.2%206222227DS 7 Crossback40.0%– 20.0%213590.0%– 3.3%200203228Mercedes EQB40.0%– 20.0%222440.0%+ 29.4%221221229Mercedes EQV40.0%+ 0.0%248220.0%+ 29.4%264269230Alpine A110 40.0%+ 33.3%251220.0%+ 37.5%260276231Ferrari 29640.0%+ 33.3%234220.0%+ 83.3%263278232VW California40.0%+ 100.0%193580.0%+ 45.0%203233233VW ID.540.0%+ 100.0%186250.0%– 55.4%253205234BMW i540.0%+ 300.0%235420.0%+ 4100.0%223279235Lamborghini Urus40.0%+ 300.0%254240.0%+ 100.0%254283236Volvo EX4040.0%new209120.0%new287 –237Fiat Doblo40.0%n/a40.0%n/a323 –238Toyota GT86/GR8630.0%– 95.9%227550.0%– 39.6%205155239Hyundai Staria30.0%– 90.6%1561370.1%– 40.9%152115240Jeep Compass30.0%– 87.0%190900.1%– 4.3%174165241BMW XM30.0%– 84.2%240330.0%– 50.0%237184242BMW X430.0%– 81.3%220770.1%– 23.8%186175243Porsche Macan30.0%– 70.0%205530.0%– 38.4%207173244Jaguar F-Pace30.0%– 57.1%207390.0%+ 14.7%229223245Mitsubishi Eclipse Cross30.0%– 57.1%233300.0%+ 25.0%243244246Audi Q230.0%– 25.0%244520.0%+ 18.2%208232247Mercedes EQT30.0%+ 0.0%198270.0%+ 575.0%247334248Ford Mustang30.0%+ 50.0%216340.0%– 44.3%234211249MG 530.0%+ 50.0%296250.0%+ 1150.0%250335250Citroen e-C430.0%+ 50.0% –130.0%+ 0.0%283271251Citroen Spacetourer30.0%+ 200.0%30540.0%+ 33.3%317326252Audi Q430.0%n/a223220.0%– 37.1%261219253Volvo EC4030.0%new25780.0%new300 –254DS 420.0%– 90.5%270450.0%– 44.4%216197255Citroen C5 X20.0%– 84.6% –150.0%– 86.5%276174256BMW IX20.0%– 77.8%204420.0%– 27.6%224201257Honda Jazz20.0%– 71.4%241300.0%– 40.0%241216258Seat Ibiza20.0%– 66.7%262330.0%– 83.3%238137259VW Crafter20.0%– 33.3%266140.0%– 46.2%281255260BMW Z420.0%+ 0.0%215350.0%+ 20.7%233250261BMW iX320.0%+ 0.0%30160.0%– 53.8%308291262Suzuki Swace20.0%+ 100.0%231250.0%+ 92.3%252290263Lexus RC20.0%+ 100.0% –70.0%+ 250.0%307328264Ferrari Purosangue20.0%new255190.0%new266351265Lexus LM20.0%new218160.0%new275340266Maserati Grecale20.0%n/a242120.0%– 40.0%285252267Ferrari SF90 Stradale20.0%n/a27590.0%– 35.7%293277268Opel Vivaro20.0%n/a25390.0%+ 80.0%295324269Lamborghini Revuelto20.0%new –50.0%new313 –270Kia Rio10.0%– 99.3%280800.1%– 91.1%18540271Jeep Renegade10.0%– 93.8%281150.0%– 87.1%279171272Audi A110.0%– 87.5%263130.0%– 68.3%282239273Mercedes SL10.0%– 87.5%283100.0%– 85.9%291193274MG EHS10.0%– 85.7%141410.0%+ 17.1%225240275BMW 1 Series10.0%– 80.0%288390.0%– 40.9%228204276Fiat 500X10.0%– 80.0%247290.0%+ 45.0%244253277Audi A810.0%– 80.0%224180.0%– 41.9%267236278DS 310.0%– 50.0%27670.0%– 58.8%304273279Ferrari 812 Competizione10.0%– 50.0% –20.0%– 60.0%332313280Citroen e-C4 X10.0%– 50.0% –10.0%– 95.7%358258281Tesla Model S10.0%+ 0.0%187220.0%+ 120.0%265243282Porsche Boxster10.0%+ 0.0%286170.0%+ 13.3%272272283Ferrari Roma10.0%+ 0.0%297150.0%+ 36.4%277287284Tesla Model X10.0%+ 0.0%249110.0%– 35.3%289229285Bentley Bentayga10.0%+ 0.0%29380.0%+ 33.3%297296286Lexus LS10.0%+ 0.0%29470.0%+ 133.3%306303287Nissan Ariya10.0%+ 0.0%29540.0%– 20.0%320316288Chevrolet Corvette10.0%+ 0.0% –10.0%– 50.0%357325289Kia EV910.0%new217450.0%new217241290Mazda MX-3010.0%n/a273170.0%+ 88.9%271284291Jaguar F-Type10.0%n/a –150.0%+ 50.0%278288292Suzuki Across10.0%n/a292150.0%+ 114.3%280275293DFSK Fengon 510.0%n/a –50.0%– 44.4%312293
Source: SDA CIA

More Stories
Montenegro May 2026: Renault Captur stays #1, BYD Atto 2 on podium
The BYD Atto 2 ranks #3 for its first Top 10 finish in Montenegro. Based on data shared with us...
Hyundai’s Next Electric N Cars Could Get Even Wilder With Fake Idling, Backfires, and More Driver Feel
Hyundai’s N division has never been shy about having fun, and that spirit appears ready to carry even deeper into...
Tesla’s Full Self-Driving Is Causing Accidents: Here’s Who Florida Law Says Is Responsible
Tesla’s Full Self-Driving (FSD) technology represents one of the automotive industry’s most ambitious ventures into autonomous driving. While the system...
2026 GMC Terrain Invoice Pricing: What Dealers Pay After Two Price Hikes This Year
If the sticker price on a 2026 GMC Terrain feels higher than you remember from earlier in the model year,...
Porsche Sonderwunsch Takes Toy Story 5 911s From Imagination to Reality – Car Characters Explained Video
Porsche’s wild Disney and Pixar collaboration is getting another moment in the spotlight, this time through a new behind-the-scenes video...
How to Sell Your Used Car Fast Without the Hassle of Private Buyers
Image by kues1 on Magnific Selling a used car the traditional way can be a genuine headache. You take the...