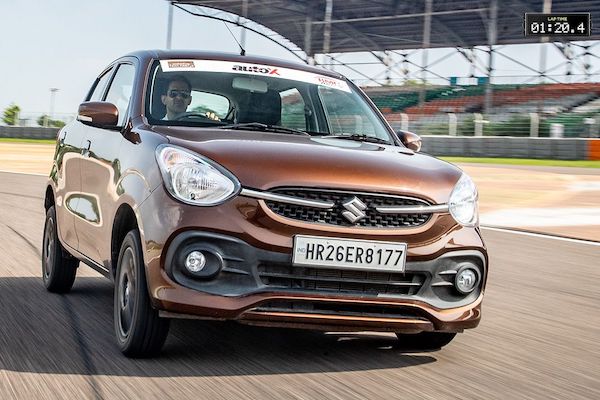
Mauritius July 2024: Suzuki tops market up 8.7%
Suzuki holds 22.9% of the Mauritius market so far in 2024
We welcome a new monthly update on BSCB: Mauritius. 1,300 new vehicles found a buyer in the country in July, a solid 8.7% year-on-year improvement. The year-to-date tally surges 18.5% to 9,665 units, headed to a third consecutive all time high annual volume. Suzuki (+0.5%) is stable to stay in the brands charts lead but at 16.8% for the month, its share is dwarfed by its 22.9% year-to-date level. Toyota (+26.5%), Kia (-25.7%) and Nissan (+62.5%) ensure the Top 4 is identical to the YTD one, but show very different fortunes. Other great performers include BMW (+2.4%) trailing the market year-on-year but up to 6.5% share vs. 4.8% so far this year, Hyundai (+33.9%) at 5.8% vs. 4.4% and MG soaring 220% to crack the Top 10 at #9. Honda (+154.5%), BYD (+450%) and GWM (+340%) also impress further down.
Previous post: Mauritius Full Year 2023: Suzuki distant leader, Mazda, BMW shine in record market
One year ago: Mauritius H1 2023: Suzuki up to 20.6% share
Full July 2024 Top 40 All brands ranking below.
Mauritius July 2024 – brands:
PosBrandJul-24%/237m 2024%/23PosFY231Suzuki21916.8%+ 0.5%2,21522.9%+ 34.3%112Toyota18614.3%+ 26.5%1,28413.3%+ 32.8%223Kia1108.5%– 25.7%7177.4%– 13.0%334Nissan1048.0%+ 62.5%6656.9%+ 7.8%445BMW846.5%+ 2.4%4654.8%– 0.4%666Hyundai755.8%+ 33.9%4304.4%– 1.6%757Mitsubishi705.4%– 1.4%4274.4%– 2.7%888Mazda503.8%– 21.9%5195.4%+ 19.3%579MG483.7%+ 220.0%2812.9%+ 170.2%91410Ford322.5%+ 18.5%2122.2%+ 63.1%121211Honda282.2%+ 154.5%1671.7%+ 51.8%131612Renault262.0%– 42.2%1631.7%– 24.2%141013Isuzu221.7%+ 69.2%2132.2%+ 43.0%111114BYD221.7%+ 450.0%1061.1%+ 307.7%193115GWM221.7%+ 340.0%750.8%+ 177.8%242716Volvo211.6%+ 16.7%780.8%– 28.4%221917Mercedes191.5%– 40.6%2262.3%– 11.4%10918Audi191.5%+ 18.8%1211.3%+ 4.3%181819Peugeot171.3%+ 13.3%1611.7%– 10.6%151320Perodua161.2%+ 60.0%1301.3%+ 19.3%171721Skoda120.9%+ 50.0%710.7%+ 1.4%272122Land Rover100.8%– 50.0%840.9%+ 7.7%202023Hino100.8%+ 0.0%760.8%+ 68.9%232424Ashok Leyland90.7%n/a360.4%+ 3500.0%313925JMC70.5%+ 133.3%290.3%+ 70.6%333426Porsche60.5%– 57.1%730.8%+ 5.8%262327Mini60.5%– 14.3%400.4%– 4.8%302528Eicher60.5%+ 100.0%290.3%– 6.5%322629Haval50.4%– 86.8%730.8%– 47.5%251530Proton50.4%+ 0.0%460.5%– 23.3%282231Changan50.4%new230.2%new353632Volkswagen40.3%– 33.3%460.5%+ 53.3%292933Jaguar40.3%– 42.9%230.2%– 28.1%343234Chery30.2%new1611.7%new163735Seat20.2%– 66.7%220.2%– 35.3%362836Citroen20.2%+ 0.0%200.2%– 44.4%373037UD Trucks20.2%+ 100.0%70.1%– 36.4%383538Sinotruk Howo00.0%n/a790.8%+ 364.7%213339Yutong00.0%– 100.0%10.0%– 83.3%393840Iveco00.0%n/a00.0%– 100.0% –40 –Others120.9%+ 200.0%710.7%+ 2.9% – –
Source: National Transport Authority

