South Africa October 2023: VW Group (+34.5%) impresses in negative market
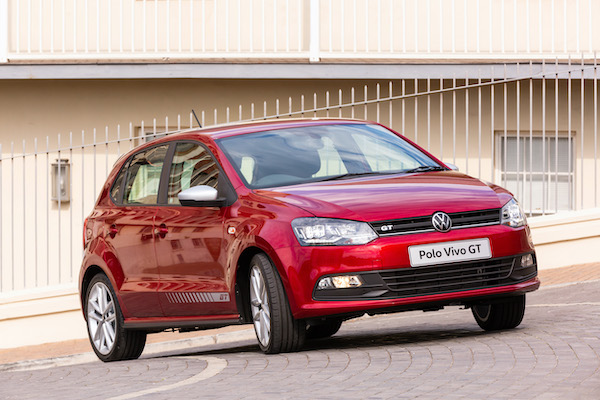
VW Polo Vivo sales are up 44% year-on-year in October.
New vehicle sales in South Africa edge down -2% year-on-year in October to 45,445 units. This means 446,877 new vehicles have been registered so far this year, a 2.1% year-on-year improvement. In the manufacturers ranking, Toyota (-1.1%) reigns supreme with 27.4% share, more than double the #2, the Volkswagen Group (+34.5%) in great shape. Suzuki (+8.9%) also defies the negative market to post a significant gain. No additional Top 10 member is in positive, with Hyundai (-2.4%) and Ford (-5.7%) resisting best and Haval (-46.6%) and Nissan (-27.7%) hit the hardest. Below, Stellantis (+38.2%), BMW Group (+24.6%) and Chery (+5.9%) make themselves noticed with year-on-year upticks.
Over in the models aisle, the Toyota Hilux (-0.8%) easily holds onto the top spot with 7.3% share, with the VW Polo Vivo (+44%) posting an excellent lift in 2nd place. The Toyota Corolla Cross (+4.3%) and Ford Ranger (+2.5%) exchange positions vs. last month to #3 and #4 respectively. It’s a strong month for the Toyota Hiace (+24.8%) up to #5 overall. The Toyota Starlet (+62.5%) and VW Polo (+52.7%) also make themselves noticed in the remainder of the Top 10. Below, the Chery Tiggo 4 Pro (+23.2%) is up to 11th place, the new Toyota Vitz climbs to a record #12, while the Suzuki S-Presso (+160.2%), VW Polo Sedan (+116.6%) and Suzuki Baleno (+110.3%) all shoot up.
Previous month: South Africa September 2023: Haval, Ford shine in market off -4.1%
One year ago: South Africa October 2022: Toyota monopolises podium, Haval H6 #10 in market up 11.4%
Full October 2023 Top 37 All manufacturers and Top 50 models below.
South Africa October 2023 – manufacturers:
PosManufacturerOct-23%/22Sep2023%/22PosFY221Toyota12,44027.4%– 1.1%1119,52126.7%+ 11.8%112Volkswagen Group6,59514.5%+ 34.5%256,66912.7%– 2.4%223Suzuki4,4809.9%+ 8.9%341,7159.3%+ 4.7%334Hyundai2,6385.8%– 2.4%526,8516.0%– 11.3%445Ford2,3185.1%– 5.7%425,3115.7%+ 14.8%576Nissan2,1784.8%– 27.7%624,4795.5%– 2.8%657Isuzu1,8484.1%– 15.5%719,7304.4%+ 11.8%7108Renault1,6063.5%– 20.1%918,0374.0%– 23.5%869Kia1,4173.1%– 20.4%816,1253.6%– 16.1%10910Haval 1,3893.1%– 46.6%1016,8683.8%– 9.7%9811Chery1,3022.9%+ 5.9%1113,4173.0%+ 159.9%11n/a12BMW Group1,1792.6%+ 24.6%1211,4862.6%+ 2.2%12n/a13Mahindra8271.8%– 14.6%139,9582.2%– 10.8%13n/a14Stellantis7781.7%+ 38.2%183,8790.9%– 43.2%16n/a15Mercedes6691.5%– 9.2%146,9401.6%– 14.6%14n/a16Daimler Trucks6051.3%+ 43.0%154,5041.0%+ 14.9%15n/a17FAW Trucks4200.9%+ 53.3%163,3560.8%+ 42.2%17n/a18Scania2880.6%+ 48.5%192,7290.6%+ 44.2%21n/a19Volvo Group2870.6%+ 28.7%252,3310.5%– 5.7%23n/a20Mazda2540.6%– 24.2%243,1220.7%– 29.5%18n/a21Honda2390.5%+ 30.6%172,8290.6%– 3.5%19n/a22Mitsubishi2210.5%– 33.4%222,6870.6%– 13.1%22n/a23Man2080.5%+ 58.8%231,9830.4%+ 40.4%25n/a24Jaguar Land Rover1980.4%– 23.8%202,7860.6%+ 6.1%20n/a25UD Trucks1760.4%– 15.8%212,0490.5%– 11.0%24n/a26Iveco1660.4%+ 37.2%318690.2%+ 24.0%29n/a27JAC1320.3%+ 116.4%299550.2%+ 1.4%28n/a28Proton1290.3%new274440.1%new33 –29Volvo Cars940.2%+ 20.5%281,0920.2%+ 6.0%27n/a30Porsche930.2%+ 32.9%261,1760.3%– 4.9%26n/a31Tata750.2%– 16.7%326620.1%– 22.1%31n/a32Subaru620.1%+ 3.3%355630.1%– 12.7%32n/a33Powerstar610.1%+ 22.0%307110.2%+ 3.0%30n/a34Babcock290.1%– 23.7%333170.1%+ 4.3%34n/a35VECV South Africa210.0%– 43.2%342610.1%– 27.5%35n/a36Sinotruk150.0%new36700.0%new36 –37Ferrari (Scuderia)80.0%+ 60.0%37470.0%– 27.7%37n/a
South Africa October 2023 – models:
PosModelOct-23%/22Sep2023%/22PosFY221Toyota Hilux3,3107.3%– 0.8%131,6517.1%+ 19.0%112VW Polo Vivo2,2805.0%+ 44.0%219,5434.4%+ 10.4%323Toyota Corolla Cross2,1004.6%+ 4.3%418,8944.2%+ 62.7%474Ford Ranger1,8534.1%+ 2.5%320,4484.6%+ 47.4%235Toyota Hiace1,5463.4%+ 24.8%614,5453.3%+ 53.1%6116Isuzu D-Max1,4643.2%– 18.8%516,2773.6%+ 13.8%547Toyota Starlet1,3633.0%+ 62.5%813,5243.0%+ 34.3%898Suzuki Swift1,2482.7%– 26.3%713,8903.1%– 5.7%769VW Polo1,2352.7%+ 52.7%910,1102.3%– 19.8%10810Nissan NP2009612.1%– 12.3%1010,8742.4%– 0.9%91011Chery Tiggo 4 Pro8561.9%+ 23.2%138,1701.8%+ 178.3%13n/a12Toyota Vitz7791.7%new202,9040.6%new34 –13Nissan Magnite7151.6%– 2.7%146,9731.6%+ 72.8%16n/a14Hyundai Grand i107051.6%– 12.5%118,5951.9%+ 97.9%12n/a15Renault Kwid6611.5%+ 0.9%215,3751.2%– 35.5%191316VW T-Cross6411.4%– 0.3%256,2361.4%– 27.9%181217Hyundai i206351.4%+ 57.6%394,1070.9%+ 49.5%28n/a18Toyota Fortuner6291.4%– 25.7%128,8582.0%+ 56.6%11n/a19VW Polo Sedan6281.4%+ 116.6%50n/an/an/an/an/a20Mahindra Scorpio Pik Up5651.2%– 9.5%226,9841.6%+ 1.4%15n/a21Kia Sonet5481.2%+ 51.0%155,2551.2%#VALUE!20n/a22Renault Kiger5451.2%– 1.3%176,5811.5%– 13.5%171523Toyota Urban Cruiser5441.2%– 70.1%234,6461.0%– 68.4%24524Suzuki S-Presso5361.2%+ 160.2%294,3171.0%– 3.8%27n/a25Haval Jolion5341.2%– 38.4%187,5391.7%+ 0.8%141426Suzuki Ertiga4981.1%+ 85.1%27n/an/an/an/an/a27Suzuki Baleno4901.1%+ 110.3%305,1911.2%#VALUE!21n/a28Toyota Corolla Quest4831.1%+ 5.2%195,1011.1%+ 50.2%22n/a29Haval H64721.0%– 50.6%264,3781.0%+ 29.2%25n/a30Suzuki Fronx4150.9%new24n/an/anewn/a –31Suzuki Grand Vitara3730.8%new33n/an/anewn/a –32Nissan NP300 Navara3540.8%– 30.2%363,8570.9%– 17.7%30n/a33VW Amarok3520.8%n/a37n/an/an/an/an/a34Toyota Rumion3430.8%+ 49.1%283,4070.8%+ 1.0%33n/a35Hyundai Venue3110.7%– 27.8%164,6591.0%– 25.7%23n/a36Kia Picanto3020.7%– 24.7%423,7530.8%– 39.0%31n/a37Hyundai H100 Bakkie3010.7%n/a38n/an/an/an/an/a38GWM P-Series2810.6%– 34.0%313,9500.9%+ 33.8%29n/a39Toyota Land Cruiser 3002790.6%n/a44n/an/an/an/an/a40Suzuki Celerio2760.6%+ 0.7%49n/an/an/an/an/a41Renault Triber2710.6%– 61.6%344,3451.0%– 13.5%26n/a42Toyota Land Cruiser 70/PU2680.6%n/a323,6940.8%#VALUE!32n/a43Hyundai Tucson2650.6%n/an/an/an/an/an/an/a44Chery Tiggo 7 Pro2500.6%– 32.2%41n/an/an/an/an/a45Ford Everest2500.6%n/a46n/an/an/an/an/a46Opel Corsa2180.5%n/an/an/an/an/an/an/a47Toyota Quantum2070.5%n/an/an/an/an/an/an/a48VW Tiguan1970.4%– 3.0%40n/an/an/an/an/a49Chery Tiggo 8 Pro1960.4%n/an/an/an/an/an/an/a50Citroen C31940.4%n/an/an/an/an/an/an/a
Source: NAAMSA


