
South Africa September 2026: Isuzu D-Max and Chery Tiggo 4 impress in strongest month in history

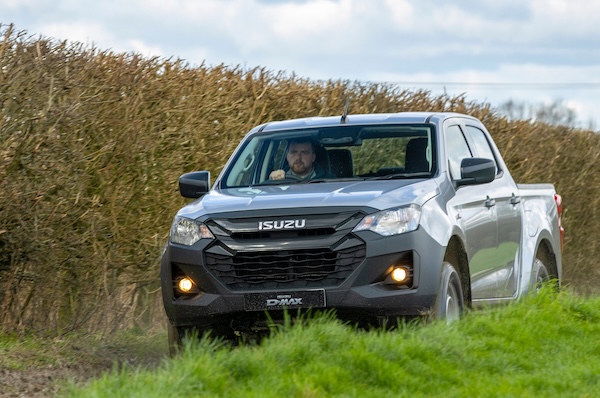
The Isuzu D-Max is the third best-selling vehicle in South Africa in September.
New vehicle sales in South Africa deliver their 23rd consecutive month of year-on-year gains and 8th straight double-digit uptick in September at +12.7% to 61,645 units. This is not only the best September volume ever but also the first time in history the SA market crosses the 60,000 unit-mark. The year-to-date tally is 12.5% to 492,201 which is believed to be an all time high record, eclipsing the previous best of 490,291 units over the first 9 months of 2013. Passenger vehicles are up 14.7% to 44,291 while light commercials advance 9.6% to 14,361. Unfortunately exports remain sluggish at -18.8% to 31,473 for the month and -10% to 281,458 year-to-date.
Like last month the Top 5 manufacturers all trail the market with single-digit gains: Toyota (+8.6%) remains by far in the lead at 24.9% share, followed by Suzuki (+9.8%), the VW Group (+3.6%), Ford (+3.1%) and Hyundai (+1.7%). Isuzu (+22%) surges ahead as does Chery (+32.7%) reaching a new volume record for the 5th straight month at 3,004 units. Jetour (+149.8%) continues to take off.
The Toyota Hilux (+3.6%) is dominant once again, celebrating 20 consecutive #1 monthly finishes. The VW Polo Vivo (+3.4%) stays in 2nd place just as the Isuzu D-Max (+24.2%) is up three spots on August and overtakes the Ford Ranger (+10.2%) to rank #2 pickup. The Chery Tiggo 4 (+63.5%) is down one rank on last month to #5 but surges year-on-year. Notice also the Toyota Starlet Cross (+120.3%) up to #10.
Previous month: South Africa August 2026: Toyota Hilux cements dominance in 22nd straight positive month
One year ago: South Africa September 2025: 7th double-digit market gains (+24.3%)
Full September 2026 Top 48 All manufacturers and Top 50 models below.
South Africa September 2026 – manufacturers:
PosManufacturerSep-26%/25Aug2026%/25PosFY251Toyota15,36624.9%+ 8.6%1113,97523.2%+ 5.5%112Suzuki6,66810.8%+ 9.8%253,78410.9%+ 0.9%223Volkswagen Group5,9689.7%+ 3.6%348,4009.8%+ 4.3%334Ford3,1905.2%+ 3.1%426,3485.4%+ 3.8%555Hyundai3,0575.0%+ 1.7%527,4885.6%+ 0.8%446Isuzu3,0224.9%+ 22.0%820,2894.1%+ 5.0%877Chery3,0044.9%+ 32.7%623,0694.7%+ 25.8%788GWM (incl. Haval)2,7004.4%+ 3.1%723,4084.8%+ 20.6%669Jetour2,0363.3%+ 149.8%916,8913.4%+ 201.0%91510Kia1,8403.0%+ 7.9%1014,7933.0%+ 10.6%10911Renault1,7112.8%+ 24.3%1112,8012.6%+ 4.5%121112Omoda and Jaecoo1,5032.4%+ 25.1%1312,6212.6%+ 46.9%131413Mahindra1,3982.3%– 8.3%1214,5623.0%+ 4.7%111014BMW Group1,3962.3%+ 14.4%1411,8992.4%+ 6.1%141315Tata PC8831.4%new154,8051.0%new19 –16Nissan8011.3%– 41.2%168,4581.7%– 25.7%151217Stellantis7001.1%– 17.5%176,1401.2%+ 14.9%161618BYD6591.1%new184,9701.0%new17 –19Mercedes5760.9%+ 9.7%194,8101.0%+ 4.8%181720FAW Trucks5350.9%+ 6.4%204,7911.0%+ 16.4%201821Foton4300.7%+ 4.9%214,4160.9%+ 79.8%211922Changan3310.5%new301,5200.3%new324123JAC3130.5%+ 39.1%222,8020.6%+ 39.5%232224Daimler Trucks2660.4%– 15.0%262,2900.5%– 11.0%242025MG2600.4%– 53.3%244,1680.8%+ 312.7%222426Mazda2470.4%+ 8.3%251,9650.4%– 1.5%272327UD Trucks2440.4%+ 27.7%341,7080.3%+ 5.4%302828Honda2390.4%– 38.1%312,0770.4%+ 14.6%262529Jaguar Land Rover2390.4%+ 4.4%282,1160.4%– 5.2%252130Salvador Caetano Group2350.4%new237170.1%new39 –31Volvo Group2320.4%+ 9.4%271,7260.4%+ 16.2%292932Scania2010.3%– 25.0%291,7450.4%– 2.2%282733Mitsubishi1930.3%+ 20.6%361,4790.3%– 2.4%333034Volvo Cars1670.3%+ 54.6%388780.2%+ 30.1%363435LDV1650.3%new336980.1%new40 –36Man1400.2%– 13.0%321,2470.3%+ 10.0%343137Porsche1180.2%+ 22.9%379880.2%+ 12.4%353338BAIC1040.2%– 16.1%351,5280.3%– 18.3%312639Powerstar980.2%– 30.0%408140.2%– 13.0%383240Sinotruk950.2%+ 61.0%398180.2%+ 53.5%373641Subaru810.1%– 1.2%463580.1%– 9.6%433742Tata500.1%– 21.9%415770.1%– 7.5%413543VECV South Africa460.1%– 25.8%434090.1%+ 53.8%424044Proton360.1%+ 2.9%48820.0%– 81.1%473845Iveco340.1%+ 6.3%442870.1%– 1.7%453946Shacman330.1%+ 230.0%423340.1%+ 3240.0%444347Babcock300.0%+ 57.9%452770.1%+ 76.4%464248Ferrari (Scuderia)50.0%– 37.5%47450.0%+ 2.3%4844
South Africa September 2026 – models:
PosModelSep-26%/25Aug2026%/25PosFY251Toyota Hilux3,7696.1%+ 3.6%130,6616.2%+ 15.2%112VW Polo Vivo2,5534.1%+ 3.4%220,3954.1%+ 10.2%223Isuzu D-Max2,5514.1%+ 24.2%616,5783.4%+ 5.7%564Ford Ranger2,5024.1%+ 10.2%319,4103.9%+ 2.7%335Chery Tiggo 42,2513.7%+ 63.5%417,9803.7%+ 54.8%486Suzuki Swift2,0123.3%– 11.2%516,5493.4%– 9.0%647Toyota Corolla Cross1,9643.2%+ 3.9%712,2202.5%– 24.4%858Toyota Starlet1,5732.6%– 3.4%910,8652.2%– 5.0%1099Hyundai Grand i101,5262.5%+ 3.8%813,5202.7%+ 5.8%7710Toyota Starlet Cross1,4672.4%+ 120.3%128,0121.6%+ 8.7%141311GWM Haval Jolion1,3512.2%+ 11.2%1111,3322.3%+ 15.3%91112Toyota Urban Cruiser1,3282.2%+ 11.5%147,1831.5%+ 6.4%181413Suzuki Ertiga1,2702.1%+ 66.0%108,6821.8%+ 21.4%131914Suzuki Fronx1,1841.9%+ 12.3%1310,2132.1%+ 2.6%111015VW Polo1,0051.6%+ 27.4%167,3451.5%+ 3.2%171716Toyota Vitz9491.5%– 34.4%158,8931.8%+ 34.1%121617Omoda C59361.5%+ 19.4%177,8671.6%+ 44.6%152118Toyota Fortuner9081.5%+ 7.8%226,4451.3%– 5.9%212019Kia Sonet8381.4%– 18.7%206,6981.4%– 14.6%191220Jetour T27571.2%n/a187,4261.5%n/a16n/a21Toyota Hiace6491.1%+ 9.8%245,6501.1%+ 2.0%242222Toyota Rumion6421.0%+ 8.1%196,2081.3%+ 30.3%232723VW T-Cross5961.0%– 1.7%274,8321.0%– 4.0%272424Jetour Dashing5840.9%+ 12.5%353,7420.8%+ 10.7%323425Renault Triber5780.9%+ 94.0%284,6050.9%+ 60.9%283726Mahindra XUV3X05750.9%– 4.3%236,3821.3%+ 24.9%222327Renault Kwid5280.9%– 21.1%373,8000.8%– 20.6%312528Mahindra Scorpio Pik Up5210.8%– 30.5%256,4741.3%– 11.2%201829GWM P-Series5170.8%+ 12.9%265,2881.1%+ 53.0%262930Suzuki Baleno5110.8%+ 6.9%343,7330.8%– 1.8%332831Tata Tiago4900.8%new213,5350.7%new37 –32Hyundai i204790.8%+ 78.1%294,3960.9%+ 51.7%293833Nissan Magnite4790.8%– 52.7%315,5861.1%– 25.4%251534Renault Kiger4630.8%+ 39.5%383,4160.7%– 5.2%403335Toyota Land Cruiser 704520.7%– 14.1%324,2110.9%– 9.8%302636Jetour T14410.7%n/a393,7260.8%n/a34n/a37VW Amarok4300.7%+ 9.7%403,6340.7%+ 28.3%353638BMW X34250.7%n/an/an/an/an/an/an/a39Jaecoo J54100.7%n/a46n/an/an/an/an/a40Ford Territory3990.6%+ 8.4%333,5860.7%+ 43.4%363941Chery Tiggo 73920.6%+ 19.5%483,2100.7%– 0.2%413542GWM Haval H63850.6%– 22.4%433,4680.7%+ 1.7%393143Suzuki DZire3700.6%n/a45n/an/an/an/an/a44Hyundai Exter3620.6%+ 2.0%303,4930.7%– 5.0%383245Kia Seltos3520.6%n/a36n/an/an/an/an/a46Citroen C33210.5%– 25.3%49n/an/an/an/an/a47Suzuki Across3050.5%n/a44n/an/an/an/an/a48Toyota RAV42900.5%n/an/an/an/an/an/an/a49Suzuki S-Presso2800.5%– 8.2%422,6310.5%– 0.8%424050Toyota Land Cruiser FJ2780.5%newn/an/an/anewn/a –
Source: NAAMSA

More Stories
Chile September 2026: Toyota RAV4, Suzuki Fronx, MG ZX highlight negative market
Toyota RAV4 sales in Chile are up 171.1% in September. New light vehicle sales in Chile drop -2.8% year-on-year in...
Czechia September 2026: Skoda monopolises Top 7, Epiq up
The Skoda Epiq is up to #23 at home in September. Disappointing month for new car sales in Czechia at...
Finland September 2026: Tesla Model Y at highest in 3 years
The Tesla Model Y holds 9.1% of the Finnish market in September. It’s another very satisfying month for new car...
Portugal September 2026: Tesla hits record volume and share, Omoda 5 in Top 10
The Tesla Model 3 holds a record 10.5% of the Portuguese market in September. Portuguese new car sales shoot up...
Japan September 2026: Mitsubishi (+20.5%), Nissan (+17.6%) shine, Land Cruiser, Jimny break records, BYD Racco up
Mitsubishi Delica Mini sales are up 49.5% in September. 433,683 new vehicles found a buyer in Japan in September, a...
Romania September 2026: BYD up to #4, Toyota (+37.1%) shines in market off -11.2%
The BYD Seal U ranks #8 in Romania in September. Paltry result once again for Romanian new car sales in...