
Pakistan August 2026: Honda (+145.4%) stands out in market up 10.7%

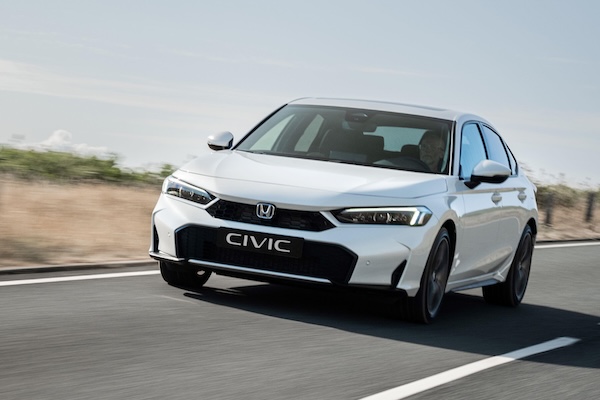
The Honda Civic is estimated to rank #3 in Pakistan in August.
According to local association PAMA, new light vehicle sales in Pakistan (domestically produced only) are up 10.7% to 15,558. Keep in mind this score doesn’t include Haval and Tank whose August volume is unknown. The year-to-date tally shoots up 22.7% to 137,949 units. Suzuki (+6.7%) trails the market but at 49.1%, its share is above the 48.5% it holds year-to-date. Toyota (+18.5%) is up to 25.9% share vs. 21.1% so far this year and Honda (+145.5%) outpaces them both to 16.9% share vs. 13.5%. Hyundai (-38.8%) struggles but JAC (+212.5%) surges. Jetour is up to #6. Model-wise, the Suzuki Alto (+27.3%) is at 34.3% of the market above the Suzuki Swift (-0.1%) and Honda Civic (estimated +265.6%).
Previous month: Pakistan July 2026: Suzuki Swift up to #2 year-to-date in market soaring 79.6%
One year ago: Pakistan August 2025: Suzuki Swift shoots up to #2, market up 61.5%
Full August 2026 Top 11 All locally made brands and Top 25 All models below.
Pakistan August 2026 – locally made brands:
PosBrandAug-26%/25Jul2026%/25PosFY251Suzuki7,63349.1%+ 6.7%166,85843.6%+ 29.3%112Toyota4,02925.9%+ 18.5%229,17419.0%+ 5.7%223Honda2,63316.9%+ 145.4%318,61912.1%+ 35.1%334Hyundai7424.8%– 38.8%46,9354.5%– 24.2%555JAC2751.8%+ 212.5%61,9671.3%+ 96.1%666Jetour1320.8%new78450.6%new8 –7Dewan Honri750.5%+ 82.9%92610.2%+ 77.6%1098Isuzu390.3%+ 200.0%105660.4%+ 2360.9%989Dewan Kia00.0%– 100.0%111370.1%– 49.8%11710Sazgar Havaln/an/an/a511,5317.5%+ 32.1%4411Tankn/an/anew81,0560.7%new7 –
Pakistan August 2026 – locally made models:
PosModelAug-26%/25Jul2026%/25PosFY251Suzuki Alto5,33934.3%+ 27.3%150,49036.6%+ 51.2%112Suzuki Swift1,4729.5%– 0.1%213,6229.9%+ 80.4%243Honda Civic (est)1,4559.4%+ 265.6%511,0218.0%+ 60.4%564Toyota Corolla (est)1,4169.1%+ 20.6%312,1778.8%+ 28.8%325Toyota Yaris (est)1,1397.3%+ 20.5%49,7957.1%+ 28.8%656Honda City (est)1,0987.1%+ 264.8%68,3136.0%+ 60.4%777Toyota Corolla Cross (est)5243.4%+ 20.7%74,5013.3%+ 28.8%9108Toyota Hilux (est)5233.4%+ 12.0%103,7062.7%– 4.4%10119Hyundai Elantra4582.9%+ 215.9%152,2581.6%+ 47.3%161710Toyota Fortuner (est)4272.7%+ 12.4%123,0222.2%– 4.4%121411Suzuki Every4152.7%+ 10.4%94,7333.4%+ 58.6%8912Suzuki Cultus2961.9%– 40.4%113,1202.3%+ 24.3%111313JAC X200 Ghandhara2751.8%+ 212.5%132,2361.6%+ 122.9%171814Hyundai Porter2521.6%– 19.7%142,4781.8%+ 12.0%131515Jetour1320.8%new179700.7%new20 –16Suzuki Fronx1110.7%new –2,3801.7%new14 –17Honda BR-V & HR-V800.5%– 78.6%191,9151.4%+ 10.5%181618Dewan Honri-Ve750.5%+ 82.9%203270.2%+ 122.4%232419Isuzu D-Max390.3%+ 200.0%215950.4%+ 129.7%212320Hyundai Sonata300.2%– 48.3%222970.2%– 69.1%242021Hyundai Tucson20.0%– 99.7%162,3121.7%– 33.4%151222Dewan Kia Shehzore00.0%– 100.0%241260.1%– 53.8%262223Hyundai Santa Fe00.0%– 100.0%233280.2%– 66.2%221924Sazgar Haval H6n/an/an/a811,5268.4%+ 32.1%4325Tank 500n/an/anew181,0480.8%new19 –
Source: PAMA
More Stories
Sedans Are Making a Comeback as Honda and Toyota Sales Surge in 2026
For years, the automotive industry has treated the traditional sedan as if it were headed for extinction, pushed aside by...
Dodge Charger Inventory Problem Deepens as Daytona EVs Pile Up and Sixpack Gains Ground
We have been spending quite a bit of time lately looking at what is happening inside Stellantis, and the new...
5 Auto Repair Shop Directories and Review Tools to Check in 2026
Finding a trustworthy mechanic used to mean asking a neighbor or gambling on whoever had the closest sign. That’s changed....
Supercars, SUVs and City Driving: Choosing the Right Car for Dubai
Dubai roads can make a good car feel very different each day. Cars that feel good on highways could struggle...
Argentina September 2026: Market down -12.6%, Ford Territory on podium
Second ever podium finish for the Ford Territory in Argentina. New light vehicle sales in Argentina reverse -12.6% year-on-year in...
Switzerland September 2026: Tesla Model Y breaks records at 7.7% share
The Telsa Model Y holds a record 7.7% of the Swiss market in September. The Swiss new car market is...