
USA August 2026: Weak market (-5.6%), Subaru, American Honda up, Ford down -10.2%

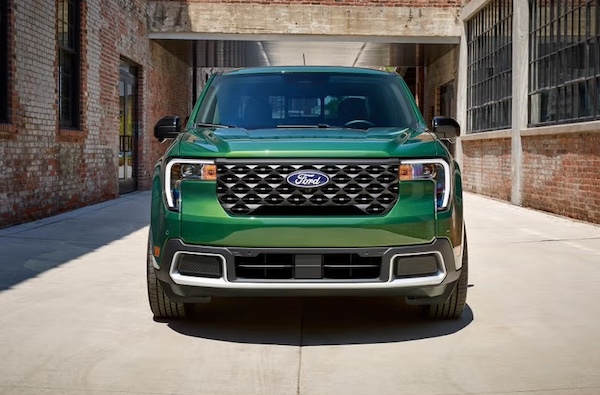
The Maverick (+14.4%) can’t prevent Ford falling in August.
Note: This update only features the brands still reporting monthly data.
New light vehicle sales in the US skid -5.6% year-on-year in August to 1.4 million units according to GlobalData. However August 2025 volumes were propped up ahead of the expiration of federal tax credits for EVs. Also, deliveries over the Labor Day holiday, traditionally one of the strongest sales periods of the year, will be included in September results this year versus August in 2025. Retail sales are estimate dot fall -7.7% to 1.2 million whereas fleets are up 7.5% to 219,000. The SAAR is up to 16.8 million according to Motor Intelligence, the highest since April 2025 and the sixth straight month above 16 million. Through August, the market is down -3% with retail deliveries down -4.7% and fleet shipments up 4.5%. GlobalData has raised its Calendar Year 2026 forecast by 130,000 units to 16.2 million.
EVs are expected to account for 7.2% of August light vehicle sales vs. a record of 12% a year ago. Hybrids continue to progress, to 18.2% share this month vs. 13.4% in August 2025. The average transaction price of a new vehicle in August is up 2% year-on-year to $45,563, the highest for the month of August according to JD Power and GlobalData. The average incentive per new car and light truck is up 5.9% to $3,384 in August, that’s 6.6% of the sticker price and up from 5.6% in August 2025. Incentives on ICE and hybrid vehicles are up 26% to $3,140 whereas EV incentives drop -20% to $2,297.
Most major OEMs still reporting monthly are down: Ford Motor sinks -10.3%, Toyota Motor is off -4.4% and Hyundai-Kia edges down -0.6% but American Honda is up 1%. Brand-wise, Toyota (-4.8%) remains the favourite just as Ford (-10.2%) endures an 8th consecutive month of year-on-year declines. Honda (+0.4%) snaps its 5th straight monthly gain while Hyundai (-1.7%) is down despite hybrid sales up 99%. Kia (+0.9%) is stable and Subaru (+1.3%) records a 4th straight monthly increase. Acura (+6.5%) also impresses.
As for models with available August volumes, the Ford F-Series (-1.2%) dominates and limit its YoY fall. The Honda CR-V (+10.2%) remains above the Toyota RAV4 (-19.1%), widening the gap between the two nameplates to 82,584 units after 8 months. The Toyota Camry (-9.7%) and Tacoma (-8.9%) are also in a rut. The Honda Civic (+1.8%) and Toyota Corolla (+1.5%) manage to nudge up while the Hyundai Tucson (+18.1%) excels. Further down, the Honda Accord (+19.1%), Subaru Forester (+17.8%), Hyundai Elantra (+16.1%) and Ford Maverick (+14.4%) all post satisfying gains.
Previous month: USA July 2026: Sales down -1.4%, Honda (+12.3%), Acura (+18.9%) stand out
One year ago: USA August 2025: EVs at record 12% share, Kia at all-time high
Full August 2026 data for selected OEMs, brands and models below.
USA August 2026 – OEMs reporting monthly:
OEMAug-26/251-8 2026/25Toyota Motor215,556– 4.4%1,675,307– 0.3%Hyundai-Kia178,405– 0.6%1,264,072+ 2.8%Ford Motor Co169,898– 10.3%1,339,780– 9.8%American Honda133,996+ 1.0%1,027,465+ 3.5%Subaru62,028+ 1.3%423,822– 3.0%Mazda34,735– 8.9%275,749– 6.0%
USA August 2026 – brands reporting monthly:
BrandAug-26/251-8 2026/25Toyota182,738– 4.8%1,442,376+ 0.4%Ford162,392– 10.2%1,277,175– 9.7%Honda122,174+ 0.4%933,932+ 3.4%Hyundai86,977– 1.7%620,025+ 2.1%Kia83,793+ 0.9%590,377+ 3.5%Subaru62,028+ 1.3%423,822– 3.0%Mazda34,735– 8.9%275,749– 6.0%Lexus32,818– 1.6%232,931– 4.5%Acura11,822+ 6.5%93,532+ 4.4%Genesis7,635– 3.7%53,670+ 3.3%Lincoln7,506– 10.4%62,605– 12.3%
USA August 2026 – models reporting monthly:
ModelAug-26/251-8 2026/25Ford F-Series67,504– 1.2%494,060– 10.9%Honda CR-V37,607+ 10.2%302,056+ 8.3%Toyota RAV434,232– 19.1%219,472– 31.7%Toyota Camry25,754– 9.7%235,334+ 12.1%Toyota Tacoma24,403– 8.9%193,399+ 5.1%Honda Civic21,976+ 1.8%177,411+ 5.1%Toyota Corolla21,772+ 1.5%175,776+ 8.8%Hyundai Tucson21,197+ 18.1%158,523+ 7.3%Ford Explorer19,801– 4.0%165,630+ 14.7%Subaru Crosstrek19,541– 4.4%122,953– 4.2%Kia Sportage18,723+ 3.9%129,713+ 8.5%Honda Accord 18,691+ 19.1%129,014+ 33.3%Hyundai Elantra17,747+ 16.1%114,701+ 12.0%Subaru Forester16,760+ 17.8%140,487+ 15.1%Subaru Outback15,233– 3.4%92,108– 11.4%Honda HR-V14,251+ 4.3%96,164– 8.0%Ford Maverick13,680+ 14.4%110,913+ 0.8%Hyundai Santa Fe13,512+ 5.2%90,888– 1.3%Ford Transit13,401– 14.4%105,269+ 0.1%Toyota 4Runner13,314– 0.8%98,991+ 70.2%Kia K412,881+ 6.5%98,554– 0.3%Hyundai Palisade12,729– 18.2%88,355+ 2.7%Kia Telluride12,693+ 4.2%98,111+ 16.7%Ford Bronco12,204– 8.8%102,215+ 3.0%Toyota Tundra12,189– 0.3%98,515– 2.2%Ford Bronco Sport11,827+ 8.3%95,409+ 1.2%Lexus RX10,256+ 4.0%80,454+ 12.1%Toyota Sienna10,133+ 29.1%74,992+ 10.2%Toyota Grand Highlander9,991– 23.5%96,917+ 8.5%Honda Pilot9,978– 7.5%83,486– 2.8%Kia Sorento9,880+ 14.5%68,266+ 1.1%Mazda CX-509,694– 3.3%86,204+ 21.8%Mazda CX-59,657– 17.9%84,417– 13.5%Kia Seltos9,214+ 65.3%50,525+ 42.6%Toyota Corolla Cross8,740+ 25.0%80,355+ 20.0%Ford Expedition7,765– 11.0%53,973– 11.6%Kia K57,523+ 9.9%52,611+ 11.2%Kia Carnival7,389+ 13.3%54,736+ 20.0%Honda Odyssey6,945+ 3.8%56,974– 13.1%Hyundai Sonata6,899+ 43.9%49,174+ 16.5%Lexus NX6,657– 4.4%43,879– 15.7%Hyundai Kona6,165– 13.0%48,374– 9.1%Ford Ranger6,033+ 18.9%45,925+ 4.3%Honda Passport6,000+ 16.0%42,001+ 13.5%Subaru Ascent5,155+ 37.2%28,925+ 2.4%Acura MDX5,016+ 66.3%33,903+ 21.3%Lexus TX5,015– 4.1%38,208+ 8.8%Honda Ridgeline4,549– 0.1%32,611– 3.6%Mazda CX-304,538– 4.7%30,680– 30.1%Mazda34,427+ 91.7%28,782+ 34.9%Mazda CX-904,265– 37.3%30,367– 27.0%Toyota Land Cruiser4,052+ 34.8%23,582– 28.5%Hyundai Ioniq 53,818– 50.9%28,184– 13.8%Toyota BZ/bZ4X3,696+ 262.4%24,477+ 100.6%Ford Mustang3,647+ 12.7%35,778+ 15.4%Lincoln Nautilus3,627+ 28.9%23,677– 1.7%Toyota Highlander3,564– 12.3%39,217+ 1.6%Toyota Prius3,397– 32.1%26,054– 39.4%Genesis GV703,229– 6.6%23,813+ 5.9%Ford E-Series3,095– 12.3%24,337– 8.4%Acura ADX3,015+ 17.4%22,510+ 136.4%Lexus IS3,000+ 61.1%20,030+ 51.3%Lexus ES2,983– 23.5%7,256– 72.7%Kia Niro2,983– 4.5%18,472+ 4.6%Genesis GV802,711+ 3.1%18,247+ 6.7%Lexus GX2,705– 18.8%20,505– 20.0%Hyundai Venue2,639– 7.8%21,143+ 1.2%Toyota Crown Signia2,493+ 56.8%15,927+ 4.6%Toyota Sequoia2,471+ 26.7%18,972+ 15.3%Acura Integra2,102+ 20.5%18,559+ 42.0%Ford Mustang Mach-E1,989– 72.5%15,484– 54.9%Lincoln Navigator1,881+ 15.8%13,930– 5.5%Kia EV91,789– 33.2%10,474+ 12.0%Honda Prologue1,788– 80.9%11,749– 63.3%Subaru WRX1,778+ 191.0%10,324+ 37.7%Lincoln Aviator1,732+ 22.4%16,584+ 11.3%Acura RDX1,683– 24.6%17,350– 21.4%Hyundai Santa Cruz1,654– 28.5%13,191– 30.0%Subaru Impreza1,556– 41.1%11,396– 43.0%Ford Escape1,446– 88.2%28,182– 73.4%Toyota C-HR1,384+ 138300.0%6,321+ 632000.0%Subaru Trailseeker1,248new4,761newMazda CX-701,229– 25.0%8,390– 27.7%Genesis G701,076– 7.8%7,729+ 4.1%Lexus RZ947+ 20.8%9,636+ 79.7%Mazda MX-5 Miata925+ 10.1%6,909+ 2.0%Kia EV6712– 60.4%5,429– 39.4%Lexus LX624+ 1.6%5,038+ 3.3%Hyundai Ioniq 9589– 42.0%6,147+ 98.2%Toyota Crown545– 61.2%6,277– 16.9%Toyota GR86512– 48.1%5,182– 30.5%Lexus UX473– 31.9%6,519+ 0.7%Honda Prelude389new2,466newGenesis G80376+ 16.4%2,287– 7.1%Subaru Uncharted320new3,170newLincoln Corsair266– 89.5%8,414– 52.4%Subaru BRZ235+ 6.8%2,020– 4.1%Subaru Solterra197– 86.6%5,472– 42.6%Lexus LC156+ 81.4%1,020+ 6.9%Genesis G90129– 24.6%882– 14.4%Genesis GV60114– 34.9%712– 51.4%Toyota Supra58– 81.4%2,416+ 35.1%Toyota Mirai36+ 5.9%188+ 67.9%Hyundai Ioniq 628– 97.3%1,345– 83.8%Acura TLX6– 99.4%1,102– 79.7%Kia EV36new6newSubaru Legacy5– 99.8%2,206– 85.5%Lexus LS2– 97.1%148– 82.6%Toyota Venza2– 33.3%10– 98.6%
Source: Manufacturers
More Stories
Foxwell NT710: A Practical Diagnostic Tool for Overland & Off-Road Trips
1. When a Warning Light Interrupts a Remote Trail Imagine driving your vehicle along a remote off-road trail. After crossing...
2027 Dodge Durango Invoice Price, Dealer Cost, and What You Should Pay Near You
The 2027 Dodge Durango returns as a fully revised lineup with one significant structural change: the 3.6-liter Pentastar V-6 is...
GM Unveils Major AI and Self-Driving Technology Plans Alongside Next-Generation EV Platform at GM Forward 2026
What if your next Chevrolet Silverado or Cadillac Escalade could get smarter with age, anticipate maintenance problems before they happen,...
Alfa Romeo Giulia Quadrifoglio Roadster Could Become a Stunning One-Off Italian Supercar with 505 Horsepower
What happens when an Italian coachbuilder takes one of the most beautiful sport sedans of the modern era and decides...
BMW Introduces New 3D Navigation System That Combines Maps and Driver Assistance for Smarter Driving
Ever wonder exactly what your car sees when its advanced driver assistance systems are working behind the scenes? BMW is...
Jason Cammisa Tests the Ferrari 12Cilindri Manuale and Finds Out if a Simulated Manual Can Feel Like the Real Thing
Can a Ferrari with a fake manual transmission actually deliver the same excitement as the real thing? That’s a question...