
Poland August 2026: Kia Sportage soars to #2, Chinese up to record 15.9% share

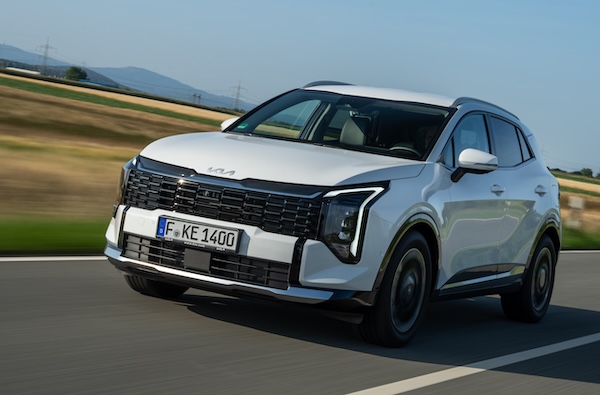
The Kia Sportage sees its sales grow 35.7% year-on-year in August.
45,909 new passenger cars found a buyer in Poland in August, a solid 8.1% year-on-year improvement. At 102,114 units, this is the first time in Polish history that the July-August summer passes the 100,000 mark. The year-to-date volume is now up 9.6% to 414,162. BEV sales are down to a tiny 4.7% share vs. 7.8% a year ago. Toyota (-9.9%) easily keeps the lead of the brands charts despite a YoY loss at 14.2% share, Volkswagen (+44.6%) surges ahead and overtakes Skoda (+2.5%) to snap the 2nd place overall with 8.9% share vs. 7.6% year-to-date. Kia (+27.5%) and BMW (+6.8%) camp on their July ranking and round out the Top 5. Renault (+32.5%) and Dacia (+14.3%) also beat the market in the remainder of the Top 10. Below, BYD (+157%) and Chery (+1186%) both hit ranking records. Chinese carmakers hold a record 15.9% of the Polish market in August, a new record eclipsing the previous best of 15.5% reached just last month.
Over in the models charts, the Toyota Corolla (+0.8%) reclaims the top spot it holds year-to-date with a strong 4.4% share. It distances the Kia Sportage surging 35.7% YoY to #2. Leader last month, the Skoda Octavia (-3.8%) falls to #3 above the Toyota Yaris (+16.8%) up one spot to #4. The Cupra Formentor (+23.3%) and Dacia Duster (+21%) also shine in the remainder of the Top 10.
Previous month: Poland July 2026: Skoda Octavia repeats at #1 above Toyota Corolla, market up 11.8%
One year ago: Poland August 2025: Hyundai breaks records, places Tucson at #1 for the first time
Full August 2026 Top 50 brands and Top 10 models below.
Poland August 2026 – brands:
PosBrandAug-26%/25Jul2026%/25PosFY251Toyota6,52314.2%– 9.9%157,73013.9%– 4.5%112Volkswagen4,0818.9%+ 44.6%331,5367.6%+ 16.1%333Skoda3,9968.7%+ 2.5%242,75810.3%+ 8.3%224Kia2,5705.6%+ 27.5%420,9925.1%+ 0.8%555BMW2,4305.3%+ 6.8%522,1655.4%+ 11.1%446Audi2,0844.5%+ 5.7%918,4874.5%– 1.4%767Mercedes2,0844.5%+ 3.7%618,7884.5%+ 0.6%678Hyundai1,9584.3%– 44.2%717,3434.2%– 13.3%889Dacia1,6713.6%+ 14.3%815,3133.7%+ 9.2%9910Renault1,5943.5%+ 32.5%1212,9753.1%– 3.7%111011BYD1,4523.2%+ 157.0%148,0541.9%+ 186.4%172312MG1,3873.0%+ 16.0%1112,1492.9%+ 37.4%121313Cupra1,1092.4%+ 0.4%159,0722.2%+ 5.3%141514Chery1,1062.4%+ 1186.0%177,5131.8%+ 6160.8%193715Ford9782.1%– 12.0%168,4922.1%– 16.4%161216Omoda9742.1%+ 74.2%189,2012.2%+ 106.5%132117Lexus9512.1%+ 6.4%219,0112.2%– 9.8%151418Peugeot8381.8%+ 42.3%137,6631.9%+ 17.6%181719Jaecoo8371.8%+ 47.4%205,5441.3%+ 53.5%242220Mazda7691.7%+ 84.4%236,8271.6%+ 80.6%202421Volvo7241.6%+ 23.5%1012,9983.1%+ 2.5%101122Opel6191.3%– 0.6%225,5831.3%– 4.7%231823Suzuki5211.1%– 33.8%254,7261.1%– 12.7%252024Citroen4551.0%– 39.9%245,5951.4%– 4.3%221925Fiat4210.9%+ 87.1%262,6630.6%+ 81.8%283226Honda3900.8%+ 21.1%273,9651.0%+ 25.1%272727Nissan3480.8%– 40.1%286,5021.6%– 7.5%211628BAIC2810.6%– 32.9%193,9961.0%+ 28.2%262629Jetour2370.5%new331,8620.4%new34n/a30Leapmotor2340.5%+ 1.7%371,5760.4%+ 95.0%363631Land Rover2030.4%+ 19.4%342,0640.5%+ 12.1%313432Jeep2020.4%– 17.6%321,9830.5%– 1.9%323133Seat1880.4%– 28.0%312,3430.6%– 22.6%292834Mini1790.4%– 49.9%291,9130.5%– 17.1%332935Bestune1670.4%+ 827.8%351,3450.3%+ 5280.0%374336Porsche1550.3%– 31.1%361,8520.4%– 21.8%353037Alfa Romeo1460.3%– 19.3%381,3170.3%– 9.3%383538KGM1320.3%– 29.8%391,1640.3%– 34.8%403339Forthing1240.3%+ 79.7%425070.1%– 1.7%444040Geely1130.2%+ 5500.0%301,1660.3%+ 4384.6%394241GAC830.2%+ 654.5%433550.1%+ 2118.7%494742Mitsubishi830.2%– 61.0%417090.2%– 33.1%433843Tesla700.2%– 71.5%482,3070.6%– 9.1%302544Hongqi650.1%+ 2066.7%444630.1%+ 15333.3%454645JAC620.1%+ 785.7%408020.2%+ 6583.3%414446Xpeng610.1%+ 916.7%473790.1%+ 1048.5%475047DS490.1%+ 25.6%464600.1%+ 30.7%464148Subaru390.1%– 70.9%507170.2%– 24.3%423949Dongfeng350.1%+ 75.0%453770.1%+ 819.5%484550Changan240.1%new491080.0%new50 – –Others1070.2%+ 57.4% –7420.2%+ 186.5% – –
Poland August 2026 – models:
PosModel Aug-26%/25Jul2026%/25PosFY251Toyota Corolla2,0304.4%+ 0.8%216,1203.9%+ 1.8%112Kia Sportage1,2462.7%+ 35.7%310,8102.6%+ 18.0%343Skoda Octavia1,1072.4%– 3.8%114,2633.4%+ 13.2%224Toyota Yaris9942.2%+ 16.8%57,1771.7%– 1.6%775Toyota C-HR8331.8%– 10.1%88,6082.1%– 13.2%636Hyundai Tucson8321.8%– 59.7%68,7832.1%+ 6.3%567Toyota Yaris Cross8161.8%– 29.0%49,1152.2%+ 4.6%458VW T-Roc7951.7%+ 5.4%106,1221.5%– 3.0%989Dacia Duster7371.6%+ 21.0%75,9921.4%+ 3.8%101110Cupra Formentor6891.5%+ 23.3%n/a5,2641.3%+ 22.3%14n/an/aSkoda Kamiq6401.4%+ 15.5%n/a5,2971.3%+ 7.0%1313n/aOmoda 55571.2%+ 61.0%n/a5,3421.3%+ 37.5%12n/an/aSkoda Superb5211.1%+ 48.9%n/a5,2251.3%+ 7.6%1512n/aMG HS4401.0%– 20.1%n/a5,7211.4%+ 25.0%1110n/aVolvo XC603090.7%+ 100.6%96,9881.7%+ 17.4%8n/a
Source: SAMAR


More Stories
When an 80,000-Pound Truck Hits a Car: How Truck Accident Claims Really Work
A collision between a passenger car and an 80,000-pound commercial truck can leave people facing serious injuries, vehicle damage and...
UAW Slams GM’s Massive $20 Billion Stock Buyback as Tensions Rise Over Worker Pay and Benefits
There’s apparently plenty of money to go around at General Motors, but the United Auto Workers union isn’t particularly happy...
Winterising the Home Workshop: Maintaining Garage Access and Warmth During Cold Snaps
A little winter prep goes a long way toward saving you time, protecting your tools, and keeping your weekend wrenching...
Dream Drives to Earn Your Licence For: UK Road Trips for New Drivers
UK road trips for new drivers turn a fresh licence into a first great drive. The North Coast 500 covers 516...
2027 Ford Mustang Mach-E Gets More Range, Lower GT Pricing, and a New Off-Road Trail Trim
Ford is giving Mustang Mach-E buyers a little more to think about for 2027, especially those who have been wanting...
Tesla Plans to Sell Cybercab Robotaxis by End of 2026 Despite Federal Safety Investigation
Would you buy a car that doesn’t have a steering wheel, brake pedal, or even traditional mirrors? Tesla is betting...