
Australia July 2026: Toyota RAV4 #1, Geely EX5 and Zeekr 7X inside Top 10

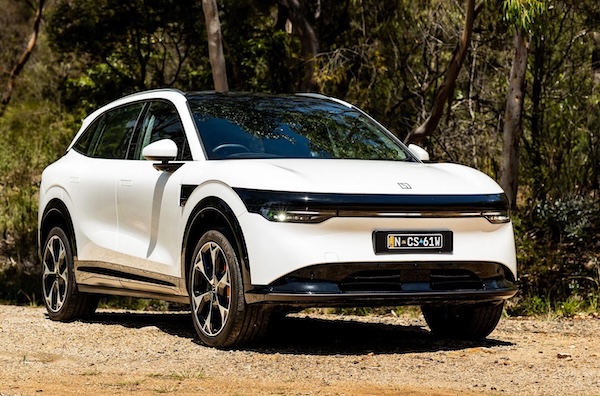
The Zeekr 7X ranks #10 in Australia in July.
It’s another record month for new vehicle sales in July: up 4.2% year-on-year to 108,577, which is an all time high for July, eclipsing the previous best of 104,244 reached just last year. As a result the market also breaks its 7-month record at 740,158 (+1.6%), beating the previous high mark of 725,278 reach in 2024. Once again one of the big stories on the month is the surge of BEV sales: after growing 143.7% YoY in June, they are up an even more impressive 225.7% this month to 22,510 and 20.7% share vs. 6.9% a year ago. Although it is not as high as the record 23.3% reached last month, it is still the 2nd best result in Australian history after hitting 11.8% in February, 14.6% in March, 16.4% in April and 19.9% in May. Meanwhile, handicapped by high prices petrol sales fall a ghastly -30.2% to just 27,894 and 25.7% share (-24.7% to 217,849 YTD), diesel is down -21.6% to 24,773 and 22.8% share (-15.3% to 183,933 YTD), HEVs edge up 5.2% to 18,684 and 17.2% share (+10.8% to 123,548 YTD) and PHEVs soar 157% to 10,359 and 9.5% share (+118% to 64,615 YTD).
The Geely EX5 ranks #9 in Australia in July.
Private sales grow 4.9% to 55,568, fleets edge down -0.6% to 37,395, sales to rental companies drop -15.5% to 5,153 and government sales sink -21.4% to 2,183. This excludes Tesla, Polestar and heavy commercial vehicles. SUVs continue to ride far ahead at +13.6% to 72,409 and 66.7% share vs. 61.1% a year ago and 56.7% in July 2024, light commercials fall a harsh -14.4% to 19,207 and 17.7% share vs. 21.5% in July 2025 and 21.2% two years ago, passenger cars contain their fall to -5.8% to 13,604 and 12.5% share vs. 13.9% last year and 18.2% in 2024, and heavy commercials hold 3.1% share at 3,357 sales. Excluding Polestar and Tesla, all states and territories bar three are up this month. New South Wales is up 2.1% to 31,597 sales, Victoria up 1.4% to 27,874, Queensland down -5.2% to 21,628, Western Australia up 9.3% to 12,014, South Australia down -4.7% to 6,505, Tasmania up 4.8% to 1,622, Australian Capital territory up 6.8% to 1,539 and Northern Territory down -16.2% to 877. Looking at country of origin, China is up a stunning 93% to 38,555 and 35.5% share, followed by Japan at 26,292 (-14.8%)m Thailand at 17,604 (-14.5%), South Korea at 11,622 (-11.8%) and Germany at 4,291 (-12.4%).
The Toyota RAV4 is #1 in Australia for the 2nd time this year.
In the brands ranking, after a freak month that saw BYD just 243 sales off Toyota, we return to some kind of normalcy in July. Despite falling -6% year-on-year, Toyota records its first 20,000+ sales month for the first time since August 2025 and its highest share this year so far at 18.8%. BYD (+70.5%) continues to surge year-on-year and ranks #2 for the 4th straight month, however seeing its share fall back to a more reasonable 7.2%, its lowest since last March. Worryingly, the next four carmakers drop by double-digits, with Mazda (-13.3%) the hardest hit followed by Ford (-12.1%), Kia (-11.5%) and Hyundai (-10.4%). In contrast Tesla soars 421% to #7 and 4.4% share. Chery (+46.6%) is back up to its record ranking at #8 (also reached last April) and breaks its volume best for the 18th straight month (!) at 4,615. GWM (-4.3%) and MG (+45%) also fit within the Top 10 as it has been the case recently. Just outside, Geely (+652%) posts an extravagant YoY lift and smashes all its records at #11 with 3,685 sales and 3.4% share (previous best #13, 3,507 sales and 2.5% share). Another Chinese brand reaching all time highs this month is Zeekr, up 2837.5% YoY to #17 with 2,115 sales and 1.8% share (previous best #20, 1,954 sales and 1.4% reached last month). Zeekr now outsells such established brands as Volkswagen, Nissan, BMW and Honda. Chinese GAC lands at #25 with 0.9% share.
The Toyota Hilux outsells the Ford Ranger for the first time since last October.
Model-wise, the Toyota RAV4 (+26%) sees the supply of its new generation improve to reach the top spot for the second time this year alongside last April, it’s also its highest volume and share so far in 2026. Toyota says 40% of the RAV4 volume this month comes from the PHEV variant. The Toyota Hilux (+1%) also lodges its first YoY improvement since last March to climb back to 2nd place and outsells its archenemy the Ford Ranger (+2.8%) for the first time since last October. #1 last month with record volumes, the Tesla Model Y (+736.8%) is down to a still fantastic third place. Another excellent showing for the BYD Sealion 7 (+78.6%) at #5 ahead of the Chery Tiggo 4 (+4.4%) back up to #6. The Geely EX5 (+315.1%) and new Zeekr 7X spectacularly break into the Top 10 for the first time at #9 and #10 respectively. Meanwhile the Jaecoo J5 is up to #15 and the Geely Starray up to #25.
Complete models data will be uploaded to this article when made available to us.
Previous month: Australia June 2026: BYD at 13.5% share, only 243 sales off Toyota in all-time record market
One year ago: Australia July 2025: GWM, Chery at all time high in record market
Full July 2026 Top 60 All brands and Top 50 models below.
Australia July 2026 – brands:
PosBrandJul-26%/25Jun2026%/25PosFY251Toyota 20,40918.8%– 6.0%1115,55015.6%– 19.0%112BYD7,8577.2%+ 70.5%260,1928.1%+ 115.3%283Kia 6,5536.0%– 11.5%548,3996.5%+ 0.5%444Mazda 6,4585.9%– 13.3%746,9606.3%– 16.7%535Ford 6,4005.9%– 12.1%348,6966.6%– 10.8%326Hyundai 5,9915.5%– 10.4%645,5816.2%– 0.1%657Tesla4,7784.4%+ 421.0%428,3663.8%+ 88.3%9158Chery4,6154.3%+ 46.6%1029,5794.0%+ 71.3%8139GWM4,5184.2%– 4.3%834,8774.7%+ 16.6%7710MG4,2843.9%+ 45.0%927,4303.7%+ 11.4%111011Geely3,6853.4%+ 652.0%1314,6552.0%+ 527.6%162712Mitsubishi3,0622.8%– 38.6%1227,8643.8%– 27.4%10613Isuzu Ute2,8352.6%– 28.9%1123,3073.1%– 9.9%12914Subaru 2,2812.1%– 30.1%1417,0982.3%– 26.2%131115Mercedes2,2782.1%– 11.3%1815,2952.1%– 6.0%151616Omoda Jaecoo2,1352.0%+ 391.9%1510,9431.5%+ 873.6%193217Zeekr2,1151.9%+ 2837.5%207,9501.1%+ 1423.0%213618Volkswagen1,6001.5%– 33.3%1613,9331.9%– 18.9%181419Nissan1,5911.5%– 40.7%1915,4452.1%– 33.7%141220BMW1,4801.4%– 39.7%1714,0971.9%– 12.8%171721Honda 1,3361.2%+ 15.4%219,4701.3%+ 2.6%201922Suzuki 1,1281.0%+ 0.3%247,8721.1%– 18.5%222023Lexus1,0531.0%– 21.8%227,3521.0%– 15.3%242124LDV1,0381.0%– 6.7%257,4471.0%– 11.9%232225GAC1,0080.9%new –1,0080.1%new39 –26Audi9020.8%– 30.8%236,9720.9%– 14.4%251827Land Rover6910.6%– 3.1%294,3330.6%– 15.1%262328Volvo5100.5%– 2.9%284,1290.6%+ 0.2%272429KGM3830.4%+ 14.3%322,0440.3%– 21.8%343030Mini3740.3%– 23.0%303,1530.4%– 5.3%282531Porsche3370.3%– 23.8%352,4140.3%– 29.1%312632Chevrolet3020.3%– 5.6%332,0740.3%– 8.1%333133Skoda2910.3%– 11.3%312,3980.3%– 3.4%322834Denza2740.3%new272,6930.4%new305735Ram2390.2%– 25.3%341,8400.2%– 7.2%353336Renault1870.2%– 55.6%262,7090.4%– 5.6%292937Fiat1750.2%– 0.6%401,0720.1%– 1.7%383738Foton1580.1%new398730.1%new425139Polestar1430.1%– 37.8%361,3430.2%– 4.3%363540Leapmotor1310.1%+ 204.7%379100.1%+ 158.5%404241Genesis1230.1%– 8.9%388820.1%– 2.0%413942Cupra1200.1%– 14.3%421,2110.2%– 31.0%373443Deepal790.1%+ 97.5%418160.1%+ 487.1%434544JAC570.1%– 44.1%474940.1%– 51.0%444045Peugeot480.0%– 58.3%444750.1%– 43.7%454146Farizon390.0%new432090.0%new49 –47Jeep390.0%– 76.4%493800.1%– 69.3%463848Xpeng330.0%new50570.0%new55 –49Ferrari250.0%+ 19.0%531130.0%– 6.6%514950Alfa Romeo190.0%– 38.7%462150.0%– 31.3%484451GMC170.0%– 64.6%452190.0%+ 85.6%474652Lamborghini170.0%– 19.0%52860.0%– 49.7%534753Maserati140.0%– 26.3%511150.0%– 32.4%504854Aston Martin90.0%+ 350.0%48990.0%– 8.3%525055Bentley90.0%+ 0.0%54830.0%+ 22.1%545256Lotus50.0%+ 66.7% –100.0%– 75.6%585357McLaren40.0%+ 100.0%55230.0%– 43.9%575458Rolls-Royce30.0%– 25.0%56320.0%– 22.0%565559Citroen00.0%n/a –30.0%– 57.1%605660Forthing00.0%new5720.0%new61 –61Jaguar00.0%– 100.0% –70.0%– 98.2%5943
Australia July 2026 – models:
PosModelJul-26%/25Jun2026%/25PosFY251Toyota RAV45,5645.1%+ 26.0%521,1152.9%– 25.8%422Toyota Hilux4,7214.3%+ 1.0%327,3283.7%– 11.7%233Tesla Model Y4,6444.3%+ 736.8%125,0403.4%+ 127.9%3104Ford Ranger4,0423.7%+ 2.8%230,3564.1%– 5.8%115BYD Sealion 72,5482.3%+ 78.6%415,0642.0%+ 190.6%7256Chery Tiggo 42,1562.0%+ 4.4%1115,7942.1%+ 57.0%5117Hyundai Kona2,0961.9%+ 10.1%815,2282.1%+ 15.9%678Toyota Prado2,0821.9%– 11.0%2211,1841.5%– 37.6%1669Geely EX52,0341.9%+ 315.1%128,7901.2%+ 276.4%197810Zeekr 7X1,8921.7%new207,4241.0%new2914611Mazda CX-51,8361.7%+ 0.8%2312,3781.7%– 10.4%12812Isuzu D-Max1,7551.6%– 25.4%714,6632.0%– 10.7%8413Ford Everest1,6971.6%– 30.0%1412,8301.7%– 12.8%10514GWM Haval Jolion1,6621.5%– 1.5%1013,1421.8%+ 22.6%91415Jaecoo J51,6541.5%new177,7671.0%new26 –16Kia Sportage1,5331.4%+ 4.7%1511,1871.5%– 6.9%151517Hyundai Tucson1,4881.4%– 22.3%1612,7241.7%+ 4.4%111218MG ZS1,4811.4%– 5.2%2110,4651.4%– 10.9%181319Toyota Land Cruiser Wagon1,3991.3%– 0.5%297,8501.1%+ 20.5%252820Mitsubishi Triton1,3191.2%– 14.4%1811,6701.6%+ 8.4%141721Mitsubishi Outlander1,2821.2%– 31.4%2412,1891.6%– 8.1%13922BYD Shark 61,2161.1%– 1.4%610,7091.4%– 8.1%171823BYD Atto 21,2141.1%#DIV/0!96,6150.9%#DIV/0!3716824Toyota Corolla1,1911.1%– 39.3%398,5051.1%– 24.9%221625Geely Starray1,1771.1%new315,3910.7%new4015426Chery Tiggo 7 Pro1,0851.0%+ 107.9%326,6740.9%+ 159.5%355827Isuzu MU-X1,0801.0%– 33.9%278,6441.2%– 8.6%212028Toyota Camry1,0791.0%– 6.7%357,4381.0%+ 37.4%283629Toyota Corolla Cross1,0611.0%+ 99.1%407,9281.1%+ 16.2%242730GWM Haval H61,0290.9%– 11.9%268,7591.2%+ 8.4%202631Mazda CX-301,0260.9%– 18.8%307,1861.0%– 3.8%312932Mazda CX-31,0220.9%– 21.0%257,7291.0%– 18.8%272133Subaru Forester9180.8%– 45.2%386,6420.9%– 18.7%362234Mazda BT-509000.8%– 20.5%367,0531.0%– 21.4%322335Toyota Hiace8530.8%– 32.1%347,3031.0%– 20.4%302436Kia Carnival8510.8%– 31.4%376,8600.9%+ 7.0%343037MG 38440.8%+ 74.4%434,7610.6%– 17.5%444238Toyota Yaris Cross8320.8%– 13.2%445,0790.7%– 25.8%413139Kia EV38040.7%+ 220.3%463,4620.5%+ 146.6%n/a10240GWM Cannon/Cannon Alpha7780.7%– 13.7%336,9390.9%+ 87.1%334541Nissan X-Trail7570.7%– 30.9%288,1891.1%– 15.1%231942Chery C5/E5 & Omoda 57550.7%+ 92.6%653,2870.4%+ 6.6%n/a6343MG 4 Urban6660.6%new412,0900.3%newn/a –44Kia EV56500.6%+ 40.7%643,6010.5%+ 11.6%n/a6845Hyundai i306130.6%– 31.4%484,2830.6%– 33.8%473346Suzuki Jimny5750.5%+ 3.4%524,4570.6%– 9.4%464847BYD Sealion 65690.5%– 49.3%135,8810.8%+ 7.0%383948Kia Stonic5600.5%+ 14.5%753,3600.5%– 7.2%n/a5249Kia K45500.5%– 16.4%595,0170.7%+ 58.7%425050Subaru Crosstrek5220.5%– 31.3%494,8210.7%– 28.7%4332
Source: VFACTS
More Stories
Toyota Recalls Nearly 106,000 Land Cruiser SUVs Over Fuel Leak and Potential Fire Risk
Toyota’s legendary Land Cruiser has built its reputation on durability and reliability, but even one of the toughest SUVs on...
Legendary Mercedes-Benz AMG Hammer Could Make a Comeback as HWA Teases Stunning W124 Revival
Some cars earn legendary status through impressive sales figures, while others become icons simply because they were outrageously fast for...
10 Practical Gifts for Truck Owners Who Work Outdoors
Who actually needs another novelty keychain? For someone whose truck doubles as an office, a toolshed, and a lunchroom, the...
Uzbekistan September 2026: Chevrolet falls to 70.2% share, BYD up to 13.4%
The Chazor Champion is BYD’s best-seller in Uzbekistan. The Uzbek new car market is down -5% year-on-year in September to...
2027 GMC Yukon Invoice Price, Dealer Cost, and What You Should Pay Near You
The 2027 GMC Yukon sits at the upper end of the full-size SUV market, with a lineup that runs from...
2027 Honda Civic Invoice Price, Dealer Cost, and What You Should Pay Near You
The Honda Civic has been America’s best-selling compact car for decades, and the 2027 lineup adds meaningful new content with...