
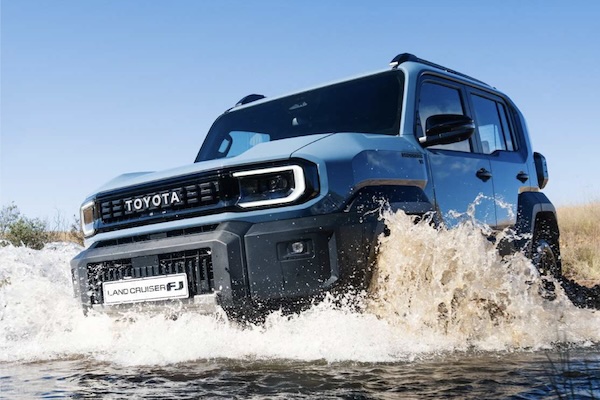
South Africa June 2026: Highest market in 19 years, Toyota Land Cruiser FJ inside Top 50

The Toyota Land Cruiser FJ makes its first appearance in any world ranking.
The South African new vehicle market lodges a 20th consecutive month of year-on-year gain in June at +15.3% to 54,482 units. This is also the 5th straight month of double-digit YoY lifts. This month market the best June volume in 19 years: since 2007. The year-to-date tally halfway through the year stands at 315,303 units, up 12.9% on 2025. Strikingly, the Top 6 manufacturers all trail the market, with GWM (+14%), the VW Group (+12.8%) and Suzuki (+9%) faring best, followed by Toyota (+6.2%) and Hyundai (+2.8%) whereas Ford (-3.2%) is actually down. Chery (+23.8%) shines at #7 but once again it’s Jetour (+200.7%) that delivers the performance of the month, beating its monthly volume record for an incredible 17th straight time (every month since its launch) at 2,054. Newcomer BYD advances to a record 15th position.
Over in the models charts, the Toyota Hilux (+14.1%) scores a 17th consecutive month at #1 with 6.4% share, distancing the VW Polo Vivo (+22.1%), Ford Ranger (-7.2%) and Chery Tiggo 4 (+34.6%), making the Top 4 unchanged on last month. The Isuzu D-Max (+2.7%) is back up six spots on May to #5 ahead of the Hyundai Grand i10 (+9.6%) and GWM Haval Jolion (+27.6%). The Toyota Urban Cruiser (+63.1%) soars from outside the May Top 50 directly into 10th place, with the Suzuki Ertiga (+36.9%) also in great shape at #11. The new Jetour T2 falls to #15 after hitting its first Top 10 finish last month. Finally the new Toyota Land Cruiser FJ directly breaks into the Top 50 at #50, in what is its first appearance in any world ranking.
Previous month: South Africa May 2026: Jetour breaks records, places T2 inside Top 10 for the first time
One year ago: South Africa June 2025: 4th straight double digit market gain (+18.7%)
Full June 2026 Top 47 All manufacturers and Top 50 models below.
South Africa June 2026 – manufacturers:
PosManufacturerJun-26%/25May2026%/25PosFY251Toyota12,41722.8%+ 6.2%170,65322.4%+ 4.0%112Suzuki5,68910.4%+ 9.0%234,61711.0%+ 0.5%223Volkswagen Group5,61310.3%+ 12.9%330,9659.8%+ 5.4%334Hyundai2,9865.5%+ 2.8%418,3395.8%+ 1.3%445Ford2,9615.4%– 3.2%517,0295.4%+ 3.6%556GWM (incl. Haval)2,6084.8%+ 14.0%615,6105.0%+ 31.9%667Chery2,6024.8%+ 23.8%714,5934.6%+ 24.9%788Isuzu2,1213.9%+ 1.6%1012,3013.9%+ 0.7%879Jetour2,0543.8%+ 200.7%810,8693.4%+ 228.8%91510Mahindra1,6693.1%+ 12.5%910,1433.2%+ 5.5%101011Kia1,4162.6%+ 15.1%139,2502.9%+ 12.3%11912Omoda and Jaecoo1,4162.6%+ 40.3%118,3112.6%+ 62.4%121413Renault1,3262.4%+ 0.6%148,0282.5%– 1.8%131114BMW Group1,3142.4%– 2.6%127,9482.5%+ 5.6%141315BYD8001.5%new172,8420.9%new21 –16Nissan7791.4%– 34.2%166,2672.0%– 20.1%151217Stellantis7321.3%+ 13.0%154,1411.3%+ 28.4%161618Tata PC6141.1%new182,2690.7%new22 –19Foton5201.0%+ 97.0%213,0521.0%+ 132.4%201920FAW Trucks5040.9%+ 12.0%193,0611.0%+ 18.9%191821Mercedes4910.9%– 10.1%203,1031.0%+ 2.0%181722MG4610.8%new223,2321.0%new172423JAC3280.6%+ 49.1%231,8550.6%+ 42.6%232224Scania3120.6%+ 45.8%291,1020.3%+ 0.0%302725Daimler Trucks2490.5%– 12.0%241,5590.5%– 8.9%242026Mazda2120.4%+ 29.3%281,2840.4%– 4.3%272327Changan2040.4%new308190.3%new334128Volvo Group2030.4%+ 0.0%271,0430.3%+ 11.6%312929BAIC2000.4%– 13.8%311,1570.4%– 15.4%282630Honda1910.4%+ 25.7%331,4350.5%+ 27.6%252531UD Trucks1820.3%– 7.6%261,1320.4%+ 8.4%292832Man1690.3%+ 67.3%328000.3%+ 15.3%343133Jaguar Land Rover1550.3%– 47.1%251,3630.4%– 12.1%262134Mitsubishi1350.2%– 34.1%341,0040.3%– 1.7%323035LDV1210.2%new352520.1%new41 –36Porsche1210.2%+ 28.7%366190.2%+ 6.4%353337Volvo Cars1140.2%+ 119.2%395300.2%+ 14.0%373438Sinotruk1120.2%+ 15.5%375680.2%+ 51.1%363639Tata1000.2%+ 42.9%403640.1%– 13.3%393540Powerstar780.1%– 18.8%385170.2%– 9.3%383241Subaru470.1%+ 56.7%412170.1%– 8.4%423742Iveco430.1%+ 48.3%451980.1%– 2.5%433943VECV South Africa420.1%+ 100.0%422620.1%+ 111.3%404044Babcock320.1%+ 128.6%431870.1%+ 81.6%444245Shacman320.1%new441560.0%new454346Ferrari (Scuderia)60.0%n/a47320.0%+ 14.3%474447Proton10.0%– 97.6%46420.0%– 87.2%4638
South Africa June 2026 – models:
PosModelJun-26%/25May2026%/25PosFY251Toyota Hilux3,4646.4%+ 14.1%118,8226.0%+ 13.9%112VW Polo Vivo2,3954.4%+ 22.1%212,9504.1%+ 14.5%223Ford Ranger2,1503.9%– 7.2%312,4724.0%+ 0.6%334Chery Tiggo 42,0703.8%+ 34.6%411,3223.6%+ 55.2%485Isuzu D-Max1,7243.2%+ 2.7%1110,0683.2%+ 2.3%666Hyundai Grand i101,6273.0%+ 9.6%58,9822.8%+ 5.1%777GWM Haval Jolion1,4242.6%+ 27.6%77,5882.4%+ 18.8%8118Suzuki Swift1,3882.5%– 5.3%610,4693.3%– 12.4%549Toyota Corolla Cross1,3562.5%– 36.4%87,1412.3%– 25.4%9510Toyota Urban Cruiser1,1742.2%+ 63.1%n/a4,0161.3%– 5.4%261411Suzuki Ertiga1,1502.1%+ 36.9%165,0101.6%+ 15.2%191912Suzuki Fronx1,0922.0%– 1.8%96,8742.2%+ 6.3%101013Toyota Starlet9681.8%+ 13.6%126,4802.1%– 11.6%11914Toyota Vitz9211.7%+ 16.0%146,2182.0%+ 75.2%121615Jetour T29181.7%new104,9421.6%new16n/a16Omoda C59011.7%+ 30.0%155,2191.7%+ 45.1%142117VW Polo8641.6%+ 14.3%174,7471.5%– 1.3%181718Mahindra XUV3X08161.5%+ 71.1%214,4391.4%+ 28.4%222319Toyota Fortuner7261.3%– 17.3%234,0921.3%– 3.5%232020Mahindra Scorpio Pik Up7011.3%– 18.5%224,6601.5%– 8.2%171821Toyota Hiace6561.2%+ 10.1%243,6601.2%– 1.4%252222VW T-Cross6191.1%+ 5.3%252,9620.9%– 5.1%292423GWM P-Series5651.0%+ 54.0%183,6471.2%+ 78.3%242924Toyota Rumion5611.0%+ 49.6%204,1981.3%+ 58.9%212725Jetour Dashing5311.0%+ 42.4%422,2220.7%+ 15.1%403426Tata Tiago5140.9%new331,6940.5%newn/a –27Renault Kwid5050.9%– 15.4%302,4430.8%– 20.9%362528Renault Triber4980.9%n/a372,9160.9%n/a273729VW Amarok4970.9%+ 40.4%322,5010.8%+ 47.1%343630Nissan Magnite4820.9%– 37.7%264,2491.3%– 15.6%201531Toyota Land Cruiser 704650.9%– 24.4%282,7960.9%– 8.5%302632Hyundai i204510.8%+ 62.2%312,8600.9%+ 47.9%283833Hyundai Exter4050.7%– 7.5%452,2500.7%– 4.9%393234Jetour T13980.7%new292,4710.8%new31n/a35Toyota Starlet Cross3980.7%– 39.4%134,7271.5%– 9.0%131336GWM Haval H63890.7%– 14.7%352,4080.8%+ 28.0%323137Suzuki DZire3890.7%n/a41n/an/an/an/an/a38Ford Everest3800.7%+ 24.2%n/an/an/an/an/an/a39Chery Tiggo 73650.7%– 9.0%362,1730.7%– 12.5%423540Suzuki Baleno3550.7%– 1.4%342,2930.7%– 5.3%372841Toyota RAV43550.7%n/an/an/an/an/an/an/a42BMW X33430.6%+ 1.2%n/an/an/an/an/an/a43Ford Territory3430.6%+ 19.9%272,2570.7%+ 37.7%383944Toyota Prado3070.6%n/a382,3220.7%n/a33n/a45Suzuki Across2980.5%n/an/an/an/an/an/an/a46Nissan Navara2940.5%– 27.0%431,9650.6%– 25.3%n/a3047Renault Kiger2720.5%– 38.0%392,2140.7%– 13.5%413348Suzuki Eeco2720.5%n/a47n/an/an/an/an/a49Peugeot Landtrek2670.5%n/an/an/an/an/an/an/a50Toyota Land Cruiser FJ2640.5%new –2640.1%newn/a –
Source: NAAMSA

More Stories
Toyota Recalls Nearly 106,000 Land Cruiser SUVs Over Fuel Leak and Potential Fire Risk
Toyota’s legendary Land Cruiser has built its reputation on durability and reliability, but even one of the toughest SUVs on...
Legendary Mercedes-Benz AMG Hammer Could Make a Comeback as HWA Teases Stunning W124 Revival
Some cars earn legendary status through impressive sales figures, while others become icons simply because they were outrageously fast for...
10 Practical Gifts for Truck Owners Who Work Outdoors
Who actually needs another novelty keychain? For someone whose truck doubles as an office, a toolshed, and a lunchroom, the...
Uzbekistan September 2026: Chevrolet falls to 70.2% share, BYD up to 13.4%
The Chazor Champion is BYD’s best-seller in Uzbekistan. The Uzbek new car market is down -5% year-on-year in September to...
2027 GMC Yukon Invoice Price, Dealer Cost, and What You Should Pay Near You
The 2027 GMC Yukon sits at the upper end of the full-size SUV market, with a lineup that runs from...
2027 Honda Civic Invoice Price, Dealer Cost, and What You Should Pay Near You
The Honda Civic has been America’s best-selling compact car for decades, and the 2027 lineup adds meaningful new content with...