
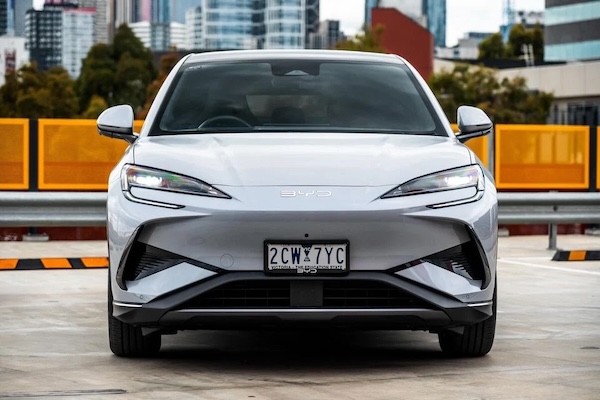
Australia June 2026: BYD at 13.5% share, only 243 sales below Toyota in all-time record market
BYD sold almost 19,000 units in Australia in June.
It’s a very eventful month in Australia, with June volumes are up 9.9% year-on-year to 140,058 units. This is the highest ever monthly tally in the country, eclipsing the previous best of 134,171 reached 9 years ago in June 2017. The year-to-date result halfway through the year is up 1.2% to 631,581, the second highest mark at this stage of the year just below 2024 (632,412). Once again BEV sales are the big story of the month, up a whopping 147.3% year-on-year to 32,570 and a record 23.3% share. This is the fifth straight month BEVs reach a record share after hitting 11.8% in February, 14.6% in March, 16.4% in April and 19.9% in May. Meanwhile petrol is down -29% to 34,717 and 26.5% share, diesel falls -18.4% to 31,789 and 24.2% share, Hybrids are up 35% to 20,741 and 15.8% share and PHEVs soar 158% to 16,068 and 12.3% share.
Big surprise in the brands ranking: BYD (+131.5%), helped by a shipment of 5,000 new cars from a ship it own, ends the month only 243 sales below long term leader Toyota (-5.4%). The Chinese carmaker sees its record volume jump from 8,211 last month to a huge 18,881 in June and its record share fly off from 8.2% last April to 13.5% this month. BYD admitted the potentially freak event is unlikely to be repeated for some time. BYD was the best-selling brand in Victoria, Queensland, Tasmania and the Australian Capital Territory last month. For context, looking at the best performance of other strong selling brands in recent years, we have Toyota at a record 24,546 in June 2017, Holden at 17,120 in June 2003, Mazda at 12,501 in June 2017, Hyundai at 12,300 in June 2016 and Ford at 10,103 in June 2025.
But BYD isn’t the only record-breaker in June. Just below Ford (-9.1%), Tesla surges 88.9% year-on-year to reach an all time high 4th place with 8,670 sales and 6.2% share, all records. Its previous best was #6 in June 2023, March 2024 and May 2026, 7,018 sales in June 2023 and 6% share just last month. Kia (+2.5%) stays at #5 but Hyundai (-11%) drops two spots on May to #6. Mazda (-22.7%) implodes and repeats at #7, its lowest ranking in at least 15 years. Chinese fares GWM (+11.7%), MG (+28.4%) and Chery (+49%) all fit within the Top 10 again, with the latter breaking its volume record for staggering 17th month in a row at 4,505.
Model-wise, the Tesla Model Y (+133.5%) spectacularly repeats at #1 and soars to above 8,000 sales and 5.8% share for the month. To put this into context, the record volumes for the Ford Ranger (7,767 in December 2023), Toyota Hilux (7,582 in June 2022) and Toyota RAV4 (6,712 in August 2024) are all below what the Model Y achieved this month… The three models however managed higher record shares, with the Ranger at 7.9%, Hilux at 7.6% and the RAV4 at 6.7%, all on the same months as their volume bests. BYD places three models inside the Top 10 for the first time: the Sealion 7 (+163.5%) is up 10 spots on May to #4, the Shark 6 (+13.5%) up 13 to #6 and the new Atto 2 up 31 to #9 for its first ever Top 10 finish in Australia.
Previous month: Australia May 2026: BEVs at record 19.9% share, Tesla Model Y #1, Jaecoo J5 #7
One year ago: Australia June 2025: BYD up to #5, China-built at 23% share
Full June 2026 Top 10 brands and Top 10 models below.
Australia June 2026 – brands:
PosBrandJun-26%/25May2026%/25PosFY251Toyota 19,12413.7%– 5.4%195,14115.1%– 21.4%112BYD18,88113.5%+ 131.5%252,3358.3%+ 124.1%283Ford 9,1816.6%– 9.1%342,2966.7%– 10.6%324Tesla8,6706.2%+ 88.9%623,5883.7%+ 66.7%10155Kia 8,0055.7%+ 2.5%541,8466.6%+ 2.7%446Hyundai 7,4805.3%– 11.0%439,5906.3%+ 1.6%657Mazda 7,2785.2%– 22.6%740,5026.4%– 17.2%538GWM6,1044.4%+ 11.7%830,3594.8%+ 20.5%779MG5,0013.6%+ 28.4%1023,1463.7%+ 6.8%111010Chery4,5053.2%+ 49.0%924,9644.0%+ 76.8%813
Australia June 2026 – models:
PosModelJun-26%/25May2026%/25PosFY251Tesla Model Y8,0725.8%+ 133.5%120,3963.2%+ 95.5%3102Ford Ranger5,9994.3%– 4.7%226,3144.2%– 7.1%113Toyota Hilux5,1753.7%– 16.5%322,6073.6%– 13.9%234BYD Sealion 74,7303.4%+ 163.5%1412,5162.0%+ 233.2%n/a255Toyota RAV44,1152.9%+ 70.0%415,5512.5%– 35.3%426BYD Shark 63,3982.4%+ 13.5%199,4931.5%– 8.9%n/a187Isuzu D-Max2,7402.0%– 12.2%912,9082.0%– 8.2%748Hyundai Kona2,5051.8%+ 0.8%513,1322.1%+ 16.8%679BYD Atto 22,4821.8%new405,4010.9%newn/a16810GWM Haval Jolion2,4461.7%+ 22.3%1311,4801.8%+ 27.1%n/a1411Chery Tiggo 42,3291.7%+ 31.7%813,6382.2%+ 70.6%511
Source: VFACTS
More Stories
Honda Civic Si Production Is Pausing After 2026 but a New Si Is Still Coming
Honda is putting the Civic Si on pause after the 2026 model year, but this is not a full goodbye...
Honda Confirms Third-Gen Ridgeline Pickup With Rugged Redesign Coming Within Two Years
Honda has officially confirmed that the Ridgeline will live on with a third-generation model, ending recent uncertainty around the future...
Next Cadillac CT5-V Will Get a Naturally Aspirated V8 and Manual Transmission
The Cadillac CT5-V rumor mill is spinning again, this time without the help of a supercharger as this latest development...
How Long-Haul Truck Drivers Can Find Reliable Fuel Stops Faster
For long haul truck drivers, every mile really matters. Like, a wellplanned route can cut fuel costs, save some driving time...
What to Check Before Buying a Nissan in 2026
Buying a Nissan in 2026 should start with the way the vehicle will be used every week: commuting distance, parking...
Mercedes-Benz Faces Possible U.S. Sales Ban Threat Under Senate China Vehicle Bill
Mercedes-Benz has unexpectedly found itself caught in the middle of Washington’s latest push to restrict Chinese influence in the U.S....