
Australia March 2026: BYD first Chinese on monthly podium, BEVs (+88.9%) at record 14.6% share
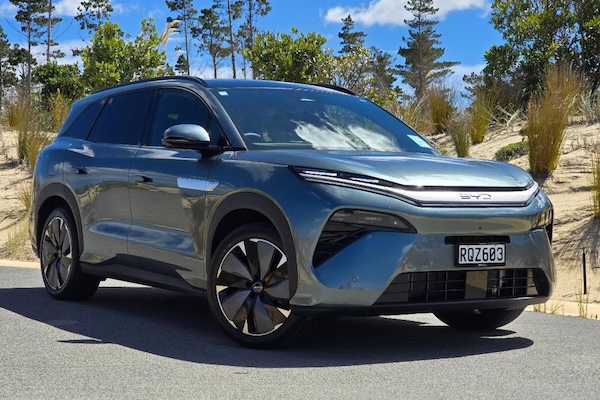
BYD is up to a record third place in March. The Sealion 08 is the #1 recent launch.
The Australian new vehicle market is off -2.6% year-on-year to 108,703 in March on what was a new March record in 2025. The year-to-date tally over Q1 is down -1.8% to 290,598. This month we are starting to see the consequences of the Middle Eastern war and inflated fuel prices. Sales by alimentation show petrol sales sinking -20.8% to 34,694 and diesel down -10.1% to 28,364. Reversely hybrids are up 6.7% to 17,953, BEVs rise 88.9% to 15,839 and a record 14.6% share vs. 7.5% a year ago in March 2025 and PHEVs gain 18.5% to 8,215. BEV share over Q1 stands at 11.8%. Private sales are down -4.8% to 52,176, business fleets off -2.7% to 40,296, rentals up 23.6% to 6,714 and government fleets down -20.9% to 2,234.
SUVs gain 2.5% to 69,258 and 63.7% share vs. 60.6% in March 2025 and 58.9% two years ago but light commercials drop -10.5% to 21,990 and 20.2% share vs. 22% last year and 21% in 2024, passenger cars fall -9.9% to 13,817 and 12.7% share vs. 13.7% in 2025 and heavy commercials gain 5.5% to 3,638 and 3.3% share vs. 3.1% last year. Excluding Tesla and Polestar sales, all states and territories are down this month bar Queensland up 3.9% to 22,812. New South Wales is down -5.9% to 31,513, Victoria down -2.5% to 28,791, Western Australia down -7.3% to 11,202, South Australia down -7.3% to 6,622, Tasmania down -1.7% to 1,744, Australian Capital Territory down -4.7% to 1,579 and Northern Territory off -17.3% to 795. Looking at sales by country of origin, China (+45.1%) cements its newfound dominance with 30,993 sales ahead of Japan (-20.4% to 26,892), Thailand (-7.1% to 20,251), South Korea (-1.8% to 13,055) and Germany (-10.2% to 4,513).
There is a big reshuffle in the brands ranking. Toyota (-19.3%) continues to underperform at 15.2% share. This is still well above twice any other carmaker in the country. Kia (+0.2%) is stable year-on-year but climbs to a record 2nd place, also hit in June 2022 and September 2022. The event of the month is the best-ever third place of BYD (+50%) with 6.6% share and just 103 sales below Kia. This is the first time a Chinese manufacturer enters the monthly Australian podium. Mazda (-10.6%) and Ford (-13.2%) both struggle and are relegated to #4 and #5 respectively. GWM (+29.3%) is back to #7 and ascends to a record volume (5,680) and share (5.2%). For its part Chery (+84.1%) ranks #10 and manages an unbelievable 14th straight month of record volumes at 4,018. Tesla is up 23.2% to #13, Geely up 542.6% to #20 and Zeekr up 533% to #27.
Model-wise, the Ford Ranger (-9.7%) keeps the lead but falls heavily, it is followed like last month by the Toyota Hilux (+2.1%) and Tesla Model Y (+63.4%). The Model Y is now up to #8 year-to-date vs. #10 over the Full Year 2025. Boosted by promotions on the outgoing generation and demo sales of the new model, the Nissan X-Trail (+25.3%) surges 40 spots on February to #4, the nameplate’s new ranking record eclipsing its previous best of #6 reached in September 2018 and February 2024. The Hyundai Kona (+15.2%) is strong at #6 followed by the Chery Tiggo 4 (+80.4%) down three spots on last month to #7 but staying #3 year-to-date. Notice also the BYD Sealion 7 (+243.8%) up to #11. Still handicapped by a lengthy generation changeover, the Toyota RAV4 (-68.5%) ranks #20 both for the month and YTD. The BYD Sealion 8 is the best-selling recent launch at #35 above the Zeekr 7X (#42), Geely Starray (#46) and BYD Atto 2 (#49).
Previous month: Australia March 2026: China becomes #1 source country, Toyota off -27.8% to lowest share in 3 years
One year ago: Australia March 2025: BYD #1 Chinese brand, BEVs down -19.9%
Full March 2026 Top 58 All brands and Top 50 models below.
Australia March 2026 – brands:
PosBrandMar-26%/25Feb2026%/25PosFY251Toyota 16,57415.2%– 19.3%144,49015.3%– 23.0%112Kia 7,3206.7%+ 0.2%420,6307.1%+ 4.5%343BYD7,2176.6%+ 50.0%617,5416.0%+ 100.1%684Mazda 7,1566.6%– 10.6%221,8907.5%– 12.9%235Ford 7,1496.6%– 13.2%320,1726.9%– 5.7%426Hyundai 6,9796.4%+ 2.4%519,1016.6%+ 4.5%557GWM5,6805.2%+ 29.3%814,8785.1%+ 28.5%778Mitsubishi5,0014.6%– 31.2%714,1034.9%– 26.0%869MG4,2183.9%+ 7.4%1210,5953.6%– 7.1%101010Chery4,0183.7%+ 84.1%911,7364.0%+ 93.8%91311Nissan3,7153.4%– 8.9%167,3612.5%– 31.0%131212Isuzu Ute3,5253.2%+ 0.5%109,8383.4%+ 7.9%11913Tesla3,4853.2%+ 23.2%117,2602.5%+ 40.7%141514Subaru 2,6912.5%– 15.9%137,6832.6%– 20.3%121115BMW2,4302.2%– 1.1%176,1862.1%+ 9.9%161716Mercedes2,1532.0%– 14.9%146,4452.2%+ 3.0%151617Volkswagen1,8801.7%– 30.4%155,9052.0%– 18.0%171418Honda 1,5191.4%– 13.9%184,1861.4%– 1.3%181919Suzuki 1,3311.2%– 21.9%203,1931.1%– 28.5%202020Geely1,2081.1%+ 542.6%212,8211.0%+ 1400.5%222721LDV1,1391.0%– 6.3%193,2641.1%– 8.3%192222Lexus1,1261.0%– 13.1%232,8341.0%– 14.6%212123Omoda Jaecoo1,0100.9%new242,5160.9%new243224Audi9320.9%– 24.5%222,6500.9%– 21.9%231825Land Rover9070.8%– 2.6%271,7070.6%– 13.0%272326Volvo7600.7%+ 4.8%261,8060.6%– 5.1%262427Zeekr7090.7%+ 533.0%251,8320.6%+ 768.2%253628Mini5430.5%– 11.1%281,3700.5%– 1.7%282529Skoda4200.4%– 8.5%301,1110.4%+ 1.0%292830Renault3450.3%– 11.1%319820.3%– 15.6%312931Denza3180.3%new326270.2%new365732Porsche3000.3%– 35.9%291,0670.4%– 26.2%302633Chevrolet2960.3%– 17.8%338300.3%– 17.6%323134Ram2680.2%+ 0.8%348110.3%+ 5.6%333335KGM2450.2%– 35.2%356920.2%– 37.9%343036Cupra2270.2%– 45.4%366440.2%– 18.3%353437Fiat2120.2%+ 6.5%414080.1%– 23.3%383738Leapmotor1700.2%+ 95.4%452770.1%+ 100.7%424239Polestar1600.1%– 12.1%374650.2%+ 19.5%373540Genesis1310.1%+ 8.3%383790.1%+ 12.8%393941Foton1090.1%new403280.1%new405142Peugeot1020.1%– 38.9%422520.1%– 32.4%434143JAC820.1%– 29.9%393030.1%– 42.3%414044Deepal630.1%new432330.1%new444545Jeep580.1%– 69.5%441910.1%– 64.8%453846GMC350.0%new461060.0%new464647Alfa Romeo310.0%– 29.5%47960.0%– 19.3%474448Farizon250.0%new53450.0%new50 –49Ferrari200.0%– 39.4%49540.0%– 6.9%494950Aston Martin160.0%– 30.4%51380.0%– 30.9%525051Bentley150.0%+ 25.0%50420.0%+ 31.3%515252Maserati110.0%– 75.6%48540.0%– 38.6%484853Lamborghini60.0%– 78.6%52310.0%– 62.2%534754McLaren30.0%– 66.7%56100.0%– 50.0%555455Lotus20.0%– 60.0% –30.0%– 81.3%575356Citroen20.0%n/a –20.0%– 60.0%585657Rolls-Royce10.0%– 75.0%54140.0%– 26.3%545558Jaguar00.0%– 100.0%5570.0%– 95.4%5643
Australia March 2026 – models:
PosModelMar-26%/25Feb2026%/25PosFY251Ford Ranger4,4524.1%– 9.7%112,1804.2%– 7.9%112Toyota Hilux4,1673.8%+ 2.1%210,5923.6%– 3.7%233Tesla Model Y2,8182.6%+ 63.4%35,8972.0%+ 89.4%8104Nissan X-Trail2,4382.2%+ 25.3%443,7611.3%– 17.5%21195Mitsubishi Outlander2,3182.1%– 22.9%76,3632.2%– 14.9%496Hyundai Kona2,3162.1%+ 15.2%86,1782.1%+ 18.8%677Chery Tiggo 42,2582.1%+ 80.4%46,8072.3%+ 103.9%3118Isuzu D-Max2,1672.0%+ 3.8%66,0572.1%– 2.2%749Hyundai Tucson2,0421.9%+ 11.5%125,4761.9%+ 15.6%121210GWM Haval Jolion2,0131.9%+ 28.4%105,6061.9%+ 34.8%91411BYD Sealion 71,9701.8%+ 243.8%164,4681.5%+ 512.1%152512Mitsubishi Triton1,9221.8%– 1.6%95,6041.9%+ 21.9%101713MG ZS1,8961.7%– 6.1%154,5001.5%– 9.1%141314Mazda CX-51,8591.7%+ 7.2%56,2472.1%+ 12.8%5815Toyota Prado1,8501.7%– 35.6%184,5151.6%– 46.5%13616Ford Everest1,8051.7%– 14.0%115,4961.9%+ 10.2%11517Toyota Corolla Cross1,6871.6%+ 38.3%303,6101.2%+ 12.4%222718GWM Haval H61,6651.5%+ 20.7%213,8441.3%+ 20.1%192619Kia Sportage1,6521.5%– 10.6%134,3221.5%– 22.8%171520Toyota RAV41,3621.3%– 68.5%353,8421.3%– 72.2%20221Isuzu MU-X1,3581.2%– 4.4%173,9611.4%+ 35.7%182022BYD Shark 61,3141.2%– 53.2%253,4801.2%– 28.0%241823Toyota Corolla1,2591.2%– 17.6%144,3901.5%– 6.0%161624Toyota Hiace1,2461.1%– 16.5%193,4131.2%– 6.6%252425Toyota Camry1,1971.1%+ 52.1%203,2251.1%+ 83.4%273626Mazda CX-301,1851.1%+ 32.7%263,2461.1%+ 6.0%262927Subaru Forester1,1641.1%+ 7.5%292,9791.0%– 7.1%312228Mazda CX-31,1611.1%– 4.8%223,4891.2%– 19.6%232129Toyota Land Cruiser Wagon1,1231.0%+ 464.3%322,8571.0%+ 216.0%322830GWM Cannon/Cannon Alpha1,1001.0%+ 115.5%243,1311.1%+ 456.1%294531Mazda BT-509990.9%– 21.8%233,1131.1%– 19.5%302332Kia Carnival9770.9%+ 6.7%313,1611.1%+ 31.6%283033Subaru Crosstrek8850.8%+ 1.3%272,5720.9%– 11.5%343234Kia Seltos8490.8%+ 13.8%362,1320.7%– 2.2%383835BYD Sealion 88360.8%new541,5620.5%newn/a –36Kia K47840.7%+ 70.8%282,7711.0%+ 325.0%335037Suzuki Jimny7510.7%– 6.5%371,9580.7%– 12.0%394838Toyota Yaris Cross7230.7%– 39.3%342,4560.8%– 18.5%353139Honda CR-V7140.7%+ 6.7%421,8500.6%+ 11.5%405940Mazda37020.6%– 22.4%452,1380.7%– 31.1%373541Chery Tiggo 7 Pro6980.6%+ 114.1%332,3230.8%+ 227.2%365842Zeekr 7X6790.6%new391,7250.6%newn/a14643Tesla Model 36670.6%– 39.6%531,3630.5%– 33.4%n/a5144Hyundai i306220.6%– 31.1%381,8420.6%– 29.8%n/a3345Geely EX56060.6%+ 222.3%631,4370.5%+ 664.4%n/a7846Geely Starray6020.6%new551,3840.5%newn/a15447BMW X3/iX35940.5%+ 47.0%851,4400.5%+ 73.1%n/a6648Kia EV55870.5%+ 22.8%871,1480.4%– 1.6%n/a6849BYD Atto 25720.5%new731,4810.5%newn/a16850Mitsubishi Pajero Sport5700.5%+ 10.5%601,5670.5%+ 12.2%n/a55
Source: VFACTS

More Stories
Lewis Hamilton and Kim Kardashian Turn Heads at Tokyo Car Meet in a Ferrari F40
Lewis Hamilton knows how to make an entrance, but this one landed on a completely different level. In a social...
Brazil March 2026: BYD Dolphin Mini breaks into Top 10
The BYD Dolphin Mini ranks #9 in Brazil in March. The Brazilian new light vehicle market is euphoric in March,...
Ireland March 2026: Toyota monopolises podium with Corolla, Yaris Cross and C-HR
Toyota C-HR sales are up 73.3% in March in Ireland. 15,476 new cars found a buyer in Ireland in March,...
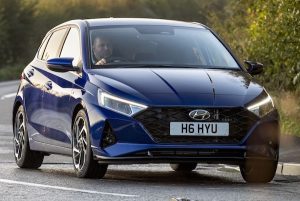
Bulgaria March 2026: Hyundai i20 repeats at #1
The Hyundai i20 is the best-selling vehicle in Bulgaria again. 4,957 new light vehicles were registered in March in Bulgaria,...
Elevating the G63: Why Carbon Widebody Kits Redefine Power and Presence
The Mercedes-Benz G63 W465 has always embodied uncompromised dominance-a boxy icon that turns heads with its raw, militaristic silhouette. But for...
Porsche Teases New 911 Variant for April 14 and It Could Be the Purist Pick of the Lineup
Porsche has once again found a way to keep the 911 conversation interesting, and this latest teaser already has enthusiasts...