
Taiwan March 2026: Tesla Model Y takes the lead with 11.6% share
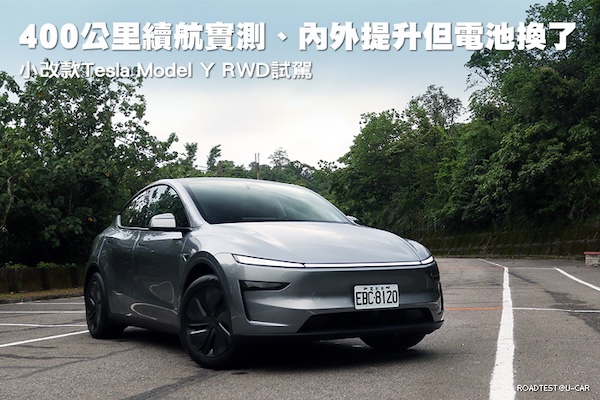
The Tesla Model Y is the best-selling vehicle in Taiwan in March.
39,138 new cars hit Taiwanese roads in March, a 5% year-on-year uptick. As a result the Q1 volume is now off -3.4% to 96,434. This a weak result given Q1 2025 was already down -11.2% on the year prior. Toyota (-10%) disappoints but easily keeps the lead of the brands charts with 27.1% share vs. 30.6% so far this year. Tesla (+313.2%) shoots up to 2nd place with 13.9% share, a new share record eclipsing the 11.7% it hit last December. Honda (+22%) also impresses in third position above Lexus (-4.7%) and CMC (-20.3%) both struggling. In contrast Mazda (+56.1%), Ford (+30.9%) and Mitsubishi (+24.5%) all shine in the remainder of the Top 10.
We have a surprise in the models charts: thanks to new shipments from China, the Tesla Model Y (+1164.6%) takes the overall lead for the second time ever in Taiwan after doing so last December, reaching a record 11.6% share vs. a previous best of 10.8% last December. The entire Top 4 shifts down one spot as a result: the Toyota Corolla Cross (-5.5%) is down to #2, the Toyota RAV4 (-3.6%) down to #3, the CMC J Space (-17.3%) down to #4 and the new Ford Territory to #5. The Toyota Town Ace (-32.7%) is back up three ranks on last month to #6 despite faltering year-on-year. Excellent performances by the Toyota bZ4X (+1550%), Mazda CX-5 (+179.9%) and Honda HR-V (+84.9%).
Previous month: Taiwan February 2026: Foxtron Bria up to #13
One year ago: Taiwan March 2025: CMC (+32.7%), Toyota (+19.8%) defy struggling market
Full March 2026 Top 10 brands and Top 70 models below.
Taiwan March 2026 – brands:
PosBrandMar-26%/25Feb2026%/24PosFY251Toyota10,59027.1%– 10.0%129,48330.6%– 9.1%112Tesla5,42113.9%+ 313.2%n/a5,4325.6%+ 106.1%483Honda2,7277.0%+ 22.0%26,8817.1%+ 31.5%344Lexus2,4276.2%– 4.7%46,9267.2%– 19.6%225CMC1,9915.1%– 20.3%55,4255.6%– 16.1%536Mazda1,7914.6%+ 56.1%93,2983.4%+ 4.3%1097Mitsubishi1,6184.1%+ 24.5%74,0314.2%+ 26.0%9108Ford1,5894.1%+ 30.9%64,4344.6%+ 45.8%6n/a9Hyundai1,5163.9%– 7.9%84,0504.2%+ 2.8%8610Mercedes1,3473.4%– 37.6%34,2634.4%– 38.8%75n/aBMW8472.2%– 42.6%n/a2,6462.7%– 30.5%n/a7n/aKia8292.1%– 20.0%n/a1,8201.9%– 28.6%n/an/a
Taiwan March 2026 – models:
PosModelMar-26%/25Feb2026%/24PosFY251Tesla Model Y4,54011.6%+ 1164.6%n/a4,5464.7%+ 191.6%362Toyota Corolla Cross3,5659.1%– 5.5%110,61011.0%+ 0.8%113Toyota RAV42,0635.3%– 3.6%25,6815.9%– 2.7%224CMC J Space1,4673.7%– 17.3%33,9134.1%– 13.8%435Ford Territory1,2573.2%new43,4283.6%new5636Toyota Town Ace1,1703.0%– 32.7%92,8493.0%– 34.1%847Honda CR-V1,1142.8%– 0.5%82,5432.6%– 0.2%10108Toyota Yaris Cross1,1092.8%– 25.9%72,9543.1%– 32.6%759Honda HR-V1,0912.8%+ 84.9%62,8402.9%+ 122.6%9910Lexus NX9852.5%+ 0.0%53,2683.4%– 4.7%6711Mazda CX-57531.9%+ 179.9%141,3921.4%+ 36.5%151312Tesla Model 36711.7%– 12.2%n/a6760.7%– 20.5%333613Mitsubishi Delica6631.7%+ 2.5%171,4521.5%– 11.1%141114Toyota Corolla Altis6251.6%– 26.4%111,8882.0%– 24.2%11815Lexus RX5591.4%+ 20.5%201,5291.6%– 12.5%121416Toyota Camry5561.4%+ 73.8%161,2461.3%+ 52.9%172517Toyota bZ4X5281.3%+ 1550.0%101,2571.3%+ 1097.1%16n/a18Nissan Kicks5111.3%+ 46.4%271,1491.2%+ 12.3%191719Mazda CX-304741.2%+ 38.2%377900.8%+ 16.5%263520Mitsubishi Xforce4731.2%new121,5021.6%new13n/a21Foxtron Bria4061.0%new138100.8%new25 –22Honda Fit4051.0%– 9.8%211,1791.2%– 5.5%182123Lexus UX4021.0%+ 1.5%n/a7490.8%– 43.5%311824CMC Zinger4001.0%– 33.0%191,1291.2%– 30.9%211525Hyundai Porter3931.0%– 20.1%269301.0%+ 5.6%232326Mercedes GLC Class3811.0%– 62.9%181,1431.2%– 54.4%201227Nissan Sentra2990.8%+ 13.7%317630.8%– 2.2%283228Toyota Vios2980.8%– 23.0%229741.0%– 23.5%222229Mazda32970.8%+ 3.8%n/a4950.5%– 38.2%403330Suzuki Jimny2910.7%n/a307520.8%n/a30n/a31Hyundai Custin2610.7%– 38.0%288530.9%– 10.6%243032Hyundai Venue2500.6%+ 3.7%237550.8%– 5.6%293133Lexus LBX2370.6%+ 9.2%335910.6%– 18.3%353734Hyundai Tucson2350.6%– 22.4%385810.6%– 33.1%371935BMW X32230.6%n/a445570.6%n/a39n/a36Kia Sportage2170.6%– 42.9%325890.6%– 27.1%362737MG G50 Plus2140.5%n/a357810.8%n/a27n/a38Suzuki Swift2030.5%– 37.2%156360.7%– 17.1%342839VW T-Roc1950.5%+ 51.2%54n/an/an/an/an/a40Hyundai Mufasa1900.5%new365590.6%new384041Fuso Canter1730.4%– 49.6%553720.4%– 40.5%483942MG HS1680.4%– 50.9%394800.5%– 43.4%423443Nissan X-Trail1630.4%– 58.1%297200.7%– 29.4%322444Ford Kuga1610.4%– 65.9%n/a3520.4%– 71.5%n/a2045Tesla Model X1600.4%– 7.0%n/a1600.2%– 15.3%n/a n/a46Kia Picanto1560.4%n/a623000.3%n/an/an/a47Luxgen n71520.4%– 50.2%653460.4%– 69.1%n/a2648Toyota Alphard1470.4%– 58.6%344470.5%– 44.5%432949Mitsubishi Colt Plus1460.4%– 21.5%583750.4%– 38.5%474350MG ZS1400.4%+ 197.9%404370.5%+ 328.4%444751Skoda Octavia1360.3%– 29.5%513700.4%– 9.8%494552Porsche Cayenne1330.3%n/an/a3350.3%n/an/an/a53Mercedes E Class1320.3%+ 25.7%254900.5%– 7.4%414154Lexus LM1290.3%– 51.5%563200.3%– 52.3%n/a4255Toyota Crown1260.3%– 17.1%473800.4%+ 25.8%466156CMC Veryca1240.3%– 1.6%493830.4%+ 29.0%455357BMW 1 Series1220.3%– 16.4%642870.3%– 32.2%n/a5058Skoda Kodiaq1210.3%– 46.2%n/a2340.2%– 24.0%n/a6459Mercedes GLB Class1200.3%n/a503170.3%n/an/an/a60VW Tiguan1160.3%+ 23.4%463380.4%n/an/an/a61Honda Civic1150.3%+ 55.4%453070.3%+ 110.3%n/a6262Mercedes V Class1130.3%n/a572940.3%– 11.4%n/a5863Volvo XC601110.3%– 16.5%523060.3%n/an/an/a64VW Golf1090.3%n/a672640.3%n/an/an/a65Volvo EX301060.3%n/a592550.3%n/an/an/a66Suzuki Carry1040.3%+ 10.6%60n/an/an/an/an/a67Mitsubishi Outlander940.2%n/an/a2030.2%n/an/an/a68Kia Carnival930.2%– 66.3%61n/an/an/an/a4969Toyota Granvia+Hiace930.2%– 25.0%n/a1800.2%– 41.4%n/an/a70Mercedes C Class910.2%– 16.5%692410.2%– 33.6%n/a59
Source: u-car.com.tw
More Stories
Powerful Reasons Mercedes-AMG’s Latest GT Project Matters More Than You Think
From its base in Affalterbach, Mercedes-AMG has, recently, lifted the lid on a striking new direction for its GT line-up....
Top 5 Brands for Tailor-Made Car Accessories
Your vehicle deserves accessories that match your unique style and specific needs. While mass-produced car accessories serve basic functions, tailor-made...
How Car Finance Protects Your Buying Power in 2026
For many UK buyers, financing a vehicle isn’t just a way to “afford” a better car. It can be a deliberate choice to keep cash...
Hyundai Venus and Earth Concepts Signal a Bold New Ioniq Future for China
Hyundai has never been shy about taking a design risk, but the new Venus and Earth concepts feel like a...
A Chance To Win Tickets To The Wonderful Concours des Légendes 2026
We are delighted to offer you, our readers, another exciting competition. Are you signed up to our newsletter here, and...
How CGI Transforms Automobile Design & Prototyping
Car design has always depended on a mix of imagination, engineering, and revision. A sketch can set the direction, but...