
Italy March 2026: Leapmotor T03 on podium
The Leapmotor T03 becomes the first Chinese model to enter the Italian podium.
New car sales in Italy are up by a solid 7.6% year-on-year in March to 185,367 units, leading to a year-to-date tally up 9.2% to 484,802. Private sales are up 18% to 95,638 and 51.2% share vs. 46.7% a year ago (up 7.7% to 53.2% share YTD), self registrations are up 8.3% to 15,397 and 8.2% share, unchanged on March 2025 (up 19.1% to 9.2% share YTD), long term leases fall -11.8% to 40,781 and 21.8% share vs. 26.6% in March 2025 (down -3.2% to 21.1% share YTD), short term rentals are up 9.7% to 25,082 and 13.4% share vs. 13.2% last year (up 51.3% to 11.4% share YTD) and company sales gain 7.6% to 9,790 and 5.2% share, unchanged (up 2% to 5.1% share YTD).
BEVs shoot up 71.7% to 16,137 and 8.6% share vs. 5.4% in March 2025 (up 65.3% to 7.8% share vs. 5.2% YTD) and PHEVs soar 114.5% to 16,998 and 9.1% share vs. 4.6% a year ago (up 123.3% to 8.8% share YTD). This way, rechargeable cars gain 91.3% to 33,135 and 17.7% share vs. 10% in March 2025 (up 91.7% to 81,098 and 16.6% share YTD vs. 9.5% over the same period in 2025.
In the brands ranking, Fiat (+27.2%) continues to catch up on lost time but sees its share drop from 13.4% in February to 11.4% this month. YTD volumes are up 29.8% to 12.7% share. Volkswagen (+2.7%) overtakes Toyota (-5.6%) for second place while Dacia (+4.3%) climbs back up five spots on last month #4, overtaking sister brand Renault (+1.8%), a soaring Audi (+27.4%), a freefalling Peugeot (-26.7%), BMW (+8.2%) and Jeep (-7.8%). Citroen (+11%) closes out the Top 10 in sturdy fashion. Kia (+22.3%) also makes itself entice at #11, while Chinese Leapmotor (+2727.2%) breaks its volume record at 5,513 units and BYD surges 190.6% to #17 and 2.8% share.
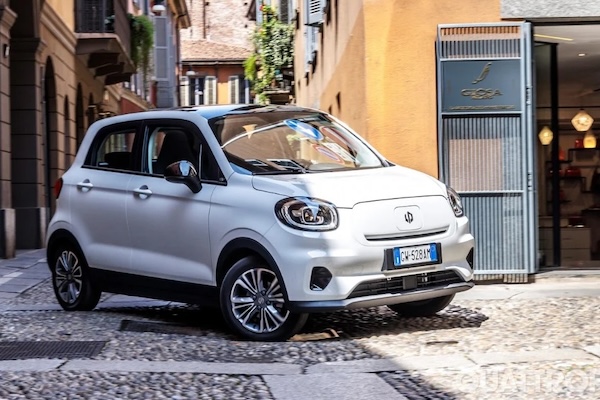
Model-wise, the Fiat Panda (-11.6%) accounts for 6% of its home market vs. 8% last month, entirely responsible for the brand’s drop vs. February. The Jeep Avenger (+6.1%) repeats at a record 2nd place with 2.8% share. Once again the biggest event of the month is delivered by the Leapmotor T03 (+2889.3%) up to a surreal and record third place. This is because of its price reduced to an incredible €4,900 after incentives and a further €3,000 rebate from the manufacturer. Its advertising campaign promotes it as “cheaper than your bike”. Almost 10,750 units of the T03 have now been registered in Italy since the start of the year, earning it a fifth place YTD. The Dacia Sandero (-15.1%) rallies back up 17 ranks on February to #4 but remains well below its year-ago level. Although it drops two spots on February, the Fiat Grande Panda (+1073%) posts an encouraging third consecutive month inside its home Top 5. The Nissan Qashqai (+2.9%) and Dacia Duster (+25.7%) are back inside the Top 10, with the Fiat 600 (+21.6%) lodging its best ranking since May 2025 at #12.
Previous month: Italy February 2026: Fiat Grande Panda up to #3, €4,900 Leapmotor T03 up to #4
One year ago: Italy March 2025: MG breaks into Top 10, sales up 6.2%
Full March 2026 Top 55 All brands and Top 50 models below.
Italy March 2026 – brands:
PosBrandMar-26%/25Feb2026%/25PosFY251Fiat21,16811.4%+ 27.2%161,40812.7%+ 29.8%112Volkswagen12,3566.7%+ 2.7%331,7206.5%+ 3.3%333Toyota11,9836.5%– 5.6%233,2906.9%– 1.7%224Dacia9,7325.3%+ 4.3%922,7134.7%– 26.9%545Renault8,8044.7%+ 1.8%423,1214.8%+ 12.1%466Audi8,0594.3%+ 27.4%622,2244.6%+ 18.5%787Peugeot7,8274.2%– 26.7%522,3824.6%– 12.5%658BMW7,4214.0%+ 8.2%720,6484.3%+ 5.4%879Jeep6,9713.8%– 7.8%819,7164.1%– 0.2%9910Citroen6,8923.7%+ 11.0%1118,0283.7%– 0.5%101111Kia6,0893.3%+ 22.3%2013,5872.8%+ 9.9%141512Ford5,9563.2%– 20.1%1315,3113.2%– 15.2%131013Nissan5,9453.2%– 7.7%1813,2732.7%– 2.8%151814MG5,9073.2%– 10.3%1015,6473.2%+ 1.9%111315Mercedes5,8103.1%– 10.0%1415,5213.2%+ 3.2%121216Leapmotor5,5133.0%+ 2727.2%1211,6392.4%+ 1927.7%193217BYD5,1932.8%+ 190.6%1512,8542.7%+ 224.4%162118Skoda4,3852.4%+ 23.9%1711,6412.4%+ 16.0%181619Opel4,3362.3%– 16.2%1612,0582.5%+ 4.5%171720Omoda+Jaecoo3,5351.9%+ 258.2%228,9911.9%+ 337.3%212521Suzuki3,3921.8%– 7.8%218,7261.8%– 6.7%221922Hyundai3,2021.7%– 34.0%1910,6172.2%– 16.2%201423Alfa Romeo3,0371.6%– 22.4%237,3871.5%– 13.1%232024Tesla2,9201.6%+ 31.7%324,4190.9%+ 27.4%262725Cupra2,4681.3%– 6.8%246,0521.2%+ 16.5%242226Mazda2,0641.1%+ 72.9%264,3950.9%+ 45.7%272827Mini1,8781.0%+ 33.3%254,7971.0%+ 34.7%252428Volvo1,3190.7%– 3.1%273,7250.8%+ 0.8%282629Lancia1,1870.6%+ 6.9%303,2000.7%+ 9.4%293030Honda1,0790.6%+ 36.8%283,1320.6%+ 40.3%302931Seat1,0620.6%– 29.2%292,5400.5%– 8.4%323132DR Motor1,0340.6%– 28.4%312,6800.6%– 37.3%312333EVO7900.4%+ 16.2%361,9620.4%– 0.9%343534Land Rover7130.4%– 27.5%331,9830.4%– 13.0%333435EMC6670.4%+ 211.7%381,4780.3%+ 140.3%373836Lexus6390.3%– 2.1%351,7490.4%– 0.2%353637Porsche6250.3%– 10.8%371,5030.3%– 15.6%363338DS5710.3%– 16.4%391,2770.3%– 7.5%383739Geely5360.3%new469090.2%new40 –40Subaru4280.2%+ 56.2%438220.2%+ 41.2%413941DFSK2920.2%+ 247.6%407990.2%+ 189.5%424342KGM2390.1%+ 1738.5%425940.1%+ 1000.0%435043Sportequipe2200.1%+ 38.4%349630.2%+ 156.8%394044Lynk & Co1420.1%+ 343.8%415140.1%+ 367.3%444545Maserati1150.1%– 24.8%452770.1%– 41.6%474146Ferrari1060.1%+ 21.8%482700.1%+ 17.9%484447Lamborghini940.1%+ 77.4%492200.0%+ 41.9%494848Mitsubishi790.0%– 53.5%511110.0%– 78.9%514249Ich-X660.0%+ 247.4%473070.1%+ 707.9%46n/a50Polestar560.0%+ 55.6%501620.0%+ 80.0%504951Tiger460.0%+ 4.6%443960.1%+ 760.9%45n/a52Smart400.0%– 31.0%52870.0%– 65.2%524653Alpine250.0%– 7.4%53840.0%+ 68.0%53n/a54Lotus220.0%– 29.0%55480.0%– 37.7%545155Aston Martin120.0%+ 50.0%54440.0%+ 18.9%555356Jaguar00.0%– 100.0%5640.0%– 97.3%565257Mahindra00.0%– 100.0% –10.0%– 99.8%5747 –Others3200.2%+ 39.1% –7960.2%+ 40.9% – –
Italy March 2026 – models:
PosModelMar-26%/25Feb2026%/25PosFY251Fiat Panda11,1236.0%– 11.6%137,0297.6%– 2.1%112Jeep Avenger5,2592.8%+ 6.1%216,4033.4%+ 14.7%233Leapmotor T035,0222.7%+ 2889.3%410,7492.2%+ 1947.4%5n/a4Dacia Sandero4,3932.4%– 15.1%219,3531.9%– 43.8%925Fiat Grande Panda4,3872.4%+ 1073.0%313,1862.7%+ 3180.1%3376Citroen C34,1522.2%– 18.8%610,8012.2%– 30.1%447Nissan Qashqai3,6862.0%+ 2.9%168,1761.7%+ 13.9%11228Renault Clio3,6532.0%+ 22.8%89,3991.9%+ 34.4%799Dacia Duster3,6001.9%+ 25.7%118,5721.8%– 20.2%10710Toyota Aygo X3,5371.9%+ 74.1%79,6892.0%+ 79.3%61411Toyota Yaris Cross3,4041.8%– 8.9%59,3711.9%+ 0.8%8512Fiat 6003,2911.8%+ 21.6%315,8591.2%– 7.6%251913VW T-Roc3,2611.8%+ 29.9%247,5241.6%+ 7.8%151114MG ZS3,1181.7%– 17.4%108,0241.7%– 14.5%121015Kia Sportage2,9311.6%+ 14.7%226,4801.3%+ 15.5%222016BYD Atto 22,9001.6%new374,2180.9%new33n/a17Toyota Yaris2,8941.6%– 23.7%137,9361.6%– 22.9%14618Renault Captur2,8921.6%– 2.6%98,0131.7%+ 2.8%131319Ford Puma2,8361.5%– 3.1%206,9871.4%– 1.2%171220BMW X12,6991.5%+ 21.7%186,9611.4%+ 20.9%191621VW T-Cross2,6951.5%+ 15.0%126,9801.4%+ 8.3%181722Peugeot 2082,5811.4%– 46.8%157,4101.5%– 36.5%16823Opel Corsa2,4941.3%– 29.9%176,8161.4%– 14.4%211824VW Tiguan2,4391.3%+ 14.1%146,8651.4%+ 15.0%201525Peugeot 20082,2371.2%– 2.5%255,4191.1%– 12.5%262126Audi Q32,0861.1%+ 84.0%196,2911.3%+ 67.7%234027Fiat 5001,9601.1%+ 1109.9%394,1900.9%+ 574.7%34n/a28Peugeot 30081,9221.0%+ 7.0%266,0961.3%+ 37.2%242329Kia Picanto1,9061.0%+ 73.4%454,2860.9%+ 22.5%323030Nissan Juke1,7641.0%– 17.7%403,9360.8%– 21.4%383431MG 31,7580.9%– 18.0%235,0781.0%+ 15.7%273132Jeep Compass1,6980.9%+ 28.1%n/a2,8540.6%+ 3.6%49n/a33VW Golf1,6470.9%+ 7.6%284,1900.9%– 1.1%352934Tesla Model 31,6280.9%+ 4.0%n/a2,0020.4%– 9.3%n/an/a35Suzuki Swift1,5530.8%+ 22.1%304,0010.8%+ 40.8%373536Citroen C3 Aircross1,5460.8%n/a353,8670.8%n/a39n/a37Toyota C-HR1,5330.8%– 14.6%364,7751.0%– 14.8%282438Hyundai Tucson1,4200.8%+ 8.6%274,4290.9%+ 23.7%303239Ford Kuga1,4110.8%+ 11.0%n/a3,0370.6%– 7.1%474340Alfa Romeo Tonale1,4080.8%– 23.8%n/an/an/an/an/a3941Audi A11,4030.8%+ 61.4%413,4150.7%+ 27.9%414642BYD Seal U1,3980.8%– 4.2%324,6141.0%+ 63.0%292643Omoda 51,3880.7%n/a344,0210.8%n/a36n/a44Skoda Fabia1,3280.7%– 0.3%333,5280.7%+ 15.5%403645Tesla Model Y1,2830.7%+ 97.4%n/a2,3900.5%+ 90.4%n/an/a46Alfa Romeo Junior1,2770.7%– 18.3%294,3800.9%+ 1.2%312847Skoda Kamiq1,2510.7%+ 48.9%443,1560.7%+ 6.7%463848Suzuki Vitara1,2300.7%+ 10.5%423,1630.7%+ 1.0%454149Lancia Ypsilon1,1870.6%+ 6.9%463,2000.7%+ 9.4%444450Mercedes GLC1,1790.6%+ 33.5%n/a2,8520.6%+ 24.8%50n/an/aAudi A31,1350.6%– 14.5%433,3730.7%– 14.5%4225n/aMercedes GLA9850.5%– 34.8%473,2360.7%– 10.2%4333n/aHyundai i209220.5%n/a382,8960.6%n/a48n/a
Source: UNRAE


More Stories
Unlock Hidden Performance: Why Modern Drivers Are Turning to Smart Tuning Solutions
Unlock Hidden Performance: Why Modern Drivers Are Turning to Smart Tuning Solutions For decades, car enthusiasts have searched for ways...
What Food Is Miami Known For? Dishes You Should Not Miss
Miami’s colorful cuisine is a real reflection of its diverse culture and history. The unique dishes, a combination of a...
2027 Chevrolet Corvette Grand Sport X Could Be the Real Sweet Spot in the Lineup
Back on March 13, 2001, Paul Pierce lit up the Lakers at Staples Center with 42 points on 13-of-19 shooting....
2026 Chevrolet Silverado EV Trail Boss Review & Test Drive
The electric vehicle (EV) market has leveled out for many reasons as of late, but such an environment hasn’t stopped...
Netherlands March 2026: Tesla manages 1-2, Kia EV5 in Top 10
The Kia EV5 ranks #8 for its 5th month in market. The Dutch new car market stabilises after two horrendous...
Spain March 2026: Toyota, Hyundai shoot up, BYD breaks records, highest monthly volume since June 2019
Toyota sales are up 67.5% year-on-year in February. It’s an outstanding month for new car sales in Spain with March...