
Indonesia October 2025: BYD Atto 1 lands directly at #1 with 12.7% share
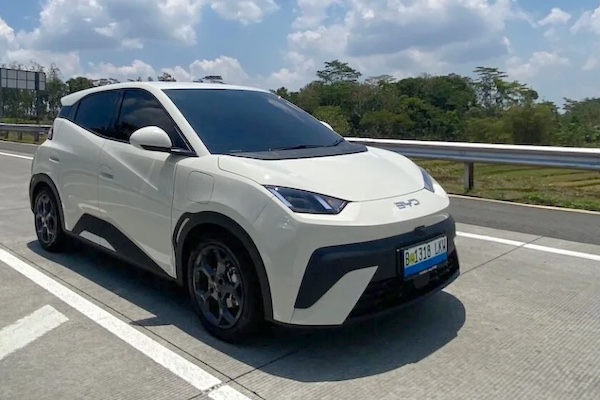
The BYD Atto 1 makes a spectacular entrance in the Indonesian market.
New vehicle wholesales in Indonesia slow down their fall in October at -4.8% year-on-year to 74,019 units, leading to a year-to-date tally down -10.5% to 635,844. In contrast retail sales are up 1.7% to 74,720 for the month but down -9.6% YTD to 660,659.
In the wholesales brands ranking, Toyota (-23.9%) and Daihatsu (-16.4%) both lose share to 27.8% and 15.9% respectively, but the hero of the month is BYD up a stellar 325.8% on October and 9 spots on last month to land on the third step of the podium with over 10,000 sales and 14.3% share. It previous bests were #5, 3,496 sales and 6.8% share last April. Mitsubishi (+38.9%), Isuzu (+14.1%) and Chery (+123.2%) also impress in the remainder of the Top 10. Retail-wise, Toyota (-13.4%) and Daihatsu (-6.9%) suffer here too with BYD (+274.7%) surging to a record #3. Chery (+113.8%), Suzuki (+10.8%) and Mitsubishi (+9.6%) stand out below.
Over in the models wholesales ranking, we have an unheard-of event: the BYD Atto 1 (aka Seagull) lands directly at #1 with 12.7% share for its first month of sales in Indonesia! This is the highest share reached by any model since the freak 17% of the Nissan Livina in pandemic-struck August 2020. This way, the Atto 1 accounts for 89% of BYD’s sales for the month. The Daihatsu Gran Max Pikap (-22.4%) stays at #1 above the YTD leader, the Toyota Kijang Innova (-40.6%), down to #3. The Suzuki Carry Pikap (+27%) defies the negative trend at #5 ahead of the Toyota Calya (-18.6%). The Mitsubishi Xpander (+107.2%) and Daihatsu Gran Max Minibus (+370.2%) both post surreal upticks further down. Below the Atto 1, the Mitsubishi Destinator (#12) and Suzuki Fronx (#22) are the next best-selling newcomers.
Previous month: Indonesia September 2025: Chery (+212.8%) stands out in market off -14.6%
One year ago: Indonesia October 2024: Toyota Kijang Innova leads, BYD M6 cracks Top 10
Full October 2025 Top 43 All brands (wholesales and retail) and Top 186 All models (wholesales) below.
Note: Medium and heavy vehicles are included in the brands rankings but not in the wholesales charts.
Indonesia October 2025 – brands (wholesales):
PosBrandOct-25%/24Sep2025%/24PosFY241Toyota20,55927.8%– 23.9%1202,37631.8%– 14.0%112Daihatsu11,78315.9%– 16.4%2107,09016.8%– 23.5%223BYD10,59314.3%+ 325.8%1230,6704.8%+ 178.2%6114Mitsubishi7,62010.3%+ 38.9%356,5168.9%– 5.3%345Suzuki5,5507.5%+ 1.1%449,8037.8%– 8.6%556Honda3,6474.9%– 57.8%550,2707.9%– 35.5%437Isuzu2,4023.2%+ 14.1%820,1123.2%– 9.3%878Mitsubishi Fuso2,3243.1%– 3.7%620,2633.2%– 9.9%769Hino1,8612.5%– 19.8%914,4032.3%– 24.2%11810Chery1,5602.1%+ 123.2%716,7202.6%+ 142.7%91211Wuling1,4151.9%– 35.8%1113,6792.2%– 15.1%121012Hyundai1,3541.8%– 20.9%1016,5942.6%– 12.1%10913Aion4170.6%+ 134.3%134,8220.8%+ 651.1%142114Mercedes2530.3%– 13.4%181,8540.3%– 40.7%181615MG2220.3%– 2.2%191,6100.3%– 55.4%191516GWM2210.3%+ 44.4%161,2260.2%+ 94.6%23n/a17Mazda2160.3%– 28.0%142,5710.4%– 31.2%161418Vinfast2090.3%new213,0500.5%new15 –19BMW 1960.3%– 61.3%201,3350.2%– 62.8%221320Denza1920.3%new156,9671.1%new13 –21Geely1450.2%new222,0210.3%new17 –22FAW1440.2%+ 136.1%259120.1%+ 34.9%262423Polytron1170.2%new332100.0%new38 –24Jaecoo1090.1%new177490.1%new27 –25Jetour1060.1%new286040.1%new30 –26Xpeng1000.1%new244440.1%new33 –27BAIC950.1%+ 58.3%325330.1%+ 167.8%323128Citroen930.1%– 19.8%231,1040.2%+ 2.4%242029UD Trucks900.1%– 50.8%261,4540.2%– 12.5%201830Ford800.1%+ 11.1%306330.1%– 6.5%292631Dongfeng (DFSK)630.1%+ 18.9%346570.1%– 10.2%282532Neta550.1%+ 57.1%395420.1%+ 4.4%312833Lexus530.1%– 70.7%291,3520.2%– 39.3%211734Scania440.1%+ 37.5%364370.1%+ 32.4%343035Nissan300.0%– 76.0%279240.1%– 8.5%251936Mini250.0%– 49.0%354040.1%– 48.1%352337Volkswagen170.0%+ 88.9%402170.0%+ 193.2%373538Seres150.0%n/a381160.0%+ 56.8%403439Volvo150.0%+ 650.0%411030.0%+ 5.1%413240Subaru120.0%– 70.0%372420.0%– 49.7%362941Maxus120.0%new311640.0%new39 –42Kia 30.0%– 94.2%42780.0%– 92.3%422243Audi20.0%+ 100.0%43130.0%– 43.5%4337
Indonesia October 2025 – brands (retail):
PosBrandOct-25%/24Sep2025%/24PosFY241Toyota21,50428.8%– 13.4%1209,38731.7%– 13.6%112Daihatsu12,19616.3%– 6.9%2112,53017.0%– 21.3%223BYD 9,73213.0%+ 274.7%931,0464.7%+ 252.0%6114Mitsubishi6,2848.4%+ 9.6%355,4088.4%– 9.3%445Suzuki5,9037.9%+ 10.8%450,3537.6%– 10.5%556Honda4,6076.2%– 42.8%558,7208.9%– 29.7%337Mitsubishi Fuso2,3873.2%– 0.2%720,2953.1%– 9.5%778Isuzu2,0962.8%– 14.4%619,6043.0%– 16.0%869Hino1,8672.5%– 12.3%1016,8012.5%– 7.7%10910Wuling1,7442.3%– 15.8%1115,7282.4%– 20.5%12811Chery1,5632.1%+ 113.8%816,6672.5%+ 148.8%111212Hyundai1,3531.8%– 6.8%1217,1592.6%– 9.2%91013Aion4420.6%+ 132.6%135,0620.8%+ 1012.5%142214Denza3300.4%new146,7571.0%new13 –15Geely3140.4%new191,8010.3%new19 –16Mazda2340.3%– 22.3%152,6420.4%– 29.1%161317Mercedes2090.3%– 48.6%182,2200.3%– 32.4%171518BMW 1720.2%– 48.3%161,9670.3%– 39.8%181619Vinfast1610.2%new212,7890.4%new15 –20MG1570.2%– 46.2%241,5280.2%– 58.7%201421GWM1520.2%+ 16.9%171,0320.2%+ 97.3%24n/a22FAW1440.2%+ 136.1%269120.1%+ 34.9%252523Jaecoo1400.2%new206040.1%new29 –24UD Trucks1080.1%– 50.5%231,1290.2%– 28.2%221825Xpeng1040.1%new273610.1%new35 –26Polytron1030.1%new361500.0%new39 –27Jetour1000.1%new305340.1%new30 –28Citroen880.1%– 23.5%251,0430.2%+ 49.0%232329BAIC880.1%+ 37.5%315140.1%+ 324.8%313130Lexus790.1%– 60.3%221,3350.2%– 44.4%211731Ford730.1%+ 12.3%326760.1%– 1.6%282632Dongfeng (DFSK)610.1%– 3.2%296760.1%– 26.9%272133Scania440.1%+ 37.5%354370.1%+ 32.4%333034Nissan410.1%– 71.1%288460.1%– 20.3%261935Mini290.0%– 39.6%334440.1%– 43.1%322436Subaru210.0%– 56.3%342700.0%– 50.9%362737Volkswagen160.0%+ 45.5%382200.0%+ 150.0%383338Kia 150.0%– 72.7%392610.0%– 76.9%372039Maxus 150.0%new371160.0%new41 –40Volvo150.0%+ 650.0%411030.0%+ 5.1%423241Seres140.0%+ 180.0%421210.0%+ 39.1%403442Neta130.0%– 58.1%403980.1%– 6.4%342943Audi20.0%+ 100.0%43130.0%– 40.9%4338
Indonesia October 2025 – models (wholesales):
PosModelOct-25%/24Sep2025%/24PosFY241BYD Atto 19,39612.7%new –9,3961.5%new18 –2Daihatsu Gran Max Pikap (PU)4,2145.7%– 22.4%230,9844.9%– 23.5%353Toyota Kijang Innova3,3794.6%– 40.6%148,6817.7%– 7.1%114Toyota Avanza3,0874.2%– 45.0%331,3054.9%– 27.8%225Suzuki Carry Pikap3,0594.1%+ 27.0%422,6683.6%– 7.5%896Toyota Calya3,0574.1%– 18.6%2322,8983.6%– 29.7%767Mitsubishi Xpander2,7513.7%+ 107.2%1120,9253.3%– 21.7%978Daihatsu Gran Max BV/MB2,4923.4%+ 370.2%613,3922.1%+ 118.8%11279Honda Brio2,1752.9%– 50.4%1427,8524.4%– 34.1%5410Toyota Rush2,0142.7%– 25.7%524,0613.8%– 11.4%6811Toyota Hilux1,9192.6%+ 73.2%813,3132.1%+ 14.6%121912Mitsubishi Destinator 1,7722.4%new185,3080.8%new31 –13Daihatsu Sigra1,6892.3%– 58.7%729,7844.7%– 38.6%4314Daihatsu Terios1,3491.8%– 0.6%1213,5852.1%– 9.5%101115Toyota Agya1,3301.8%– 18.9%1012,5702.0%– 23.1%131016Mitsubishi Pajero Sport1,0811.5%+ 31.0%277,7371.2%– 31.8%241617Isuzu Traga PHR9171.2%+ 5.3%158,8471.4%+ 8.0%202318Mitsubishi L-300 Pikap9121.2%– 9.7%179,5231.5%– 3.7%172019Suzuki XL78821.2%– 12.6%256,4701.0%– 25.8%292220Toyota Raize8821.2%– 16.8%248,3411.3%– 20.6%221821Daihatsu Ayla8511.1%– 47.3%219,8431.5%– 31.6%161222Suzuki Fronx8341.1%new167,3141.2%new26 –23Hyundai Stargazer8211.1%+ 25.9%207,4691.2%– 23.1%252124Mitsubishi L200 Triton8091.1%– 9.1%228,0541.3%+ 29.0%232625Toyota Fortuner7461.0%– 32.9%1911,2281.8%+ 3.8%141526Toyota Hilux Rangga6990.9%+ 49.4%284,8830.8%+ 381.6%345027Honda HR-V6260.8%– 66.0%910,3511.6%– 20.7%151328Wuling Binguo6250.8%+ 243.4%293,6960.6%– 12.7%403329Toyota Hiace5860.8%– 28.8%315,6010.9%+ 23.6%302830Toyota Veloz5630.8%– 47.9%268,5411.3%– 27.4%211431Chery Tiggo Cross5230.7%new134,1780.7%new38 –32BYD M65160.7%– 72.3%349,3591.5%+ 206.5%193133Daihatsu Xenia4800.6%– 7.2%324,7030.7%– 46.8%362434Daihatsu Rocky4060.5%+ 34.9%392,4880.4%– 29.0%464035Chery iCar 033860.5%new375,2040.8%new328036Toyota Yaris Cross3710.5%– 40.7%432,8020.4%– 32.4%443637Honda BR-V3690.5%– 60.9%405,0060.8%– 44.6%332538BYD Sealion 73470.5%new387,2231.1%new27 –39Chery Tiggo 83430.5%+ 12.8%334,5830.7%+ 660.0%376140Aion V3390.5%new302,5840.4%new45 –41Suzuki APV Minibus2980.4%+ 31.9%481,7990.3%– 31.7%544642Honda WR-V2960.4%– 77.1%444,1510.7%– 56.7%391743Mitsubishi Xforce2950.4%– 50.8%353,1250.5%– 39.3%433044Daihatsu Luxio2810.4%+ 10.6%412,1450.3%– 6.5%494845Hyundai Creta2590.3%+ 0.0%364,7480.7%+ 0.3%353446BYD Atto 32420.3%+ 60.3%422,3000.4%– 20.9%474447Denza D91920.3%new456,9671.1%new28 –48Wuling Cloud1880.3%+ 184.8%622,1430.3%– 28.8%504249Wuling Mitra 1850.2%new474240.1%new89 –50Vinfast VF 31600.2%new631,5150.2%new59 –51Wuling Confero S1540.2%– 50.0%701,1170.2%– 43.2%664552Suzuki Alpha1510.2%– 57.9%653,6150.6%+ 7.2%413753Chery Omoda E51490.2%– 36.6%521,1790.2%– 70.0%643954Geely EX5 Max1450.2%new532,0210.3%new52 –55Toyota Alphard1390.2%– 84.0%462,0230.3%– 53.2%513256Wuling Air1190.2%– 85.7%573,1990.5%+ 7.3%423857GWM Tank 3001170.2%+ 143.8%565160.1%+ 174.5%8110658Suzuki Jimny1090.1%– 67.7%502,2840.4%+ 15.5%485159GWM Ora 03970.1%new783310.1%new99 –60Hyundai Palisade970.1%– 61.7%511,3470.2%– 17.2%615561Chery Tiggo 9960.1%new602190.0%new107 –62Xpeng X9960.1%new673430.1%new97 –63Hyundai Kona950.1%– 47.5%804120.1%– 47.5%906564Honda Step WGN940.1%new493900.1%new93 –65Suzuki S-Presso880.1%– 55.1%641,2250.2%– 48.3%634766Aion Hyptec780.1%new1041,7260.3%new56 –67Mazda CX-60780.1%+ 550.0%1412830.0%+ 48.2%10210768Suzuki Grand Vitara760.1%– 70.1%841,6090.3%– 17.4%575369Wuling Formo750.1%– 69.1%999220.1%+ 21.6%675770MG ZS730.1%+ 43.1%733950.1%– 51.6%927271Jetour Dashing690.1%new893770.1%new94 –72Mazda CX-3670.1%– 24.7%616990.1%– 34.4%716373Jaecoo J8660.1%new581980.0%new112 –74BAIC BJ30650.1%new –650.0%new163 –75Polytron G3+650.1%new1051160.0%new137 –76BYD E6640.1%new543030.0%new100 –77MG 5 GT590.1%+ 1080.0%881460.0%– 33.9%12510878Honda CR-V570.1%– 63.9%714310.1%– 85.6%884379Toyota Land Cruiser 70560.1%n/a941380.0%+ 305.9%12617380Wuling Alvez550.1%– 88.6%551,3210.2%– 34.2%624981Chery Omoda 5530.1%– 34.6%746810.1%– 45.0%735682Citroen C3530.1%+ 29.3%796350.1%+ 60.4%768683Neta V530.1%+ 165.0%1104410.1%– 6.8%878184Suzuki Ertiga530.1%– 87.5%821,7360.3%– 66.4%552985Mazda CX-5520.1%+ 15.6%596890.1%– 43.0%726286Polytron G3520.1%new97940.0%new147 –87Hyundai Santa Fe440.1%– 85.6%761,5520.2%+ 110.6%586888Jaecoo J7430.1%new725510.1%new79 –89MG VS HEV410.1%+ 241.7%103890.0%– 70.4%1519990Citroen C3 Aircross SUV400.1%– 46.7%864640.1%– 32.0%857391Ford Everest400.1%+ 0.0%903420.1%– 13.6%988492Ford Ranger400.1%+ 25.0%1022830.0%+ 0.7%1019893Toyota Voxy390.1%– 80.0%758090.1%– 49.6%705494Toyota Camry380.1%+ 375.0%872420.0%– 17.7%10510295Jetour X70P370.0%new982270.0%new106 –96Mazda3370.0%– 62.2%666760.1%+ 6.1%757597Lexus LM340.0%– 71.4%859050.1%– 29.5%695998BMW X3320.0%– 61.9%691670.0%– 57.3%1198299Vinfast VF e34320.0%new911,4390.2%new60 –100MG HS310.0%n/a111520.0%– 47.5%171140101DFSK Glory300.0%new –300.0%new188 –102Hyundai Ioniq 5300.0%– 14.3%1616770.1%– 39.9%7460103Honda Civic290.0%+ 222.2%1011930.0%– 68.8%11376104Toyota bZ4X290.0%+ 31.8%162690.0%– 27.4%158128105BAIC BJ40 Plus280.0%– 49.1%813990.1%+ 195.6%91123106Toyota Land Cruiser 300270.0%– 75.9%964740.1%– 62.6%8458107DFSK Mini Truck260.0%– 21.2%924900.1%– 10.6%8378108BMW 3 Series250.0%– 70.6%1221360.0%– 82.0%12871109Toyota Corolla240.0%– 17.2%931010.0%– 43.6%143113110Nissan Serena220.0%– 81.2%775560.1%– 3.1%7769111BMW X5210.0%– 71.6%1231480.0%– 68.8%12379112Daihatsu Sirion210.0%+ 2000.0%1091600.0%– 10.6%120117113BMW 2 Series190.0%– 50.0%148900.0%– 60.9%14996114Mercedes EQE190.0%+ 280.0%168360.0%+ 33.3%178175115Toyota Vellfire190.0%– 63.5%1073470.1%– 15.0%9583116BMW 7 Series180.0%+ 350.0%137670.0%– 46.4%161126117Mazda CX-8180.0%+ 125.0%156980.0%– 13.3%144131118Isuzu D-Max170.0%n/a1132160.0%+ 5.4%108111119MG 4170.0%– 88.4%1279130.1%– 57.8%6852120BMW IX1150.0%– 31.8%1391350.0%+ 18.4%130104121BYD Seal150.0%– 95.5%681,1380.2%– 72.0%6535122Lexus LX150.0%+ 150.0%116750.0%– 47.6%155116123Mini Cooper150.0%– 37.5%1062760.0%– 29.6%10385124Seres E502150.0%n/a1001160.0%+ 56.8%136144125BMW 4 Series130.0%– 51.9%145730.0%– 42.1%156114126BYD Dolphin130.0%– 90.6%1605220.1%– 47.7%8066127Mercedes C-Class120.0%+ 9.1%1361710.0%– 58.8%11889128Mercedes GLA120.0%– 20.0%134680.0%– 67.3%160110129Mercedes GLC120.0%+ 9.1%1352000.0%– 13.8%111103130Maxus MIFA 9110.0%new831050.0%new140 –131Vinfast VF 6110.0%new131230.0%new195 –132Mini Countryman100.0%– 44.4%1121030.0%– 67.3%14297133Toyota Corolla Cross100.0%– 37.5%1261190.0%+ 24.0%134136134Wuling Cortez100.0%– 68.8%955560.1%+ 150.5%78105135BMW IX90.0%+ 0.0%155490.0%– 60.2%173130136Volvo XC6090.0%n/a172320.0%+ 45.5%184182137VW ID.BUZZ90.0%new1381100.0%new139 –138BMW 5 Series80.0%– 86.9%128950.0%– 70.2%14695139Chery Tiggo 8 Pro80.0%+ 700.0% –1350.0%+ 181.3%131167140Nissan Terra80.0%+ 14.3%149510.0%– 32.9%172146141DFSK Gelora70.0%– 12.5%1301370.0%+ 10.5%127132142VW Tiguan70.0%+ 16.7%117660.0%+ 4.8%162155143BMW X760.0%+ 0.0%142850.0%+ 7.6%154137144BMW Z460.0%– 33.3% –280.0%– 60.0%190142145Mercedes GLE60.0%– 57.1%1292080.0%– 22.1%109100146Vinfast VF 560.0%new157690.0%new157 –147Hyundai Genesis50.0%n/a –120.0%n/a205 –148Subaru BRZ50.0%– 64.3%140590.0%– 32.2%168135149BMW X640.0%– 42.9%166170.0%– 70.2%202162150GWM Tank 50040.0%– 96.2%1331470.0%– 61.1%12488151Mercedes Sprinter40.0%– 50.0%164260.0%– 50.0%192164152Subaru Forester40.0%– 50.0%1191040.0%– 14.0%141122153Volvo EX3040.0%n/a151330.0%+ 1000.0%183192154Wuling Almaz40.0%– 93.2%1182070.0%– 77.6%11067155Xpeng G640.0%new1141130.0%new138 –156Lexus RX30.0%– 91.2%1242680.0%– 61.1%10474157Mazda MX-530.0%– 57.1%150340.0%– 2.9%181171158Mercedes A-Class30.0%– 40.0%179220.0%– 86.3%197118159BAIC X-5520.0%– 60.0%169690.0%+ 6.2%159151160BMW XM20.0%n/a –240.0%+ 300.0%194194161Chery Tiggo 5X20.0%– 96.6%1751360.0%– 83.3%12970162GWM Haval Jolion20.0%new –1790.0%new117 –163Hyundai Staria20.0%– 83.3%176360.0%– 59.6%179138164Kia Carnival20.0%– 77.8% –290.0%– 81.3%189115165Mazda620.0%– 33.3%170370.0%+ 23.3%177174166Mercedes CLA20.0%– 80.0%17780.0%– 84.0%210163167Mercedes GLS20.0%– 75.0%165880.0%+ 33.3%152150168Neta X20.0%– 86.7%1541260.0%+ 173.9%133127169Subaru WRX20.0%– 71.4%1673450.1%+ 484.7%96156170Volvo XC9020.0%+ 100.0%182200.0%– 9.1%200180171Audi Q310.0%n/a –30.0%– 40.0%227198172Audi Q810.0%n/a –30.0%– 25.0%228202173BMW i410.0%– 83.3%178410.0%+ 41.4%174176174BMW i710.0%– 66.7%180210.0%– 79.2%199133175BMW X410.0%– 83.3% –30.0%– 87.0%226181176GWM Haval H610.0%n/a125330.0%– 48.4%182139177Honda e:N110.0%new –650.0%new164 –178Hyundai Venue10.0%new –320.0%new186 –179Kia Carens10.0%+ 0.0%171100.0%– 95.6%208109180Lexus LBX10.0%– 90.9% –320.0%+ 6.7%185158181Maxus MIFA 710.0%new132590.0%new167 –182Mercedes V-Class10.0%– 66.7%18190.0%– 76.9%209169183MG Cyberster10.0%– 92.3%163110.0%– 15.4%207177184Subaru Crosstrek10.0%– 87.5%146580.0%– 64.6%169119185Toyota GR 8610.0%– 90.0% –970.0%+ 76.4%145159186VW T-Cross10.0%– 66.7% –40.0%– 63.6%222187
Source: GAIKINDO


More Stories
2027 Kia EV3 Heads to the U.S. With Up to 320 Miles of Range and a Smart New Entry Point for EV Buyers
Kia is finally bringing the EV3 to the United States, and it looks like the brand may have found a...
France March 2026: Dacia Sandero, Tesla Model Y and Renault Clio VI in photo finish
First podium finish at home for the Renault Clio VI. For the first time since last October, the French new...
Hyundai Boulder Concept Hints at a Real Midsize Body-on-Frame Truck Coming Soon
Hyundai has spent years proving it can build just about everything except the one vehicle many shoppers still associate with...
When to Replace Your Car’s Brake Pads?
Brake pads wear down gradually, which is why many drivers don’t realize there’s an issue until braking performance noticeably changes....
Complete Guide to Powerstroke Delete Kits in 2026
Ford Powerstroke diesel engines have long set benchmarks for power, durability, and towing capability. From the early 6.0L to the...
Transformative Solo Travel: How One Trip Changed My Daily Habits and Mindset
Solo travel has quietly become one of the most powerful tools for personal reinvention. Search interest in “solo travel” hit...