
Netherlands October 2025: Skoda smashes share record, places Elroq at #1
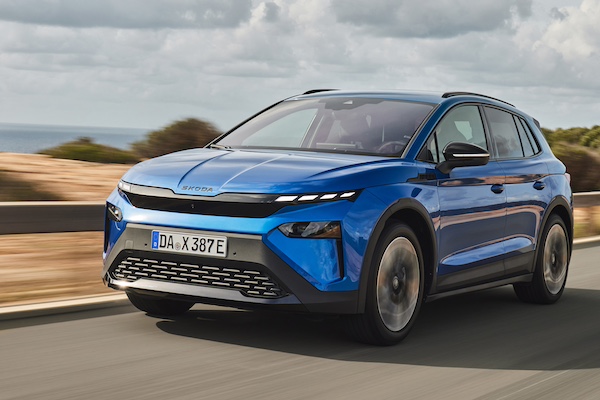
The Skoda Elroq is the best-selling vehicle in the Netherlands in October.
34,724 new cars hit Dutch roads in October, a 8.3% year-on-year improvement. The year-to-date volume remains in negative however at -1.8% to 304,674. HEVs account for 46.6% of the market with 16,198 sales, BEVs are at a splendid 40.2% share thanks to 13,968 sales, Petrol is at 12.1% share (4.208 sales), Diesel at 0.5% share (188) and LPG at 0.5% also (161).
Volkswagen (+9.4%) both leads the way and crosses the 10% share milestone for the first time since last November. As a result, the German carmaker advances to #2 year-to-date, passing Toyota which is down -0.6% to #4 for the month. Skoda (+49.7%) surges to #2 with 9.7% share. This is by far the brand’s new record share, eclipsing its previous best of 8.5% reached in May 2021. Meanwhile Kia (+5.5%) is down one spot on last month to #3 but remains firmly in the lead year-to-date. Other great performers below include Audi (+31.9%), Hyundai (+19.3%) and Renault (+17.2%).
Over in the models charts, the new Skoda Elroq delivers its 2nd ever win after last May with 5.1% share, more than double the #2, the Kia Picanto (+11.7%) at 2.4%. Leader year-to-date, the Kia EV3 (+2260%) rallies back up 12 spots on September to #3. The VW Tiguan (-13.2%) is up five ranks to #4 while the September top seller, the Tesla Model Y (-2.8%) limits its fall to #5. Excellent results for the VW ID.3 (+87.1%) and Toyota Yaris Cross (+52.4%) in the remainder of the Top 10.
Previous month: Netherlands September 2025: Toyota and Tesla Model Y on top
One year ago: Netherlands October 2024: Volkswagen scores first win this year
Full October 2025 Top 59 All brands and Top 319 All models below.
Netherlands October 2025 – brands:
PosBrandOct-25%/24Sep2025%/24PosFY241Volkswagen3,60310.4%+ 9.4%323,4737.7%+ 18.9%252Skoda3,3849.7%+ 49.7%520,4996.7%+ 22.5%463Kia3,0488.8%+ 5.5%231,78610.4%+ 5.3%114Toyota2,2896.6%– 0.6%122,3227.3%– 11.0%335Renault1,8865.4%+ 17.2%418,4246.0%+ 26.5%596Audi1,7845.1%+ 31.9%1212,4074.1%+ 15.7%11117Hyundai1,6924.9%+ 19.3%914,4144.7%– 13.1%888Volvo1,6074.6%– 31.5%1015,1475.0%– 42.6%729BMW1,5674.5%– 6.9%718,3906.0%+ 2.7%6710Peugeot1,4614.2%– 19.9%1312,4664.1%– 6.9%101011Ford1,3593.9%– 5.4%1112,8934.2%+ 21.8%91312Mercedes1,1753.4%– 1.0%811,8853.9%+ 3.9%121213Opel9772.8%+ 42.8%148,4672.8%+ 21.4%141414Dacia9722.8%+ 47.9%165,5171.8%+ 4.4%171615Citroen6822.0%+ 98.3%196,4252.1%+ 75.3%152116Tesla6451.9%– 47.9%610,7543.5%– 49.3%13417Mini5851.7%+ 18.2%175,0291.7%+ 13.8%181818Seat5761.7%+ 30.6%234,0821.3%– 14.5%201919Mazda5651.6%+ 37.8%224,5511.5%– 19.4%191720Cupra5631.6%+ 114.1%183,7971.2%+ 128.3%212821Suzuki4991.4%– 29.9%155,8211.9%– 25.0%161522BYD3991.1%+ 47.8%203,2021.1%+ 30.7%232423Polestar2980.9%+ 62.8%212,2510.7%+ 39.0%273024Fiat2730.8%+ 70.6%281,8190.6%– 48.4%312325Lynk & Co2460.7%+ 846.2%272,2950.8%+ 41.7%263126Land Rover2430.7%+ 6.6%262,9731.0%+ 8.2%252527Nissan2350.7%– 47.7%243,3891.1%– 23.4%222028Porsche1930.6%– 41.5%322,2380.7%– 7.7%282729Mitsubishi1900.5%– 48.5%252,9891.0%– 20.7%242230Xpeng1760.5%+ 38.6%359250.3%+ 4.0%343231MG1700.5%+ 6.9%312,0090.7%+ 8.0%292932Jeep1650.5%– 35.0%341,9150.6%– 26.5%302633Zeekr1610.5%+ 64.3%301,1340.4%+ 58.8%323634Leapmotor1600.5%new298000.3%new365035Honda1180.3%+ 13.5%387480.2%– 26.2%373336Alfa Romeo1110.3%+ 258.1%378370.3%+ 191.6%353837Lexus1030.3%– 29.9%331,0420.3%+ 15.9%333438Jaecoo810.2%new361590.1%new43 –39Smart730.2%– 48.6%394620.2%– 38.4%393540Dongfeng620.2%new405060.2%new384241DS390.1%– 31.6%453680.1%– 29.4%403742Alpine210.1%+ 950.0%421940.1%+ 781.8%415843NIO190.1%+ 72.7%411370.0%– 40.9%443944Lancia150.0%– 11.8%521210.0%+ 195.1%454645Lamborghini150.0%+ 400.0%47980.0%+ 100.0%475346Omoda150.0%new44260.0%new57 –47Abarth120.0%+ 1100.0%49630.0%+ 43.2%485148Bentley100.0%+ 100.0%461840.1%+ 201.6%424549Ferrari100.0%+ 150.0%481070.0%+ 25.9%464350SsangYong/KGM100.0%+ 42.9%43490.0%+ 22.5%504751Voyah70.0%n/a54370.0%+ 146.7%546052Lotus50.0%+ 25.0%50390.0%– 70.0%524153Rolls Royce40.0%+ 33.3%59180.0%– 25.0%605954Aston Martin30.0%+ 50.0%56240.0%– 29.4%585555Subaru20.0%– 85.7%51460.0%– 30.3%514956Lucid20.0%+ 0.0%53390.0%– 2.5%535457Maserati20.0%n/a55220.0%+ 0.0%595758Fisker20.0%n/a –20.0%– 97.0%634859Hongqi10.0%– 50.0%58260.0%– 36.6%565260Jaguar00.0%– 100.0%57520.0%– 40.9%494461Morgan00.0%– 100.0%6060.0%– 53.8%616162Vinfast00.0%– 100.0% –50.0%– 81.5%625663Aiways00.4%+ 3750.0% –1730.1%+ 12.3%5540 –Others1540.4%+ 23.2% –2,9081.0%+ 28.7% – –
Netherlands October 2025 – models:
PosModelOct-25%/24Sep2025%/24PosFY241Skoda Elroq1,7725.1%new37,4662.5%new3 –2Kia Picanto8492.4%+ 11.7%28,2562.7%+ 22.2%263Kia EV37082.0%+ 2260.0%158,7202.9%+ 28966.7%12354VW Tiguan6521.9%– 13.2%94,2801.4%+ 95.0%11285Tesla Model Y6171.8%– 2.8%16,6112.2%– 49.7%416Toyota Yaris Cross5821.7%+ 52.4%45,4891.8%+ 4.4%6107Volvo XC40/EX405821.7%– 30.0%124,2891.4%– 49.4%1058Hyundai Kona5791.7%– 21.3%143,7581.2%– 35.2%1689Kia Niro5121.5%– 26.8%185,6701.9%– 42.6%5210VW ID.35091.5%+ 87.1%262,2920.8%+ 68.0%346311Toyota Aygo X5071.5%+ 8.6%75,2561.7%– 15.6%7712VW ID.45031.4%+ 156.6%491,8540.6%+ 63.3%527413Skoda Kodiaq4681.3%– 9.1%174,4101.4%+ 92.7%92514Volvo EX304641.3%– 33.8%853,1331.0%– 64.4%23315Audi Q4 e-tron4591.3%– 19.3%452,8860.9%+ 4.1%271716Renault Clio4331.2%+ 19.9%53,6931.2%– 11.6%171417VW Golf4271.2%+ 4.9%402,7680.9%+ 45.6%293918Toyota Yaris4231.2%– 13.0%64,2791.4%– 10.2%121219Skoda Enyaq4171.2%– 24.0%322,0110.7%– 31.9%422220Ford Explorer EV4061.2%new522,3260.8%new33 –21Peugeot 2084051.2%– 41.4%223,9871.3%– 23.3%141122VW ID.74021.2%+ 237.8%471,7240.6%+ 113.6%569323Hyundai i103661.1%+ 73.5%213,3641.1%– 28.2%221324Ford Puma3571.0%+ 34.2%202,8510.9%+ 11.4%283525Ford Kuga3551.0%– 23.2%194,5621.5%+ 35.1%81826Renault 53541.0%+ 785.0%113,4951.1%+ 6890.0%2017727Citroen C33521.0%+ 133.1%363,7901.2%+ 172.3%156028Suzuki Swift3381.0%+ 35.2%133,4731.1%+ 64.2%214629VW Polo3331.0%– 55.1%103,6611.2%– 28.6%18930Opel Corsa3250.9%– 13.8%243,6511.2%+ 14.6%191631Dacia Bigster3110.9%new481,0710.4%new91 –32Peugeot 50082990.9%+ 398.3%581,6030.5%+ 134.7%6011733Audi A6 e-tron2960.9%new671,5120.5%new67 –34Peugeot 20082960.9%– 43.7%422,5360.8%– 22.5%321935Kia Sportage2900.8%– 17.1%352,6620.9%– 21.5%312036Hyundai Tucson2850.8%– 1.7%971,7550.6%– 30.6%533337Dacia Sandero2820.8%+ 38.2%781,4330.5%– 28.5%704338Mercedes CLA-Class2780.8%+ 256.4%331,4170.5%+ 19.4%719039Peugeot 30082580.7%– 6.5%601,9350.6%+ 32.1%486740Seat Leon2530.7%+ 204.8%771,5660.5%+ 44.3%649241Audi A32490.7%+ 41.5%632,0610.7%+ 13.0%385242Toyota Corolla Cross2480.7%– 25.7%1111,9190.6%– 31.1%493143VW Tayron2470.7%new571,5830.5%new62 –44BYD Seal U2450.7%+ 240.3%591,8650.6%+ 365.1%5112745Kia Stonic2410.7%– 13.6%542,1680.7%– 7.0%364246Volvo XC602410.7%+ 19.3%252,6830.9%– 14.5%302347Opel Frontera2390.7%new461,4050.5%new72 –48Audi Q6 e-Tron2370.7%+ 63.4%862,0110.7%+ 639.3%4112449BMW iX12320.7%– 38.1%293,0931.0%+ 3.3%242150Renault Scenic E-Tech2310.7%– 25.0%231,9870.7%+ 37.5%445151Hyundai Inster2190.6%new313,0881.0%new2529852Skoda Octavia2170.6%– 41.7%552,0480.7%– 51.9%391553Mini2160.6%– 32.9%642,1600.7%– 20.4%372754Seat Ibiza2120.6%+ 0.0%811,7400.6%– 7.7%554955Renault Captur2100.6%– 29.1%163,0541.0%+ 22.3%262956Renault Symbioz2090.6%+ 75.6%391,8690.6%+ 582.1%5014757Kia Ceed2030.6%– 46.6%622,2020.7%– 26.4%352658Mini Aceman1930.6%+ 9550.0%271,6100.5%+ 80400.0%5918959Opel Grandland X1890.5%+ 687.5%767810.3%+ 131.1%11516160Cupra Born1870.5%+ 27.2%301,0510.3%– 0.6%937861Skoda Kamiq1870.5%+ 0.0%681,5010.5%– 23.1%684162Dacia Duster1850.5%– 16.3%981,1550.4%+ 0.8%866863Toyota C-HR1830.5%– 25.6%381,9880.7%– 2.6%433664Nissan Qashqai1770.5%– 30.3%371,5900.5%– 28.0%614065Mini Countryman1760.5%+ 2.9%711,2660.4%– 14.5%816466BMW 5-Series1710.5%– 3.9%611,9810.7%+ 56.6%457067Peugeot 3081690.5%– 1.2%891,6960.6%– 17.7%575068Citroen C3 Aircross1640.5%n/a561,0280.3%+ 163.6%9516969Renault 41640.5%new1153760.1%new170 –70Audi Q51620.5%+ 1925.0%1064520.1%+ 67.4%15118371Polestar 21600.5%+ 60.0%511,3040.4%– 2.7%787372Toyota RAV41570.5%+ 127.5%501,3620.4%+ 39.7%769873BMW X11540.4%+ 21.3%531,9650.6%– 14.3%464474BMW i51520.4%+ 3.4%1099160.3%– 17.9%1018275Lynk & Co 011520.4%+ 484.6%961,9360.6%+ 19.5%477176BMW X51500.4%– 3.2%441,1980.4%+ 2.8%848877Mazda 6e1490.4%new2662020.1%new207 –78Fiat Grande Panda1440.4%new835960.2%new136 –79Jeep Avenger1440.4%– 33.3%1001,3880.5%– 36.9%754580Skoda Fabia1440.4%– 52.6%341,2170.4%– 31.1%834781Audi A51410.4%+ 984.6%909290.3%+ 196.8%9916882Mazda CX-601390.4%+ 348.4%1297740.3%+ 53.6%11714183Toyota Corolla1370.4%– 6.8%431,2910.4%– 33.4%795384BMW X31360.4%+ 806.7%281,7460.6%+ 353.5%5416285Xpeng G61270.4%+ 76.4%1236420.2%+ 182.8%13115486Dacia Jogger1260.4%– 22.7%1191,0630.3%– 33.1%926287Mercedes EQB1250.4%– 57.5%701,3130.4%+ 2.1%776988Renault Austral1250.4%+ 9.6%651,3960.5%– 13.3%745589Cupra Tavascan1190.3%+ 750.0%798010.3%+ 2327.3%11220590Mercedes GLC-Class1190.3%+ 22.7%411,3980.5%+ 20.0%738991Polestar 41190.3%+ 158.7%728220.3%+ 478.9%11019092Suzuki Vitara1190.3%– 11.9%931,5160.5%– 17.4%665893BMW 1-Series1180.3%– 7.1%691,5450.5%+ 30.4%657994Volvo V601180.3%– 60.0%952,0340.7%– 36.6%402495Opel Astra1160.3%– 19.4%1081,5720.5%– 8.6%635996Mercedes GLA-Class1130.3%+ 222.9%927830.3%+ 68.4%11415097BMW i41120.3%– 6.7%821,2200.4%– 26.7%825498Ford Capri1110.3%+ 246.9%1365510.2%+ 1621.9%14024699BMW 3-Series1090.3%– 28.8%731,4840.5%– 30.8%6948100Alfa Romeo Junior 1060.3%+ 381.8%1326880.2%+ 1276.0%125238101Kia EV41050.3%new1211720.1%new217 –102Mazda CX-301050.3%+ 10.5%1187570.2%– 14.8%119101103Cupra Terramar1020.3%+ 537.5%881,0150.3%+ 6243.8%97269104Zeekr 7X1020.3%new995810.2%new137 –105Range Rover Sport1000.3%+ 11.1%1371,0220.3%+ 17.9%96107106Renault Megane E-Tech940.3%– 28.8%841,0380.3%– 32.8%9465107VW Taigo910.3%– 56.5%1206820.2%– 46.4%12661108Mercedes EQA880.3%– 37.6%751,1130.4%– 0.2%8980109Citroen C4 860.2%+ 377.8%1148190.3%+ 13.3%111115110Opel Mokka860.2%+ 21.1%1128590.3%– 17.6%10697111Mitsubishi ASX850.2%+ 25.0%1259020.3%+ 12.2%102113112VW Caddy840.2%n/a1303620.1%+ 905.6%172292113Mazda 3830.2%+ 72.9%1684250.1%– 10.1%159135114Skoda Superb830.2%+ 10.7%878240.3%– 16.9%10994115Seat Arona820.2%– 4.7%1544320.1%– 32.6%158114116Jaecoo 7810.2%new1102700.1%new184 –117VW Passat810.2%– 28.9%1166140.2%+ 37.1%132130118Cupra Formentor800.2%+ 122.2%1464520.1%+ 45.8%152170119Porsche Macan800.2%– 61.7%1498950.3%+ 141.9%104146120Volvo C40/EC40800.2%– 49.0%1396100.2%– 47.0%13385121Leapmotor T03790.2%new1024720.2%new149285122Cupra Leon750.2%+ 50.0%1734750.2%+ 92.3%148182123Hyundai i20750.2%+ 47.1%1387320.2%– 42.0%12387124Mercedes A-Class750.2%– 12.8%661,1550.4%– 14.6%8775125Land Rover Defender730.2%+ 247.6%1287740.3%+ 42.0%116142126Mercedes C-Class700.2%+ 37.3%919250.3%+ 8.6%100109127Dacia Spring680.2%– 1.4%807430.2%+ 35.8%12196128VW T-Cross680.2%– 63.8%1051,1540.4%– 21.0%8856129VW T-Roc680.2%– 69.6%741,2730.4%– 41.6%8032130Mazda 2660.2%– 9.6%941,1060.4%– 34.6%9057131Audi A6650.2%+ 54.8%1404220.1%– 7.7%161152132Kia EV6640.2%– 70.8%1278980.3%– 64.4%10338133Ford Focus630.2%– 78.6%1481,6160.5%– 45.6%5830134Citroen C5 Aircross620.2%– 24.4%2494410.1%– 22.2%154132135Dongfeng Box620.2%new1675040.2%new146245136Porsche Cayenne610.2%– 17.6%1636810.2%– 48.2%12784137Fiat 600580.2%– 26.6%1616760.2%+ 49.9%128139138BMW IX2570.2%– 31.3%1267110.2%+ 14.3%124122139VW ID.Buzz570.2%+ 714.3%1703620.1%+ 214.8%173229140Hyundai Santa Fe560.2%+ 43.6%1724030.1%+ 102.5%163199141Lynk & Co 02560.2%new1582320.1%new195 –142Mitsubishi Outlander540.2%n/a1037700.3%n/a118 –143Mercedes E-Class530.2%– 32.1%1077940.3%+ 15.7%113116144MG ZS520.1%+ 85.7%1446730.2%+ 145.6%130180145Volvo EX90520.1%new1428390.3%new108273146Hyundai Ioniq 5510.1%+ 121.7%1047430.2%+ 24.5%122126147Skoda Scala500.1%– 65.5%1175980.2%– 45.8%13586148Volvo XC90500.1%– 55.8%1011,1630.4%+ 13.6%8595149Honda Jazz490.1%+ 122.7%2052090.1%+ 5.0%203204150Xpeng G9490.1%– 5.8%1872640.1%– 57.2%186123151BYD Sealion 7480.1%+ 1100.0%1571840.1%+ 4500.0%212338152MG 3480.1%+ 14.3%1434390.1%+ 20.9%156159153Skoda Karoq460.1%– 59.3%1534400.1%– 69.1%15572154Renault Espace450.1%– 30.8%1136750.2%– 18.3%129110155Fiat Panda440.1%+ 57.1%2322580.1%– 17.8%189176156Mercedes EQS440.1%+ 2100.0% –870.0%+ 24.3%249254157Mercedes GLE-Class440.1%– 6.4%1455010.2%+ 45.6%147166158Leapmotor C10430.1%new1472620.1%new187339159VW Multivan430.1%n/a1553810.1%– 32.6%168140160Audi Q2420.1%– 36.4%1765430.2%– 15.9%141119161Toyota bZ4X420.1%– 72.5%1566020.2%– 18.6%134103162Lexus LBX400.1%– 61.5%1334470.1%– 9.1%153134163Audi Q3390.1%+ 2.6%2592240.1%– 74.7%197106164Leapmotor B10380.1%new179620.0%new266 –165Lynk & Co 08380.1%new1591260.0%new232 –166Suzuki SX4 S-Cross370.1%+ 42.3%1417550.2%– 15.7%120108167Kia Sorento360.1%+ 20.0%1783200.1%– 25.9%179155168Mercedes Vito350.1%+ 218.2%2033510.1%+ 63.3%175192169Audi Q8340.1%– 46.0%1514710.2%+ 51.0%150165170MG S5340.1%new1911110.0%new240 –171Zeekr 001340.1%– 20.9%1522610.1%– 37.4%188138172Ford Mustang Mach-E330.1%– 26.7%1243900.1%– 31.7%165125173Ford Tourneo/Transit Custom330.1%+ 17.9%1645300.2%+ 1372.2%143247174BMW iX320.1%+ 220.0%1712570.1%+ 14.7%190197175Audi A1310.1%– 61.7%1225730.2%– 28.8%139111176BMW 2-Series Gran Coupe300.1%– 43.4%1315780.2%+ 67.1%138174177Kia EV9300.1%– 65.1%1985400.2%– 40.7%142102178Nissan Juke300.1%– 72.2%1749720.3%– 22.5%9877179Smart #3300.1%– 45.5%1901770.1%– 43.3%215164180Seat Ateca290.1%– 48.2%1863420.1%– 14.9%177156181Honda HR-V280.1%– 26.3%1972150.1%– 22.7%201185182MG HS280.1%+ 250.0%1822370.1%+ 2270.0%194303183Smart #5280.1%new221870.0%new250 –184Lexus NX270.1%+ 50.0%1802520.1%+ 113.6%191220185Mitsubishi Colt270.1%– 74.3%1358490.3%+ 17.9%107118186BYD Dolphin Surf260.1%new200850.0%new254 –187BYD Seal260.1%– 46.9%1602960.1%– 32.1%181148188Fiat 500260.1%– 36.6%2092640.1%– 90.1%18537189Mercedes EQE260.1%– 10.3%1852080.1%– 49.9%206158190Peugeot 408260.1%– 66.2%1835210.2%+ 13.8%145153191Audi Q7250.1%– 10.7%1842080.1%+ 32.5%205207192Mercedes Sprinter250.1%– 71.3%1625240.2%– 3.3%144131193Range Rover Evoque250.1%– 41.9%1654230.1%+ 22.6%160167194Zeekr X250.1%– 54.5%2042920.1%– 1.7%183172195Hyundai Bayon240.1%+ 4.3%2012920.1%– 64.0%182112196Tesla Model 3240.1%– 96.0%84,1121.3%– 47.6%134197DS No.4230.1%new –250.0%new303 –198Porsche Panamera230.1%+ 53.3%1931940.1%+ 16.9%209210199Mercedes B-Class220.1%– 35.3%1993650.1%– 24.4%171145200Volvo V90220.1%– 21.4%1343840.1%+ 114.5%167200201BMW X2210.1%+ 10.5%2161780.1%– 38.8%214184202BYD Atto 2210.1%new1771350.0%new230309203Hyundai Ioniq 6210.1%– 44.7%2061370.0%– 73.8%227137204VW California210.1%+ 950.0%2081460.0%+ 135.5%222263205BMW 2-Series Tourer200.1%– 23.1%1663780.1%+ 11.2%169163206Porsche 911/Carrera200.1%+ 66.7%2113300.1%+ 7.5%178181207Range Rover 200.1%– 56.5%1943870.1%– 37.2%166129208Renault Rafale 200.1%– 33.3%1503450.1%+ 141.3%176186209Alpine A290190.1%new1951810.1%new213393210BMW 4-Series190.1%+ 0.0%1963080.1%– 25.1%180157211Mazda CX-80190.1%– 26.9%1812320.1%+ 603.0%196248212Honda Civic 180.1%– 25.0%294690.0%– 65.2%260206213Lexus UX180.1%+ 200.0%228880.0%+ 35.4%247253214Polestar 3170.0%– 54.1%1921260.0%– 7.4%233211215BYD Seal 6160.0%new175430.0%new275 –216Honda CR-V150.0%+ 66.7%2391950.1%+ 13.4%208213217Lancia Ypsilon150.0%– 11.8%2641210.0%+ 195.1%236255218Omoda 9150.0%new213390.0%new281 –219Smart #1150.0%– 82.8%2361890.1%– 56.8%211143220BMW 7-Series140.0%+ 180.0%2481050.0%+ 4.0%243241221Hyundai Ioniq 9140.0%new219520.0%new270 –222Lamborghini Urus140.0%+ 600.0%240780.0%+ 160.0%256300223Nissan Ariya140.0%– 57.6%2524190.1%– 1.9%162144224Nissan X-Trail130.0%– 45.8%2351580.1%– 21.8%220194225BYD Atto 3120.0%– 85.5%1694350.1%– 59.6%15791226Mitsubishi Eclipse Cross120.0%– 86.0% –2090.1%– 76.8%204104227Mitsubishi Grandis120.0%new –120.0%new338 –228Opel Combo120.0%n/a253280.0%+ 47.4%296320229BMW X7110.0%n/a262390.0%+ 14.7%280283230DS 7 Crossback110.0%– 8.3%2262200.1%+ 69.2%199223231Mercedes EQE SUV110.0%– 73.8%1882230.1%– 45.2%198151232Mercedes G-Class110.0%– 42.1%2021580.1%+ 315.8%219275233Mercedes GLB110.0%– 15.4%2341060.0%– 12.4%241227234VW Touareg110.0%– 45.0%2371330.0%– 18.4%231209235BMW XM100.0%– 41.2%2171720.1%– 23.2%216196236Citroen C4 X100.0%+ 42.9%225790.0%– 38.8%255225237Kia Xceed100.0%– 16.7%220860.0%– 67.4%252188238Opel Vivaro100.0%– 84.1%2691590.1%– 28.7%218187239Ssangyong Torres100.0%+ 42.9%215490.0%+ 69.0%273267240Land Rover Discovery Sport90.0%– 55.0%2332160.1%+ 2.9%200201241Lexus RZ90.0%+ 80.0%2101240.0%+ 110.2%235256242Nio Firefly90.0%new308240.0%new306 –243Porsche Taycan90.0%– 50.0%2141180.0%– 45.1%237198244Range Rover Velar90.0%+ 0.0%2291400.0%– 15.2%224214245Abarth 50080.0%+ 700.0%256300.0%– 31.8%292274246Bentley Continental80.0%+ 166.7%2241360.0%+ 444.0%229291247BMW 2-Series80.0%+ 100.0%231860.0%– 27.1%251230248Honda ZR-V80.0%– 11.1%295560.0%+ 9.8%267270249Jeep Grand Cherokee80.0%+ 300.0%244430.0%+ 290.9%277331250Nio ET580.0%+ 166.7%189550.0%+ 1.9%268262251Jeep Wrangler70.0%+ 133.3%222880.0%+ 158.8%246294252Mercedes EQS SUV70.0%– 12.5%267710.0%– 48.2%258224253Mercedes S-Class70.0%– 30.0%2231060.0%– 24.8%242221254Ferrari 29660.0%+ 200.0%243430.0%+ 53.6%276301255Lexus ES60.0%+ 200.0%241380.0%– 11.6%282280256Voyah Courage60.0%new28080.0%new350 –257Alfa Romeo Tonale50.0%– 37.5%2571370.0%– 34.1%226203258Jeep Renegade50.0%– 37.5%2451560.1%+ 26.8%221226259Lotus Eletre50.0%+ 66.7%251210.0%– 81.3%311234260Mercedes CLE-Class50.0%– 44.4%2121370.0%+ 0.7%228222261MG 450.0%– 87.8%2463610.1%– 56.3%174100262Peugeot 50850.0%– 58.3% –490.0%– 68.2%272215263Suzuki Swace50.0%+ 0.0%270530.0%– 27.4%269250264Toyota Proace50.0%n/a271490.0%– 51.5%274242265Abarth 60040.0%new274330.0%new288 –266Audi e-Tron GT40.0%+ 100.0%230490.0%+ 63.3%271299267BMW Z440.0%+ 300.0%238690.0%– 24.2%259244268Citroen C5 X40.0%– 63.6%218640.0%– 28.1%262243269Citroen Jumpy40.0%– 94.3%2501890.1%– 45.1%210173270Ferrari Roma40.0%+ 300.0% –140.0%– 12.5%328330271Mazda MX-3040.0%– 50.0%2071120.0%– 65.6%239178272Toyota Prius40.0%– 71.4%255630.0%– 54.3%263218273VW ID.540.0%– 80.0%272880.0%– 36.2%248216274BMW i730.0%– 57.1%260620.0%– 45.6%264232275BYD Dolphin30.0%– 94.5%2631240.0%– 74.2%234136276DS 3 Crossback30.0%– 90.0%277420.0%– 83.0%278195277Lexus RX30.0%– 75.0%227910.0%– 22.9%245233278Mercedes AMG Pure Speed30.0%new –30.0%new371 –279Alpine A11020.0%+ 0.0% –120.0%– 45.5%336316280Aston Martin Vanquish20.0%n/a –80.0%n/a347 –281BYD Tang20.0%– 60.0%287300.0%+ 7.1%294293282DS 420.0%– 86.7% –620.0%– 54.4%265219283Fisker Karma20.0%new –20.0%new380 –284Hyundai i3020.0%– 71.4%297970.0%– 47.0%244208285Mercedes V-Class20.0%– 33.3% –310.0%+ 14.8%291286286NIO EL820.0%n/a –140.0%+ 180.0%329355287Peugeot Expert20.0%– 33.3% –1170.0%+ 160.0%238268288Subaru Forester20.0%+ 0.0%313230.0%+ 187.5%309335289Tesla Model S20.0%+ 100.0%315220.0%– 81.2%310231290Tesla Model X20.0%+ 100.0% –320.0%– 68.9%289239291Aston Martin DB1210.0%+ 0.0%28190.0%– 67.9%342306292Bentley Bentayga10.0%+ 0.0%284200.0%– 23.1%314305293Bentley Flying Spur10.0%+ 0.0%285260.0%+ 160.0%299344294BMW 8-Series10.0%n/a286300.0%– 16.7%293289295BMW iX310.0%– 97.5%2762110.1%– 67.7%202121296BMW X410.0%n/a –250.0%– 39.0%302279297BMW X610.0%– 50.0%261340.0%– 10.5%287281298Fiat Scudo10.0%– 88.9%290240.0%+ 20.0%305307299Ford Mustang10.0%n/a –30.0%+ 0.0%367368300Hongqi EHS710.0%new29690.0%new345 –301Jeep Compass10.0%– 96.0% –2380.1%– 1.2%193191302Lamborghini Revuelto10.0%n/a299160.0%+ 128.6%323352303Lucid Air10.0%n/a265380.0%+ 0.0%283278304Lucid Gravity 10.0%new –10.0%new400 –305Maserati Gran Turismo10.0%n/a –20.0%– 60.0%384358306Maserati Grecale10.0%n/a303120.0%+ 20.0%337333307Mercedes AMG GT10.0%+ 0.0%305250.0%+ 38.9%304319308MG Cyberster10.0%+ 0.0% –410.0%+ 1266.7%279359309Nissan Townstar10.0%+ 0.0%247140.0%+ 250.0%330360310Peugeot Rifter10.0%– 80.0%309170.0%– 26.1%321308311Renault Arkana10.0%– 99.2%2543960.1%– 67.8%16483312Rolls Royce Cullinan10.0%n/a –30.0%+ 50.0%372379313Rolls-Royce Ghost10.0%n/a –30.0%+ 200.0%373385314Rolls-Royce Phantom10.0%n/a –20.0%n/a389389315Rolls-Royce Spectre10.0%– 66.7%312100.0%– 50.0%341323316Toyota Proace City Verso10.0%n/a316280.0%+ 100.0%297329317Voyah Free10.0%n/a317270.0%+ 107.7%298324318VW Crafter10.0%– 66.7% –380.0%– 19.1%284258319VW Transporter10.0%n/a27360.0%– 71.4%354322
Source: BOVAG


More Stories
Ford GT Mk IV Storms the Nürburgring as America’s Fastest Gas-Powered Track Weapon
Ford has another major bragging right to hang in the performance hall of fame. The 800-plus-horsepower Ford GT Mk IV...
2027 Subaru Getaway Brings Three Rows, 420 HP, and Real Family EV Appeal
Subaru is stepping deeper into the EV space with something that feels a lot more aligned with what many American...
2027 Kia EV3 Heads to the U.S. With Up to 320 Miles of Range and a Smart New Entry Point for EV Buyers
Kia is finally bringing the EV3 to the United States, and it looks like the brand may have found a...
France March 2026: Dacia Sandero, Tesla Model Y and Renault Clio VI in photo finish
First podium finish at home for the Renault Clio VI. For the first time since last October, the French new...
Hyundai Boulder Concept Hints at a Real Midsize Body-on-Frame Truck Coming Soon
Hyundai has spent years proving it can build just about everything except the one vehicle many shoppers still associate with...
When to Replace Your Car’s Brake Pads?
Brake pads wear down gradually, which is why many drivers don’t realize there’s an issue until braking performance noticeably changes....