
New Zealand September 2025: Mitsubishi (+51.6%) at highest in over three years, sales up 19.1%
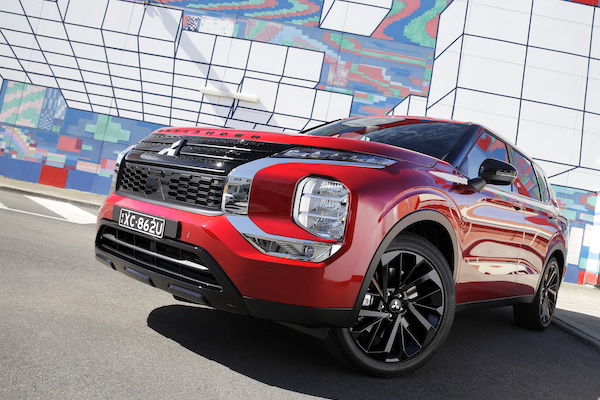
74% of all Mitsubishi Outlander sold in September were to rental companies.
New vehicle sales in New Zealand soar 19.1% year-on-year in September to a round 14,000 units, leading to a year-to-date tally up 7.4% to 100,795. Passenger cars (cars and SUVs) are up 20.8% to 10,364 while Light Commercials gain 19.3% to 3,078. Year-to-date, passenger cars are up 14.3% to 70,643 and light commercials are down -1% to 26,010.
Toyota (+20%) matches the market to a splendid 25.7% share, to be compared with 23.2% year-to-date. Mitsubishi surges 51.6% to 2nd place, reaching 15% share which is its best result since June 2022 (16.6%). Ford (-17.7%) struggles and falls to #3 and 9.8% share vs. 11% so far this year. Kia (+23.1%) and Mazda (+53.8%) outrun the overall growth rate to round out the Top 5 ahead of Hyundai (+16.9%), Suzuki (+14.5%) and MG (+11.3%) a little shyer. GWM (+58.4%) posts the largest gain in the Top 10 at #9 with Honda (+36%) also very strong at #10. Tesla is up 128% to #12 and newcomer Chery is up 8 spots on August to a record #13.
Model-wise, the Toyota RAV4 (+9.3%) cements its newfound YTD dominance with 9.2% share for the month, however 53% of it September volume comes from rentals. The Ford Ranger (-10.9%) is stuck in 2nd place with a disappointing result. In contrast the Mitsubishi Outlander is up 123.8% to #3 and 5.8% share, almost double the 3% it commands year-to-date. 74% of Outlander sold in September were to rental companies. Similarly the Mitsubishi ASX is up 112.4% to 5.8% share also, with 54% coming from rentals. The Toyota Hilux (+23.2%) is down two spots on last month to #5 ahead of the Toyota Corolla (+63.2%) and Ford Everest (+71.2%) both very dynamic. The new Chery Tiggo 4 Pro breaks into the Top 20 for the first time at #17.
Previous month: New Zealand August 2025: Rentals push Toyota RAV4 to first place YTD
One year ago: New Zealand September 2024: Rentals push Toyota up to 25.5% share
Full September 2025 Top 77 All brands and Top 20 models below.
New Zealand September 2025 – brands:
PosBrandSep-25%/24Aug2025%/24PosFY241Toyota3,60125.7%+ 20.0%123,34323.2%+ 13.6%112Mitsubishi2,09715.0%+ 51.6%310,40210.3%– 1.3%333Ford 1,3719.8%– 17.7%211,07511.0%– 14.1%224Kia1,0017.2%+ 23.1%47,0127.0%+ 8.5%445Mazda5233.7%+ 53.8%53,4173.4%+ 22.7%786Hyundai4213.0%+ 16.9%62,8932.9%– 8.1%1077Suzuki4193.0%+ 14.5%73,7353.7%– 9.3%658MG3752.7%+ 11.3%83,1273.1%+ 41.4%8119GWM3692.6%+ 58.4%102,8132.8%+ 20.4%111210Honda2531.8%+ 36.0%122,6152.6%+ 19.7%121011Volkswagen2461.8%– 18.3%161,7401.7%– 30.9%14912Tesla2281.6%+ 128.0%231,2451.2%+ 29.8%181813Chery2251.6%new214540.5%new279314Nissan2211.6%– 52.4%93,9373.9%+ 11.2%5615Mercedes2211.6%+ 8.9%111,6891.7%– 2.4%151416Isuzu2211.6%+ 34.8%131,4031.4%– 32.3%171317BYD1871.3%+ 122.6%202,8982.9%+ 370.5%92218BMW1841.3%+ 7.6%141,4101.4%+ 23.9%161619Subaru1741.2%+ 13.0%151,7811.8%+ 26.3%131520Audi1641.2%+ 80.2%179921.0%+ 17.5%212021LDV1411.0%+ 116.9%181,0271.0%+ 75.6%202622Lexus1341.0%+ 50.6%191,1541.1%+ 22.5%191723Mini870.6%– 3.3%287380.7%+ 20.2%242324Land Rover850.6%– 8.6%228700.9%– 1.1%222125Skoda800.6%– 28.6%267480.7%– 13.1%231926Jaecoo740.5%+ 221.7%257000.7%+ 614.3%254227Omoda700.5%+ 66.7%276170.6%+ 105.7%263328Fiat680.5%+ 58.1%383430.3%– 26.2%352529Volvo550.4%+ 41.0%313850.4%+ 22.6%343430Iveco530.4%+ 15.2%242840.3%– 1.0%363031Hino480.3%– 4.0%344160.4%– 5.5%312832Porsche450.3%– 18.2%324210.4%+ 1.4%303233Fuso440.3%– 24.1%294080.4%– 44.6%322434Leapmotor370.3%new351850.2%new427435Peugeot330.2%– 29.8%374420.4%– 2.2%282936Cupra300.2%– 53.8%302510.2%– 7.0%393637Mahindra290.2%+ 107.1%332590.3%– 20.3%383538Geely280.2%new54920.1%new53 –39Jeep260.2%+ 73.3%452230.2%+ 23.2%404540Scania210.2%– 62.5%362810.3%– 43.8%372741Renault210.2%+ 10.5%392060.2%+ 0.0%414342DAF210.2%+ 5.0%471130.1%– 48.6%483943CRRC210.2%n/a401110.1%+ 109.4%494944KGM/SSangyong200.1%– 31.0%413890.4%+ 13.4%333145Chevrolet190.1%– 32.1%421790.2%– 15.6%433846Ram180.1%+ 20.0%461730.2%– 11.3%444047UD Trucks180.1%+ 0.0%53970.1%– 39.8%504748Opel180.1%+ 260.0%69380.0%– 34.5%575049MAN150.1%+ 275.0%55490.0%+ 4.3%555350Kenworth130.1%– 43.5%501670.2%– 23.0%464151Volvo Trucks130.1%– 69.8%511650.2%– 47.9%473752Jaguar120.1%– 67.6%491690.2%– 3.4%454653Foton110.1%– 52.2%52950.1%– 28.6%514854JAC90.1%n/a43930.1%+ 1228.6%526855Maserati80.1%+ 300.0%59370.0%+ 32.1%585956GMC80.1%new56280.0%new63 –57Ineos70.1%+ 133.3%63390.0%– 15.2%565458Bentley70.1%n/a61250.0%+ 13.6%646259Zhongtong50.0%+ 400.0%64230.0%+ 283.3%657060Polestar40.0%– 89.5%444360.4%+ 272.6%294461Aston Martin40.0%+ 0.0%68360.0%+ 16.1%596062Ferrari40.0%+ 33.3%60320.0%+ 6.7%625863Smart40.0%new –190.0%new66 –64King Long40.0%n/a –50.0%n/a79 –65Citroen20.0%+ 0.0%58330.0%– 26.7%615566McLaren20.0%+ 100.0% –80.0%– 11.1%756967Alfa Romeo10.0%– 50.0%48700.1%+ 18.6%545168Lamborghini10.0%– 50.0%57360.0%+ 28.6%605669Yamaha10.0%n/a71160.0%+ 6.7%686570Freightliner10.0%n/a72110.0%+ 83.3%697571International10.0%+ 0.0%65110.0%– 42.1%706472Sinotruk10.0%– 66.7% –100.0%– 70.6%725773Lotus10.0%+ 0.0%6280.0%– 50.0%736774Mack10.0%– 50.0%6680.0%– 69.2%746375Genesis10.0%n/a –30.0%n/a81 –76Sitrak10.0%n/a7520.0%n/a84 –77Juneyao10.0%new –10.0%new89 –
New Zealand September 2025 – models:
PosModelSep-25%/24Aug2025%/24PosFY241Toyota RAV41,2819.2%+ 9.3%17,5027.4%+ 18.9%122Ford Ranger 8275.9%– 10.9%27,0287.0%– 19.5%213Mitsubishi Outlander8105.8%+ 123.8%63,0633.0%+ 21.3%564Mitsubishi ASX8055.8%+ 112.4%53,6483.6%+ 37.3%455Toyota Hilux7695.5%+ 23.2%36,4756.4%+ 14.2%336Toyota Corolla4343.1%+ 63.2%111,2801.3%+ 13.5%16127Ford Everest3632.6%+ 71.2%42,0762.1%+ 39.1%8108Mitsubishi Triton3422.4%+ 26.7%82,5462.5%– 28.2%749Kia Seltos2581.8%– 30.3%72,7282.7%+ 14.9%6710Toyota Hiace2331.7%+ 102.6%91,5261.5%+ 8.0%111511Hyundai Tucson2181.6%n/a151,0741.1%n/a19n/a12Toyota Yaris Cross2121.5%– 44.8%10n/an/an/an/a1313MG ZS2071.5%+ 73.9%121,5291.5%+ 32.6%101814Tesla Model Y1901.4%n/an/an/an/an/an/an/a15Kia Sportage1741.2%+ 11.5%n/an/an/an/an/a1416GWM Haval H61681.2%n/a141,2931.3%n/a14n/a17Chery Tiggo 4 Pro1581.1%newn/an/an/anewn/a –18Kia Stonic1551.1%+ 86.7%231,0501.0%– 18.4%201719Toyota Yaris1541.1%n/an/an/an/an/an/an/a20Toyota Prado1461.0%n/a221,2861.3%n/a15n/an/aSuzuki Swift1320.9%– 25.8%191,4361.4%– 32.5%138n/aToyota Corolla Cross1290.9%+ 76.7%171,0851.1%+ 12.3%1821n/aFord Transit1290.9%– 3.0%189550.9%– 19.0%n/a19n/aIsuzu D-Max1260.9%+ 70.3%n/a6980.7%– 34.4%n/an/an/aMazda CX-51150.8%– 25.3%211,1741.2%+ 0.7%1716n/aMercedes Sprinter910.7%– 25.4%135080.5%– 8.0%n/an/an/aNissan Navara870.6%– 40.8%162,0612.0%+ 32.5%911n/aBYD Shark 6800.6%newn/a1,5041.5%new12 –n/aNissan X-Trail620.4%n/an/a1,0141.0%n/a21n/an/aKia Tasman560.4%newn/a2430.2%newn/a –
Source: MIA

More Stories
Colombia February 2025: Kia Picanto repeats at #1, sales up 49.5%
The Kia Picanto is once again the most popular vehicle in Colombia. New vehicle sales in Colombia continue to surge,...
The Winner of Our Exciting Smallest Cog Goodies Bundle Competition!
Thank you for everyone that entered our Smallest Cog Goodies Bundle competition. Congratulations to our Smallest Cog Goodies Bundle competition...
Toyota’s Warning Shot Shows How Fast the Auto Industry Is Changing
Toyota is not a company that usually talks like it is on the ropes, which is exactly why this latest...
2026 Ram 1500 America250 Editions Turn Big Horn, Laramie, and Rebel Into Patriotic Special Trucks
Ram is leaning hard into Americana for the 2026 model year with a new batch of special-edition 1500 pickups created...
Wrongful Death After a Car Accident: Legal Rights of the Family
Car accidents have a devastating impact on one’s life. Even if you drive carefully, you have little control over other...
The Next Toyota Celica Rumored to Return as a Hybrid AWD Coupe
Toyota’s long-rumored Celica revival is starting to sound a lot more real, and a lot more modern, than many enthusiasts...