
Israel September/Q3 2025: Chinese manufacturers hold 49.5% share
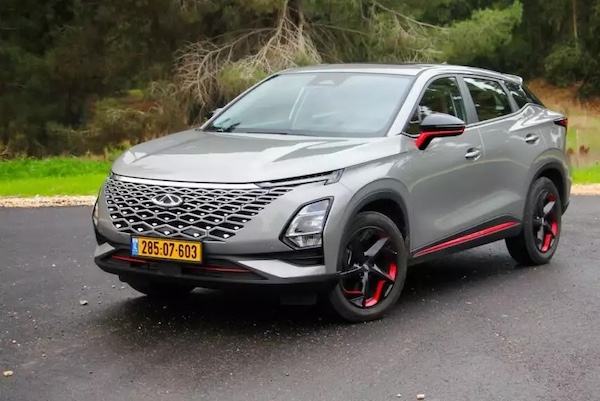
The Chery FX is the best-selling vehicle in Israel over Q3.
Thanks to our local partner cartube.co.il we can share with you today brands and models ranking for Israel over September and Q3 respectively. Volumes are up 28.8% year-on-year this month to 29,299, meaning the year-to-date tally is now up 6.9% to 242,037. Chery (+147.4%) spectacularly threepeats at #1 with a mammoth 11.9% share for the month. It distances Toyota (-14.7%) and BYD (+5.7%) while Jaecoo (+427.5%) surges to #4 with 7.7% share, its best score since last May.
Tesla (+83.8%) is back up 23 ranks on last month to #8 and 4.4% share, the carmaker’s highest result of the year so far. Dongfeng soars 40 ranks on August to break into the Top 10 for the first time at #9 while Lynk & Co (+612.5%) is up 28 to #10. Newcomer Deepal is up 15 spots to #11 and EVEasy (+1355.3%) is up 43 to #13. All in all, Chinese manufacturers hold a record 49.5% of the Israeli new car market in September.
Looking at the models charts over Q3, the Chery FX (+90.6%) takes the lead, edging past the Jaecoo J7 (+622.4%) with the Hyundai Kona (+31.2%) completing the podium. The BYD Seal U (+8506.5%) is up to #4 vs. #13 year-to-date, distancing the Chery Tiggo 8 Pro (+100.8%) and Kia Picanto (+135.5%). The BYD Atto 3 (-1.8%) points its bonnet at #7 over the period but ranks #3 in September, just as the new Dongfeng Box manages a splendid 4th place in September, ranking #17 over Q3.
Previous month: Israel August 2025: Chery repeats at #1, breaks share record again
One year ago: Israel September/Q3 2024: Xpeng breaks into Top 10 with 3.9% share
Full September 2025 Top 65 All brands and Q3 2025 Top 291 All models below.
Israel September 2025 – brands:
PosBrandSep-25%/24Aug2025%/23PosFY241Chery3,48311.9%+ 147.4%120,9128.6%+ 107.6%372Toyota2,5958.9%– 14.7%228,49411.8%+ 3.3%113BYD2,4048.2%+ 5.7%511,5744.8%– 23.7%754Jaecoo2,2637.7%+ 427.5%813,1135.4%+ 1952.1%6355Kia1,9696.7%+ 25.3%420,1708.3%– 7.3%436Hyundai1,9576.7%– 9.6%327,40211.3%+ 15.1%227Skoda1,4214.8%– 15.2%616,9127.0%+ 6.5%548Tesla1,2854.4%+ 83.8%313,6321.5%– 30.8%16119Dongfeng1,0983.7%new492,0280.8%new246810Lynk & Co7412.5%+ 612.5%382,6661.1%+ 536.3%224411Deepal6832.3%new261,5640.6%new326612Maxus5872.0%+ 2345.8%121,8220.8%+ 755.4%275013EVeasy5531.9%+ 1355.3%566690.3%+ 62.0%434214MG5291.8%+ 179.9%97,5233.1%+ 22.5%91215Renault5101.7%+ 2900.0%152,4861.0%– 35.9%231816Seat4461.5%– 49.4%145,7872.4%– 26.4%101017Mitsubishi4391.5%– 47.2%175,5362.3%– 40.5%11818Xpeng4231.4%– 52.4%105,4992.3%+ 108.2%131519Seres3901.3%+ 271.4%161,7200.7%+ 14.2%282820Volkswagen3521.2%– 44.6%232,8501.2%– 31.7%201421Citroen3151.1%– 8.4%193,7641.6%– 19.9%151322Geely2961.0%– 7.8%212,8411.2%– 21.4%211623BMW2861.0%+ 25.4%202,8631.2%+ 32.4%192424Nissan2780.9%+ 15.8%325,5012.3%+ 85.5%121925Suzuki2600.9%– 71.8%134,0101.7%– 45.4%14926Peugeot2570.9%+ 31.8%222,8821.2%– 12.8%182027Opel2310.8%+ 100.9%251,3180.5%– 2.5%373228Dacia2060.7%+ 142.4%361,5460.6%+ 25.0%333029Zeekr2000.7%– 0.5%301,5770.7%– 24.2%312330Subaru1900.6%– 56.8%243,4101.4%– 2.7%171731JAC1830.6%n/a535350.2%+ 287.7%485532Hongqi1750.6%+ 17400.0%407420.3%+ 1802.6%416233Smart1690.6%+ 225.0%181,0510.4%+ 17.4%383634Cupra1640.6%+ 88.5%351,4230.6%+ 4.2%363435Chevrolet1630.6%+ 126.4%437390.3%– 73.9%422136Audi1440.5%– 12.2%271,8860.8%– 8.3%262537Mercedes1320.5%+ 3.1%281,4700.6%– 53.3%342238Lexus1300.4%– 43.5%342,0040.8%+ 4.4%252639Leapmotor1240.4%n/a468390.3%+ 356.0%395140KGM1200.4%– 23.1%371,6660.7%+ 176.3%293841Ford1160.4%+ 19.6%415350.2%– 67.6%472942Volvo1100.4%– 23.1%331,6410.7%+ 14.4%302743Voyah1100.4%+ 340.0%294610.2%+ 85.9%494944Mazda1030.4%– 92.2%78,0233.3%– 36.2%8645Isuzu1000.3%+ 40.8%441,4230.6%+ 13.2%353346Mini800.3%+ 128.6%503830.2%+ 20.8%514847Fiat780.3%+ 116.7%545480.2%– 17.2%463948Skywell780.3%+ 100.0%423220.1%– 45.1%534049NIO720.2%new631400.1%new58 –50Honda430.1%– 33.8%473880.2%+ 33.8%504651Genesis380.1%+ 46.2%393720.2%– 41.5%524152Foton350.1%new572680.1%new556453Land Rover340.1%– 27.7%455870.2%+ 64.9%454554GAC340.1%n/a –340.0%n/a62 –55Jeep310.1%– 51.6%526510.3%– 9.8%443756Alfa Romeo230.1%+ 283.3%552790.1%+ 62.2%545457AvatR170.1%new48730.0%new59 –58Porsche150.1%+ 275.0%581790.1%+ 46.7%575359Cadillac100.0%+ 233.3%60560.0%– 35.6%605860IM Motors100.0%new –100.0%new68 –61Ora40.0%– 98.4%592600.1%– 82.4%563162Bentley30.0%n/a64170.0%+ 183.3%647163Alpine20.0%n/a –20.0%– 71.4%737364Ferrari10.0%+ 0.0% –100.0%+ 42.9%677265Yudo10.0%new6520.0%new72 –
Israel Q3 2025 – models:
PosModelQ3 2025%/24Q2Sep-25Aug-25Jul-251-9 2025%/24PosFY241Chery FX4,6385.6%+ 90.6%242,1612,1363417,0812.9%+ 39.7%372Jaecoo J74,6165.6%+ 622.4%12,2491,3101,05713,0755.4%+ 1946.2%1583Hyundai Kona2,8793.5%+ 31.2%27991,0411,03910,5034.3%+ 111.2%284BYD Seal U2,6683.2%+ 8506.5%216629331,0734,7121.9%+ 15100.0%131185Chery Tiggo 8 Pro2,6293.2%+ 100.8%35866711,3726,4442.7%+ 93.6%6196Kia Picanto2,4993.0%+ 135.5%47766581,0656,8272.8%+ 64.5%5107BYD Atto 32,4873.0%– 1.8%141,6035433415,4962.3%– 43.9%1018Toyota Corolla Cross2,3452.8%– 1.8%59367007096,9172.9%+ 52.5%449Toyota Yaris Cross1,9652.4%– 24.8%64647757266,3582.6%+ 25.8%7610Mazda CX-51,5741.9%+ 60.8%11641,3201904,3291.8%+ 39.1%142311Chery Tiggo 7 Pro1,5101.8%+ 130.5%82594218303,7721.6%+ 124.9%183312Toyota RAV41,4931.8%– 48.0%74185595165,6122.3%+ 5.5%8513Tesla Model Y1,4531.8%+ 22.8%19856965012,3821.0%– 18.1%301814Kia Sportage1,3621.7%+ 1.0%232954925753,7791.6%– 6.6%171215Hyundai Venue1,3531.6%+ 141.2%123494245804,7262.0%+ 162.1%123016Skoda Kamiq1,2811.6%– 10.1%354245133443,4491.4%+ 32.7%202217Dongfeng Box1,2801.6%new711,098531292,0890.9%new3428918Kia Niro1,2181.5%+ 1.8%133074454664,2881.8%– 16.4%15919Hyundai Elantra1,1151.4%– 59.5%103164373625,5232.3%– 26.1%9220Xpeng G61,0941.3%+ 18.3%93514033404,2581.8%+ 360.3%162921Hyundai Tucson1,0801.3%+ 69.0%182443345023,4101.4%+ 37.3%212622Deepal S071,0771.3%new616832361581,5640.6%new4728323Geely EX51,0411.3%new532963424031,3260.5%new53 –24Citroen Berlingo1,0331.3%+ 38.7%222493014833,2471.3%+ 17.7%222725Skoda Octavia1,0041.2%– 30.5%152653354044,8612.0%– 27.7%11326Seres 59991.2%+ 147.9%513904861231,7200.7%+ 43.7%425627MG ZS9941.2%n/a161714623612,8571.2%+ 42.4%233928Lynk & Co 029591.2%new437321041232,6561.1%new2628429MG 39471.1%n/a262643123712,6601.1%+ 53100.0%2518030Skoda Scala9311.1%+ 31.5%302312834172,3941.0%+ 15.9%293231Maxus Mifa 79211.1%new91446438371,3560.6%new5229532Mitsubishi Outlander9181.1%– 40.9%173482782923,6971.5%– 11.7%191133Toyota Yaris8961.1%+ 37.2%272903053012,6111.1%+ 126.3%275234Toyota Land Cruiser7080.9%+ 1813.5%291694131262,2980.9%+ 147.6%317635Kia Stonic7000.8%– 20.5%313011542452,2870.9%– 18.7%322436Skoda Fabia6720.8%– 6.5%462402072252,0290.8%+ 90.2%355337Cherry Tiggo 4 Pro6670.8%new362541662471,7830.7%new41 –38Seat Arona6580.8%– 62.0%251912502172,7821.1%– 27.1%241739Skoda Karoq6290.8%+ 15.4%321732142421,9090.8%+ 90.1%376040Suzuki SX4 Crossover6180.8%– 45.0%381162212811,6200.7%– 52.0%461541Tesla Model 36080.7%– 41.7%72429105741,2490.5%– 46.3%552042Eveasy Limo5880.7%+ 493.9%14855321146690.3%+ 62.0%769643Smart #35520.7%+ 441.2%110164356327930.3%+ 372.0%7114444Cherry Arrizo 85430.7%new502231771431,8320.8%new3932045Toyota Hilux5130.6%+ 110.2%201411352372,2620.9%+ 65.2%334546Kia Seltos4490.5%– 30.0%411871251371,9670.8%– 31.1%362547Subaru Forester4070.5%– 30.4%371081461531,6650.7%+ 27.1%444648Suzuki Swift3870.5%– 30.5%571041551281,2300.5%– 22.3%574449Peugeot 20083810.5%– 31.7%54128901631,2380.5%– 24.5%564250Forthing S73600.4%new171035464030.2%new10636351Hyundai Ioniq 53530.4%+ 82.0%6989891751,0440.4%+ 5.9%636252Seat Ibiza3480.4%– 54.4%561141341001,8350.8%– 6.5%383653Mitsubishi Eclipse Cross3450.4%+ 8.8%6790991561,0780.4%– 29.0%615054Renault Captur3440.4%+ 2357.1%1212508595230.2%+ 135.6%9113655Zeekr 7X3440.4%new206151151423550.1%new111 –56Renault Arkana3420.4%+ 48.7%70631461338630.4%– 31.5%676157Seat Ateca3330.4%+ 39.9%55141123691,0570.4%– 41.9%624158KGM Rexton3190.4%+ 11.9%6078971449710.4%+ 220.5%6510859Opel Frontera3160.4%new –17813803160.1%new118 –60Kia Carnival3060.4%+ 488.5%5959731748250.3%+ 88.4%6912061Isuzu D-Max3040.4%– 31.1%45100661381,4230.6%+ 13.2%495562Renault Austral3000.4%n/a176119156253730.2%– 22.9%10910663Subaru XV2930.4%– 59.2%58821071041,6650.7%– 11.2%453564Hyundai Sonata2680.3%+ 8833.3%4869911081,3620.6%+ 462.8%509865Forthing Friday2510.3%+ 325.4%1140237144170.2%+ 6.6%10412866Toyota Proace City2370.3%+ 88.1%477668931,0270.4%+ 52.1%647867VW T-Roc2340.3%+ 225.0%748764837380.3%+ 32.5%739768Nissan Qashqai2260.3%– 5.0%639971561,8020.7%+ 143.2%406769BYD Dolphin2240.3%– 89.7%21310331812320.1%– 94.8%1401370Nissan Juke2230.3%– 59.8%398880552,5391.0%+ 201.2%286471Skoda Superb2230.3%+ 1138.9%496771859100.4%+ 99.6%6611672Peugeot 30082220.3%n/a4244107711,0860.4%+ 56.7%608773Skoda Kodiaq2170.3%– 30.9%6221511451,3600.6%+ 11.5%514774Hyundai Staria2150.3%+ 400.0%646560905760.2%+ 134.1%8214975Suzuki Vitara/Grand Vitara2120.3%– 10.9%8940130424830.2%– 48.3%966976Cupra Formentor2110.3%– 6.2%655891628200.3%– 19.8%707577Voyah Free2080.3%+ 324.5%1492518213040.1%+ 47.6%12016378Chevrolet Trax2010.2%– 37.4%11214128324360.2%– 70.8%1004979MG HS1990.2%new1205490552650.1%new130 –80Lexus NX1980.2%– 22.4%665364818530.4%+ 0.2%687381Hongqi EHS71930.2%new828265464810.2%new97 –82BYD 05 DMi1920.2%new963758973010.1%new121 –83Xpeng P71900.2%– 35.8%5220146246810.3%– 31.2%756884Skywell ET51810.2%+ 39.2%1247872313220.1%– 45.1%1168885Dacia Sandero1810.2%+ 2162.5%13424361215480.2%+ 6750.0%8718586Audi Q31750.2%– 14.2%903958785090.2%– 5.7%929187Jac 301750.2%new13514414172960.1%new122 –88Leapmotor C101730.2%new8310133396970.3%new7430989Volvo XC601680.2%+ 8.4%993675575030.2%+ 47.1%9312490Renault Trafic1600.2%+ 53.8%943256725530.2%+ 44.8%8510991VW ID.51600.2%+ 100.0%1364592232830.1%+ 126.4%12517392Toyota Aygo/X1580.2%– 0.6%854864465370.2%+ 24.3%8910193KGM Torres1560.2%+ 1200.0%1743535864930.2%+ 4008.3%9419694VW Golf1520.2%– 20.8%686343466080.3%+ 38.2%8010495Dacia Duster1480.2%– 43.1%735648444330.2%– 52.4%1017296BMW X21470.2%+ 79.3%873957515380.2%+ 159.9%8815197BYD Dolphin Surf1470.2%new248687811490.1%new162 –98Maxus Mifa 91460.2%new16123110132420.1%new13433199Fiat Doblo1440.2%– 13.3%1406910654250.2%– 7.8%103107100Xpeng G91420.2%– 47.2%755259315600.2%– 22.9%8377101BYD Seal1420.2%– 40.3%1010115274560.2%– 36.1%9981102Ford Focus1420.2%+ 111.9%204885402690.1%– 29.4%127119103Hongqi EH71400.2%new1328221372360.1%new138 –104Opel Corsa1380.2%+ 100.0%442671416140.3%+ 0.5%7990105BMW X11330.2%+ 22.0%767139235360.2%+ 83.6%90134106Nissan X-Trail1310.2%n/a1238029225580.2%– 21.1%8486107Volvo XC401300.2%+ 3.2%1175241373840.2%– 1.5%107113108Jeep Avenger1260.2%– 38.8%862940574890.2%+ 88.8%95117109Mercedes GLC1240.2%+ 376.9%1062849473820.2%+ 10.4%108132110Peugeot 2081200.1%+ 166.7%1075338293330.1%+ 16.0%113126111Cupra Leon1170.1%+ 207.9%953846333290.1%+ 9.7%114142112Toyota Highlander1160.1%+ 6.4%1112151442960.1%+ 27.0%123143113Mitsubishi ASX1140.1%– 77.1%79148657410.3%– 55.0%7248114Dacia Logan1130.1%+ 98.2%1753821544260.2%+ 313.6%102158115Zeekr X1090.1%– 79.3%812233546690.3%– 59.2%7740116Audi Q4 e-Tron1050.1%– 30.0%84193114120.2%– 15.9%10595117Maxus E-delivery 51050.1%new1838410111510.1%new160347118Voyah Dream1000.1%+ 334.8%190762131350.1%+ 221.4%168237119Cupra Tavascan970.1%new1336819102390.1%new135362120Honda Jazz910.1%– 26.0%1262145252570.1%+ 17.4%132147121Mercedes Vito910.1%+ 15.2%1382932302140.1%+ 0.0%145150122Citroen Jumpy890.1%+ 23.6%1153128302690.1%+ 25.7%126153123BMW X3890.1%+ 8800.0%1392347191790.1%– 21.8%152159124Lexus RX880.1%– 4.3%972933262650.1%– 3.6%129131125Dacia Jogger870.1%+ 163.6% –68190870.0%– 59.7%191165126Mini850.1%+ 25.0%1053819282540.1%+ 3.3%133148127Renault Clio850.1%+ 1316.7%1222345171470.1%+ 23.5%163195128BYD Sealion 07850.1%new1621631381120.0%new183 –129VW Caddy830.1%– 12.6%1022736203230.1%+ 1.6%115130130VW ID.7830.1%new187621651290.1%new174321131Suzuki Jimny820.1%– 38.8%80025573690.2%– 4.9%110110132Genesis GV60820.1%+ 1950.0%146156071500.1%– 47.6%161145133JAC S4820.1%n/a1273817272380.1%+ 72.5%136178134Range Rover Sport810.1%+ 92.9%103927452660.1%+ 71.6%128171135Leapmotor T03810.1%+ 145.5%1672333251420.1%– 22.8%164174136BMW i5810.1%+ 440.0%1961752121240.1%+ 244.4%175254137Mazda3800.1%– 85.3%342828241,2760.5%– 38.7%5434138Audi A3790.1%+ 36.2%1003626173530.1%+ 117.9%112166139BMW IX780.1%+ 2500.0%197482371060.0%+ 171.8%185235140Lexus LBX770.1%– 50.0%771937214790.2%+ 32.7%98112141Lexus UX760.1%+ 85.4%1252127282330.1%+ 16.5%139161142BMW 2 Series520.1%+ 33.3%1191517141820.1%+ 198.4%158217143Ford Explorer740.1%n/a1081823332300.1%+ 6.0%141164144Avatr 11720.1%new –17541730.0%new199 –145Zeekr 001690.1%– 27.4%882718245530.2%+ 25.4%8694146Citroen C4660.1%– 54.8%983221132140.1%– 73.8%14480147BMW X5650.1%+ 71.1%1801320321680.1%+ 28.2%154188148Peugeot 5008650.1%+ 140.7%116243291390.1%– 74.8%166103149Mercedes GLE630.1%+ 687.5%164921331710.1%+ 59.8%153204150Land Rover Defender610.1%+ 125.9%1181625202030.1%+ 111.5%147199151Smart #1600.1%– 55.9%151532232580.1%– 64.5%13183152Chevrolet Traverse600.1%– 55.9%201193382280.1%– 36.5%14293153VW Tiguan580.1%– 87.6%1131916232930.1%– 66.9%12470154NIO ET5570.1%new –5520660.0%new205 –155Volvo XC90560.1%+ 30.2%1591330131000.0%+ 8.7%186209156Alfa Romeo Junior550.1%new1092218152240.1%new143 –157Mini Aceman540.1%new21526208710.0%new201349158Volvo EX30520.1%– 72.2%9344086440.3%+ 43.1%7892159BYD Tang520.1%n/a –811331160.0%– 8.7%180177160Dacia Bigster510.1%new –20274510.0%new213 –161Toyota Camry500.1%– 21.9%78189233210.1%+ 45.2%117154162Mercedes Sprinter 313/316/319/519500.1%– 13.8%163212091230.1%+ 1.7%176176163BMW X4490.1%– 43.0%1501318182000.1%+ 3.1%148168164VW Taigo490.1%+ 390.0%1422315111390.1%+ 1290.0%167228165Baic EU5490.1%new2670445500.0%new214 –166Foton Tunland480.1%new9233782360.1%new137275167Genesis GV70470.1%+ 123.8%1681316181210.0%– 46.7%177156168BMW 1 Series570.1%n/a169918321330.1%+ 392.6%170272169Mercedes CLA460.1%– 65.2%188111619660.0%– 81.8%204133170Hyundai Santa Fe460.1%+ 4500.0%1041518131670.1%+ 103.7%155218171Ora Funky Cat440.1%– 89.4%137417231850.1%– 86.7%15054172Mercedes E-Class440.1%+ 33.3%143821151670.1%+ 53.2%156192173Peugeot 408420.1%+ 16.7%1814335760.0%+ 26.7%196224174BMW 5 Series400.0%– 27.3%147134231910.1%+ 17.2%149175175Kia Sorento400.0%+ 66.7%21731819460.0%– 96.0%21866176Honda HR-V400.0%+ 344.4%1651711121180.0%+ 1211.1%178231177Kia EV3400.0%new –4000400.0%new222 –178Audi A5390.0%+ 550.0%1441214131340.1%+ 262.2%169260179Opel Combo380.0%– 63.5%1291610122100.1%– 53.6%146111180Jaecoo 5 380.0%new –14240380.0%new226 –181Mercedes GLA370.0%+ 32.1%19261516680.0%– 68.4%203167182Audi Q2340.0%+ 142.9%128161351660.1%+ 36.1%157182183Toyota Proace330.0%+ 3200.0%19914514580.0%+ 241.2%211250184Mercedes CLE320.0%new15281681080.0%new184348185Nissan Sentra310.0%– 83.6%1561110106020.2%– 10.7%8189186Hyundai Ioniq 6290.0%– 68.8%18410217870.0%– 83.9%19099187Mini Countryman290.0%+ 81.3%2031694580.0%– 18.3%210219188VW T-Cross280.0%– 26.3%17316661550.1%– 41.1%159129189BMW X6280.0%– 24.3%158610121410.1%+ 41.0%165201190Lexus ES260.0%+ 62.5%1854715780.0%– 10.3%195206191VW Crafter260.0%+ 550.0%170989620.0%+ 244.4%207290192Opel Mokka250.0%– 67.9%13151371300.1%– 45.8%173141193Mazda CX-90250.0%– 52.8% –1186280.0%– 69.2%235198194Lexus RZ250.0%– 21.9%1722815600.0%– 38.8%209191195Audi A1230.0%– 64.6%157878900.0%– 17.4%188190196Fiat Scudo230.0%– 8.0%1914136740.0%+ 37.0%198213197Genesis GV80220.0%– 18.5%193895790.0%+ 2.6%194212198Range Rover Evoque220.0%+ 10.0%186769630.0%– 3.1%206222199Porsche 911220.0%+ 633.3%2116511500.0%+ 733.3%215310200MG Cyberster220.0%new2512200240.0%new240 –201Voyah Courage220.0%new –985220.0%new244 –202BMW 3 Series140.0%– 51.7%202264880.0%– 77.2%189125203BMW 4 Series210.0%+ 61.5%1606871320.1%+ 41.9%171211204BMW i4210.0%+ 90.9%1790192730.0%– 30.5%200202205KGM Musso200.0%– 16.7%22803171320.1%+ 57.1%172208206Audi Q8200.0%+ 33.3%1781055790.0%– 31.9%193194207KGM Tivoli200.0%new –7112200.0%new249 –208Mercedes C-Class190.0%– 75.9%155595850.0%– 78.4%192127209Porsche Macan190.0%n/a177568700.0%+ 1066.7%202238210Renault Kangoo190.0%n/a –1900190.0%+ 1800.0%250361211Audi Q5180.0%+ 1700.0% –1512200.0%– 90.8%245160212Foton E-Tunland180.0%new –189180.0%new251 –213Opel Grandland X170.0%n/a226494230.0%+ 53.3%242298214MG 4160.0%– 96.6%3316001,7100.7%– 24.4%4331215Maxus Deliver 3160.0%– 50.0% –1600260.0%– 74.0%236205216Ford Ranger160.0%– 40.7% –1042160.0%– 91.5%254172217BMW 7 Series140.0%+ 27.3%208563410.0%+ 13.9%220259218Maxus E-Terron 9 130.0%new –1300130.0%new265 –219Cadillac XT6120.0%+ 33.3%209912340.0%– 17.1%228245220Porsche Cayenne120.0%+ 50.0%220354300.0%– 42.3%234241221Range Rover120.0%+ 200.0%233444250.0%+ 127.3%238303222NIO EL6120.0%new2641101390.0%new223 –223Hongqi E-HS9120.0%new2501101140.0%new257 –224Cadillac Optiq120.0%new269138130.0%new260 –225GAC Aion HT120.0%new –1200120.0%new269 –226Kia EV9110.0%– 26.7%258146200.0%+ 11.1%246274227Mercedes G-Class110.0%+ 266.7%198263340.0%+ 9.7%230266228Fiat Ducato110.0%+ 450.0%194533490.0%+ 145.0%216263229Maxus Deliver 9110.0%new –0110150.0%new255 –230Audi Q6 e-tron110.0%new153227530.0%new212 –231GAC Aion V110.0%new –1100110.0%new272 –232GAC Aion Y110.0%new –1100110.0%new273 –233Mercedes GLS100.0%n/a230235200.0%– 59.2%247247234Subaru Outback90.0%– 18.2%195036390.0%– 33.9%224229235Lexus IS90.0%+ 80.0%214234300.0%– 11.8%233255236Chevrolet Colorado90.0%+ 350.0%182252610.0%+ 2950.0%208291237Audi Q790.0%+ 800.0%189441450.0%– 16.7%219234238Lynk & Co 0890.0%new –81090.0%new282 –239Honda Civic80.0%– 70.4%229521130.0%– 79.0%261233240Mercedes S-Class80.0%– 11.1%223233170.0%– 73.0%252232241Range Rover Velar80.0%+ 100.0%255026160.0%– 11.1%253293242Volvo EX9080.0%new265530100.0%new276 –243BMW XM70.0%+ 250.0% –32290.0%– 35.7%278294244Genesis G8070.0%n/a224214220.0%– 33.3%243262245Renault Master60.0%– 57.1% –42070.0%– 83.7%289252246Peugeot Boxer/71860.0%– 40.0%218402130.0%– 84.1%262225247Opel Astra60.0%– 25.0%200231250.0%+ 4.2%237265248Alfa Romeo Giulia60.0%+ 0.0%219132310.0%– 31.1%231248249Jeep Grand Cherokee60.0%+ 500.0%205015380.0%– 73.8%225186250NIO ES860.0%new247600120.0%new267 –251Foton E Toano60.0%new24914180.0%new284 –252Jeep Wrangler50.0%– 64.3%1542301140.0%– 23.5%181183253Porsche Taycan50.0%+ 0.0%234122130.0%– 35.0%264276254BMW X750.0%+ 25.0%259212100.0%– 23.1%274300255IM Motors IM550.0%new –50050.0%new295 –256IM Motors IM650.0%new –50050.0%new296 –257Alfa Romeo Stelvio40.0%– 71.4%221022240.0%– 48.9%239246258Bentley Continental40.0%+ 300.0% –21190.0%+ 200.0%277334259VW Transporter30.0%– 98.7%2071201180.0%– 60.3%17982260Mercedes EQE30.0%– 94.3% –02130.0%– 98.7%305162261Audi A630.0%+ 50.0%24410270.0%– 76.7%286269262Land Rover Discovery Sport30.0%+ 200.0%22502190.0%+ 80.0%280330263Citroen C3 Aircross30.0%n/a –30030.0%n/a306 –264Maxus E-Deliver 5 Combi30.0%new –30030.0%new307 –265Kia Ceed20.0%– 96.8%130002910.0%– 76.9%187115266BMW i720.0%– 33.3%24502050.0%– 50.0%293311267Alpine A11020.0%+ 0.0% –20020.0%– 71.4%319328268Chevrolet Tahoe20.0%+ 100.0% –10130.0%+ 50.0%301350269Ferrari 29620.0%n/a26100230.0%+ 0.0%303335270Aston Martin Vantage20.0%n/a –02020.0%+ 100.0%320356271Infiniti QX6020.0%n/a –02020.0%– 94.9%321258272Maxus Deliver 720.0%new216200110.0%new271 –273Cadillac Lyriq20.0%new22202090.0%new279 –274Foton E-view20.0%new23702060.0%new291 –275Ferrari 12 Cilindri20.0%new27010130.0%new302 –276MG S520.0%new –20020.0%new322 –277Yudo JY Air20.0%new –11020.0%new323 –278Suzuki Ignis10.0%– 99.7%2530013080.1%– 70.8%11957279Lynk & Co 0110.0%– 99.2% –10010.0%– 99.8%334121280Mercedes EQA10.0%– 98.9% –10010.0%– 99.7%335138281Citroen C5 Aircross10.0%– 98.8%227010340.0%– 91.3%229122282BMW Z410.0%– 80.0%232100130.0%– 35.0%259279283Porsche Panamera10.0%– 80.0%235010130.0%+ 85.7%263325284Chevrolet Corvette10.0%– 66.7%23101080.0%– 38.5%283286285Land Rover Discovery10.0%– 50.0%23600170.0%+ 16.7%287319286Audi A710.0%+ 0.0%25600140.0%– 81.8%297277287Lexus LM10.0%+ 0.0% –00120.0%+ 100.0%310358288Bentley Bentayga10.0%n/a26010050.0%+ 150.0%292341289Bentley Flying Spur10.0%n/a26300130.0%+ 200.0%300343290Lexus LS10.0%n/a –01020.0%+ 100.0%311353291Maxus E-Deliver 310.0%n/a –01010.0%n/a336 –
Source: cartube.co.il


More Stories
Transformative Solo Travel: How One Trip Changed My Daily Habits and Mindset
Solo travel has quietly become one of the most powerful tools for personal reinvention. Search interest in “solo travel” hit...
Knowing When to Repair or Replace Bike Parts
Keeping a bike in good condition rarely comes down to a single decision. It is more of an ongoing judgment...
China imports February 2026: Toyota Land Cruiser, BMW 7 Series stand out, sales off -18.3%
This content is for members only. Visit the site and log in/register to read.
Big Loads, Big Pay: How to Land Heavy Haul Work as an Owner Operator
If you drive your own truck and you want higher rates, heavy haul can look like the next level. You...
2027 Volkswagen Atlas Gets More Power, Smarter Tech, and a More Upscale Family-SUV Feel
Volkswagen is giving the Atlas a meaningful overhaul for 2027, and while the overall shape remains familiar, this second-generation version...
GM Extends Factory ZERO Shutdown as EV Demand Stays Uneven
General Motors is keeping its Factory ZERO plant in Detroit-Hamtramck offline through April 13, extending a production pause that began...