
Pakistan September 2025: Sales up 66.8%, Suzuki Ravi up to #2
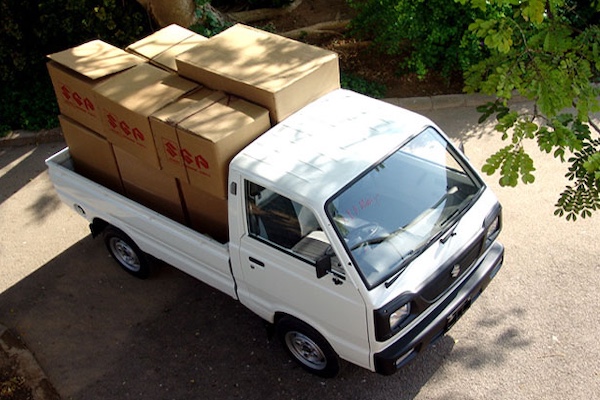
The Suzuki Ravi is up to #2 in Pakistan in September.
Sales of locally made new light vehicles surge 66.8% year-on-year in September to 17,174 units according to local association PAMA. The year-to-date volume is now up 41% to 129,614. Note Changan and Kia do not report sales figures to PAMA but are reported to be quite successful here. Suzuki (+79.5%) outpaces the market to reach 52.4% share vs. 46.8% so far this year. Toyota (+33.2%) isn’t that lucky and falls to 18.4% share vs. 23.7% year-to-date. Honda (+81.8%) and Sazgar Haval (+81.8%) shine. Model-wise, the Suzuki Alto (+50%) stays on top with 27.5% share but the performer of the month is the Suzuki Ravi up a surreal 327.3% year-on-year and 5 spots on August to #2. The Suzuki Swift (+130.8%) also impresses at #4.
Previous month: Pakistan August 2025: Suzuki Swift shoots up to #2, market up 61.5%
One year ago: Pakistan September 2024: Market up 23.9%
Full September 2025 Top 10 All brands and Top 25 All models below.
Pakistan September 2025 – brands:
PosBrandSep-25%/24Aug2025%/24PosFY241Suzuki8,99752.4%+ 79.5%160,68846.8%+ 33.2%112Toyota3,15218.4%+ 33.2%230,74123.7%+ 55.8%223Honda2,30713.4%+ 81.8%416,09212.4%+ 37.8%334Sazgar Haval1,4268.3%+ 73.1%510,1537.8%+ 52.5%555Hyundai1,1756.8%+ 55.8%310,3248.0%+ 38.9%446Isuzu400.2%+ 700.0%9630.0%– 40.6%987Dewan Honri300.2%new71770.1%new898JAC240.1%– 50.0%61,0270.8%+ 49.1%669Dewan Kia200.1%+ 42.9%82930.2%+ 380.3%7710BAIC30.0%+ 0.0%10570.0%+ 54.1%1010
Pakistan September 2025 – models:
PosModelSep-25%/24Aug2025%/24PosFY241Suzuki Alto4,71827.5%+ 50.0%138,11029.4%+ 24.9%112Suzuki Ravi1,72210.0%+ 327.3%75,7674.4%+ 153.9%893Sazgar Haval H61,4268.3%+ 73.1%410,1537.8%+ 52.5%334Suzuki Swift1,4038.2%+ 130.8%28,9526.9%+ 78.8%465Toyota Corolla (est)1,2217.1%+ 41.0%310,6738.2%+ 47.7%226Honda Civic (est)1,1276.6%+ 72.9%117,9966.2%+ 32.7%647Toyota Yaris (est)9825.7%+ 40.9%58,5866.6%+ 47.5%558Honda City (est)8504.9%+ 73.1%166,0334.7%+ 32.8%779Suzuki Every7214.2%new133,7062.9%new122010Hyundai Tucson5613.3%+ 114.9%64,0333.1%+ 63.5%101211Toyota Corolla Cross (est)4522.6%+ 41.3%103,9463.0%+ 55.8%111012Suzuki Cultus4272.5%+ 623.7%82,9382.3%+ 30.2%141113Hyundai Porter3742.2%+ 45.0%152,5862.0%+ 30.8%151514Honda BR-V & HR-V3301.9%+ 161.9%142,0631.6%+ 86.2%161815Toyota Hilux (est)2741.6%+ 2.6%94,1523.2%+ 81.4%91316Toyota Fortuner (est)2231.3%+ 2.8%123,3842.6%+ 81.6%131617Hyundai Elantra1310.8%+ 31.0%171,6641.3%+ 78.7%171918Hyundai Sonata580.3%+ 0.0%201,0190.8%+ 67.9%212219Hyundai Santa Fe510.3%– 33.8%191,0220.8%– 29.6%201720Isuzu D-Max400.2%+ 700.0%24620.0%– 41.5%252421Dewan Honri-Ve300.2%new211770.1%new232522JAC X200240.1%– 50.0%181,0270.8%+ 49.1%192123Dewan Kia Shehzore200.1%+ 42.9%232930.2%+ 380.3%222324Suzuki WagonR60.0%– 96.7%221,0600.8%– 53.4%181425BAIC BJ40L30.0%+ 0.0%25530.0%+ 43.2%2626
Source: PAMA
More Stories
Sony and Honda Pull the Plug on Afeela 1 and the Dream EV Suddenly Looks Over
For a project that once felt like a bold glimpse into the future, the Afeela 1 has reached an abrupt...
Lincoln’s New Tropical Paradise Theme Turns the Navigator and Nautilus Into a Beachside Escape
Lincoln is giving its Rejuvenate experience a fresh seasonal twist with the debut of Tropical Paradise, a new multisensory theme...
What to Do After a Car Accident in Fort Worth, TX: Important Steps That Can Protect You
Roads stay busy every single day, especially in growing cities where traffic moves fast, and drivers depend on routine to...
The Investigation Process Behind Car Accident Claims in Kansas City, MO
A car accident may last only seconds, but the questions that follow can take far longer to answer. What truly...
Why Car Accident Victims Need an Experienced Lawyer on Their Side in Houston, TX
Traffic in Houston, TX, is relentless, and the roads carry more than just cars—they carry unexpected risks that can upend...
From Crash to Claim: Handling Car Accident Cases the Right Way
Everything can look normal until one sudden crash changes the direction of your day and leaves behind a chain of...